 MetaTrader 5
 Experts
 Indicatori
 librerie
 Utilità
 Widget
 Regole
Guarda i video tutorial del Market su YouTube
Come acquistare un Robot di Trading o un indicatore
Esegui il tuo EA
hosting virtuale
hosting virtuale
Prova un indicatore/robot di trading prima di acquistarlo
Vuoi guadagnare nel Market?
Come presentare un prodotto per venderlo con successo
Nuovi Expert Advisors e Indicatori per MetaTrader 4 - 318
 I robot di trading eseguono le operazioni di mercato automaticamente, mentre gli indicatori permettono di analizzare al meglio le quotazioni e prevedere il comportamento dei prezzi. Con queste applicazioni, sarai in grado di eseguire operazioni in MetaTrader 4 in modo più consapevole, cogliendo più opportunità.
PDP indicator is used for: defining price probability distributions. This allows for a detailed representation of the channel and its borders and forecast the probability of a price appearing at each segment of its fluctuations; defining the channel change moment.
Operation principles and features
PDP analyzes a quote history on lower timeframes and calculates a price probability distribution on higher ones. Forecast algorithms allow the indicator to calculate probability distributions and mov

NC Tendency EA is a trending single EA system that supports single currency or multi currency operations. Trend is determined according to the last 20 K-line. Depending on the detected trend, the EA opens either long or short trades. It sends an order in accordance with the trend direction daily at 4:00 am (GMT+2 ). Uses fixed stop loss and take profit, human intervention not needed. It opens only one order per day for each symbol. No new orders will be placed until the order is closed, but a ne

This multicurrency indicator is the Lite version of the Cosmic Diviner Reversal Zone Pro indicator. The indicator is based on original formulas for analyzing the volatility and price movement strength. This allows determining the overbought and oversold states of instruments with great flexibility, as well as setting custom levels for opening buy or sell orders when the overbought or oversold values of the instruments reach a user-defined percentage. A huge advantage of Reversal Zone Lite is the

This Expert Advisor opens only one order. For the EA to operate correctly, the terminal must be running at all times. The algorithm opens deals after calculating the deviation of the price from the average range. Orders are closed using the Parabolic indicator. A protective stop loss is always set for each order. The minimum deposit amount per 0.1 lot is 5000 USD. ATTENTION!!! The EA works on all currency pairs and all timeframes. To obtain stable trading results, it is recommended to use only E

This utility allows to quickly scan markets on different timeframes without dragging symbols from Market Watch. It supports multi timeframe analysis, ie. 3 different timeframes can be scanned. Additionally, it saves objects drawn of chart to file and synchronize its between other windows. Also, this utility will automatically save all objects and drawing to a file and restore when switching back; also template will be loaded on other charts, too. The watchlist is based on instruments listed on M

The Renko_Bars_3in1 is designed for plotting 3 types of Offline Renko charts. Standard Renko Bar (the reversal bar is twice the size of the bar). Renko Range Bar (the size of all bars is the same). Renko Bars with the ability to adjust the size of the reversal bar. Attention : The demo version for review and testing can be downloaded here . Note . A chart with the M1 period is necessary to build an offline chart. When the indicator is attached to a chart, the offline chart is opened automaticall

DYJ Sharp advanced algorithm that detects new trends and current trend continuations for use as an entry and exit strategy. The strategy display the SHARP trend demarcation area. This SHARP area has high HighLine and low LowLine. Falling of high below HighLine of SHARP and then falling of close below LowLine of SHARP can be interpreted as a signal to sell. Rising of close above HighLine of SHARP and then rising of low above LowLine of SHARP can be interpreted as a signal to buy. The signal for e

This tool allows you to better analyze your chart. With "Crosshair Percent", you can calculate distances in the chart in a percentage way (in a very simple way, when the pointer is attached in the form of a crosshair: CRTL + F). The utility allows to measure and/or calculate the movements of the price NOT only in points, use a measure in professional terms as it is the percentage. The result is shown in two parts of the screen, one of them, next to the position of the pointer and the other in a

This simple to use utility allows opening charts from the list of financial instruments by left clicking their names. The chart window is opened using the Default template. The template name can be changed to one of those stored in Charts-Templates section of the terminal. It is possible to customize the background colors of panels and their labels, and also to select the display type for a more comfortable working environment. This is all you need to know in order to see the result quickly.
Pa

This indicator is designed to help traders in determining the market entry and exit points. It is very easy to use: open s BUY deal when the up arrow appears and open s SELL deal when the down arrow appears. The indicator is based on the basic indicators (MA, MACD, RSI) as well as original algorithms. The indicator does not redraw, arrows appear when a new candle opens. Input Parameters:
strength - indicator period EnableAlerts - enable/disable alerts EmailAlert - send notifications to email wh

The StarBot utility works with open Sell and Buy orders, partially closes profit when the specified level is passed. There are three levels for partially closing the Sell and Buy orders. The utility also transfers Stop Loss to breakeven when the specified level is passed. It works on all currency pairs and timeframes. Demo version for testing can be downloaded at: https://www.mql5.com/en/market/product/27247
Input parameters Follow the orders - manage all orders, or select from Sell and Buy. Al

FXFledgling Exit Tool is a complete risk management tool that analyzes both the open trades and the direction of the pair of open trades. As long as the suggested entry and lotsizing management presented here is followed strictly, you will have a high chance (but no guarantee) of surviving the trade.
What It Does It is used as an exit tool. It helps the trader to manage any manual trade that he transacted. It does the following: Trail Stop Dynamic Stop Loss - a calculated stop-loss that changes

The system applies Fibo levels. Apart from basic Fibo levels (23.6; 38.2; 50.0; 61.8; 100.0;), the EA features custom levels (34.0; 36.0; 64.0; 66.0;). You can decide the levels trading is to be performed from. Sample trade: when the market is bullish and the price rolls back to the levels (as we remember, we select the levels on our own), the EA opens buy orders. The opposite is true for sell orders. The EA can work in three modes. Each of the modes is a separate Fibo levels construction method

All patterns from Encyclopedia of Chart Patterns by Thomas N. Bulkowski in one indicator. It draws an up or down arrow whenever a pattern is identified. Patterns are selected in the drop-down list of the Pattern variable (located at the beginning of the properties window). The indicator has numerous external parameters, some of them apply to all patterns, while others are selective. To see more information on the parameters used for the selected pattern, enable the ShowHelp variable (located at

This indicator shows the current market situation relative to the price volatility channel, its external and internal boundaries, displays the last direction of the price movement. The main purpose of the indicator is to identify the trend movement and its boundaries. With a wide channel, it can be used for determining the initial price movement waves. It works on any instrument and any time frame of the chart. It works in 2 different modes: The first mode shows any changes in the channel when t

The Expert Advisor has a signal filter consisting of two parameters, which evaluates the overbought and oversold states of a financial instrument. It is possible to configure all essential parameters for buy and sell trades separately or to disable one of the directions for a greater flexibility in trading. To complete the EA operation correctly, the "Stop EA" button is provided. Once pressed, it raises the flag to prevent opening orders on new signals. Averaging with certain limitations is used

Breakthrough Solution For Trend Trading And Filtering With All Important Features Built Inside One Tool! Trend PRO's smart algorithm detects the trend, filters out market noise and gives entry signals with exit levels. The new features with enhanced rules for statistical calculation improved the overall performance of this indicator.
Important Information Revealed Maximize the potential of Trend Pro, please visit www.mql5.com/en/blogs/post/713938
The Powerful Expert Advisor Version
Automatin
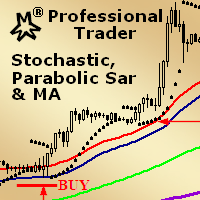
MMM Stochastic, PSAR & MA: This EA's strategy is a combination of two indicators types (Oscillator and Trend) and a Moving Average which helps to enhance the price trends signals and decide to open a new order at the right time. There is an Stochastic (Oscillator) indicator, a Parabolic SAR (Trend) indicator and a Moving Average that you may tune by using the strategy tester optimization to help you to find the best input values that will give you the best results ; It is highly recommended for
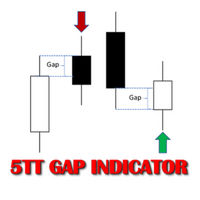
In Forex trading, the Open price of a new period is usually the same as the close price of the preceding one. If a new period opens at a price significantly different (higher or lower), this gives way to a Gap scenario. This suggests an imbalance in the price action. Price tends to move during the new period to cover the gap created. This move presents consistent buying and selling opportunities; hence potential to make profit. There are two types of Gap scenarios 'Gap Up' - Open price of the ne

Brief Description of the All Trend Lines Indicator The indicator analyzes the wave structure of the market. What it displays on the chart: First. Wave pivots (semaphores)
• Red markers – wave highs
• Yellow markers – wave lows
• Yellow-green markers – additional local extremes Second. Trend lines
• Purple/blue lines – trends based on highs (resistance/support)
• Beige/green lines – trends based on lows
• Lines are built automatically by connecting wave pivots of the same type Third. Main trend

This is a trend following indicator that identifies optimal entry points in the direction of a trend with an objective stop loss to manage the trade. The indicator allows you to catch trend early and ride it. The Indicator draws resistance line as it detects an Uptrend and draws support line when it detects a Downtrend on the chart. When those levels are broken, that allows you to identify the Trend Direction and Momentum in the direction of prevailing trend which offers optimal entry points in
FREE

This is a ready-made strategy for binary options! Support/resistance levels are used to form a signal, while a number of built-in indicators are applied to sort out incoming signals. An arrow appears during a signal formation. If the signal is active, then the arrow remains after the close of the bar; if the signal is not strong enough, the arrow disappears. With a small number of signals and a small trading time, you will not need to sit all day at the computer, especially since you can enable

ABCMarketsControl.ex4 utility manages already opened trades on any symbol by moving them to a breakeven when the price reaches a certain level. Besides, if the price goes further in favorable direction, the utility moves Stop Loss and Take Profit accordingly. The utility is most convenient for use on medium and long terms, as well as when trading on news. The parameters set by default are optimal, but it is better to select them individually for each trading symbol according to personal experien
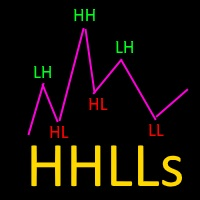
Based on Vitali Apirin's idea, here is a momentum indicator that he describes as a tool to help traders determine the direction of a trend. If the green line is over the red line, the trend is upward; if the red line is over the green one, the trend is downward. The indicator is made up of two separate calculations: the HHs or higher high stochastic, and the LLs or lower low stochastic, which together comprise the HHLLs. Vitali Apirin uses ideas he discovered while studying the stochastic oscill

ScalpingPro is a new indicator for professional traders. The indicator is a ready-made scalping strategy. The algorithm calculates a micro trend, then searches for price roll-backs and forms a short-term trading signal according to a market price. The indicator consists of a data window and a graphical signal on the chart in the form of an up or down arrow. The data window displays the current trading symbol, spread and appropriate trader's actions: WAIT, SELL and BUY .
Advantages the indicator

The Vortex Indicator was inspired by the work of an Austrian inventor, Viktor Schauberger, who studied the flow of water in rivers and turbines. Etienne Botes and Douglas Siepman developed the idea that movements and flows within financial markets are similar to the vortex motions found in water. The Vortex Indicator was also partly inspired by J. Welles Wilder's concept of directional movement, which assumes the relationship between price bars gives clues as to the direction of a market. This i
DSProFx Momentum Indicator is a forex indicator that works based on market price momentum calculation which shows combination of two different timeframes.
Concept DSProFx Momentum Indicator works in any timeframe with the main concept is giving momentum index to each candle or bar which is calculated from the Bar Volume , LookBack Period and Candle Direction (Bearish or Bullish).
Formula Momentum Index = Sum (Bar Volume * Weight) / Total Weight.
Features DSProFx Momentum Indicator is a separa

The Expert Advisor has been specifically developed for trading gold (Spot Gold). The strategy is based on Fibo levels calculated from the previous (first) candle High/Low and the width of the current and lower timeframes channel. If important Fibo levels of different orders are located in a single price channel (within a spread), the EA defines this channel as the target for price movement and starts operation. Martingale and averaging are not used. Each order is independent and is accompanied b

This Expert Advisor trades on the active market. The robot virtually analyzes the chart setting two levels at a specified distance from the price. Upon expiration of 5-15 seconds (set in the parameters), the levels are re-set. As soon as the price starts moving very fast and breaks through one of the levels, a buy or a sell order is placed at once depending on what level has been broken (upper one - buy, lower one - sell). The EA has a strict stop loss (if the bar the order has been opened at is

ABCMarketsControldemo is a demo version of the ABCMarketsControl utility that manages already opened trades on any symbol by moving them to a breakeven when the price reaches a certain level. Besides, if the price goes further in favorable direction, the utility moves Stop Loss and Take Profit accordingly. You can check the utility operation in the strategy tester on any symbol on a period from January 1 to December 21, 2017 by setting the time_start_buy_demo and/or time_start_sell_demo paramete
FREE

Price Shadow EA is a fully automated Expert Advisor. The EA is a medium-term scalper. The EA opens trades when these events occur: The EA searches a main trend, then waits for a medium trend to be exhausted at OBOS levels (pullback). It confirms that medium trend reversal with the indicators. The EA opens a trade with or without a take profit. If the first trade is at a loss and you have not set "Max Orders" to 1, the EA waits for new trade opportunities at that symbol. If you did set Min Distan

Market Trend - a comprehensive system for determining the trend direction. Analyzes the market using a formula which considers the values of multiple technical indicators and other trading strategies. IT determines not only the current trend direction, but also its movement strength. The indicator is intuitive and very easy to use. The information on the current trend direction and its movement strength are displayed on the chart. If the indicator shows "UP!" then an uptrend is currently present

The Trinity Trend Expert Advisor opens deals along the trend on the M15 timeframe on the GBPUSD, USDJPY, USDCHF currency pairs. EURUSD and USDCAD can also be used. The presence of a trend is determined by a steady price movement over the last 3 days. Next, the rebound is analyzed using a number of indicators and a position is opened along the trend when the MA 34 is broken (examples are shown in the screenshots). Backtests were performed with stop loss = 5000 and take profit = 20. Semi-automatic

Questo è un indicatore di avviso di candela che inghiotte Multi Timeframe. Puoi utilizzare solo l'intervallo di tempo corrente o tutti gli intervalli di tempo da 1 minuto a quello mensile.
Questo è un indicatore MTF non riverniciabile.
Quando utilizzi l'opzione degli intervalli di tempo selezionati, (modalità MultiTimeframe), puoi vedere i segnali sull'intervallo di tempo corrente e superiore.
Sono disponibili avvisi pop-up, e-mail e notifiche push per ciascun intervallo di tempo scelto sepa

Avvisi rapidi offre un metodo rapido e conveniente per creare e attivare gli avvisi per gli oggetti MT4. Prossimamente nella versione 4.0: crea avvisi significativi che ti avvisano esattamente quando vuoi essere avvisato e riduci il fastidio specificando il tipo di avviso Breakout o Approach. Gli avvisi rapidi sono configurati per impostazione predefinita per creare automaticamente avvisi per i seguenti oggetti quando vengono posizionati su un grafico: Linee Orizzontali Rettangoli Linee di tende

This unique multi-currency strategy simultaneously determines the strength of trends and market entry points, visualizing this using histograms on the chart. The indicator is optimally adapted for trading on the timeframes М5, М15, М30, Н1. For the convenience of users, the indicator renders the entry point (in the form of an arrow), recommended take profit levels (TP1, TP2 with text labels) and the recommended Stop Loss level. The take profit levels (TP1, TP2) are automatically calculated for

This unique multi-currency strategy simultaneously determines the end of the trend, entry points and the expected take profit levels for each trade. The indicator can determine entry points on any trading period from M1 to D1. For the convenience of users, the indicator renders the entry point (in the form of an arrow), recommended take profit levels (Fast Take Profit, Middle Take Profit, Main Take Profit, Global Take Profit) and the Stop Loss level. The detailed guide on how to use the indicato

PipTick World Flow indicator is a unique tool that allows traders to see the flow of the global economy in one window. Basically, it shows the current strength of oil, gold, dollar and stock market in one chart. It helps to understand the basic relations and correlations between those markets.
Relationships between markets Oil - The Boss - The whole world economy is based on oil. Oil is the king, the boss of all bosses, the capo di tutti. Oil instructs gold what to do. Gold - The Manager - Gold

This indicator contains a custom version of the classic Turtle Trader indicator. It implements both the main system ( S1 ) and fail-safe system ( S2 ) as described by the original Turtles. Notifications can also be enabled for trade signals. The main rule of the indicator is to generate a signal when a T -period breakout occurs. A stop signal is then generated when an S -period high or low is breached. The T -period value is the number of periods used to evaluate a trend. S -period values are th

Easy to use trend indicator. Only one adjustable parameter that does not require optimization, which is responsible for the timeframe of the second line of the indicator. It can take three values: current - the second line is not calculated, one higher - one timeframe higher that the current one, two higher - two timeframes higher than the current one. The system for determining the market direction is based on a proprietary method, which uses the two most effective standard indicators (CCi and

SwapTrader is a simple Expert Advisor for swap trading at the end of the day. The EA scans the current chart instrument and instruments specified in the settings, looking for the currency and order with the positive swap. It opens positions with positive swaps after user-defined time and then closes these positions after user-defined time as soon as the specified profit is reached. The EA trades the current currency and instruments listed in the settings.
Expert Advisor Settings SymbolsList - l
FREE

Description VisualHistory plots positions (Buy and sell orders only) from history of account on a chart. It draws the standard arrows for entry/exit and connects them by the dashed line. Also, VisualHistory displays information on the top left corner of a chart concerning displayed positions: positions count, net profit. Download it to the <MQL4/Experts> directory of your MetaTrader.
Options
Start date for history orders - start date of displayed trade history End date for history orders - end
FREE

Il Two MA Crossover è un potente sistema di notifica progettato specificamente per i trader che si affidano alla Moving Average Crossover Strategy . Questo indicatore completamente automatizzato funge da sistema di avviso completo, assicurandoti di non perdere mai un evento di trading cruciale. Invia notifiche al tuo dispositivo mobile, e-mail e visualizza avvisi pop-up con audio sul tuo computer, tutto quando rileva un crossover della media mobile in base ai tuoi parametri preferiti. Un

Con questa utility, cambiare la visibilità degli oggetti per i singoli oggetti non è mai stato così facile. Ciò contribuirà a eliminare il disordine che affligge i trader di MetaTrader 4 quando creano oggetti e quindi passano a un intervallo di tempo più alto e vedono che gli oggetti interferiscono con la visibilità del grafico. Per impostazione predefinita, ogni nuovo oggetto creato ha la visibilità impostata sull'intervallo di tempo corrente e inferiore. Questa impostazione può essere modifica

The robot works best on Н4 and opens trades only at the beginning of a week. It applies built-in parameters to define the price movement for the previous time period (last hours of the previous week, last weekday and last week) and opens contracts with the minimum take profit. I usually use the robot on 10 pairs with the minimum spread (for four-digit quotes): usdchf 3, gbpusd 3, eurusd 2, usdjpy 2, usdcad 3, audusd 3, eurjpy 3, nzdusd 4, eurgbp 3, gbpjpy 6. The EA features the predefined settin
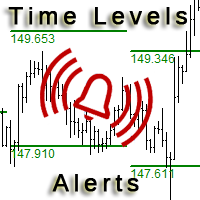
This is an expanded version of the Time Levels indicator provided with sound alerts notifying of level intersection. The indicator is designed for displaying the following price levels on the chart: Previous day's high and low. Previous week's high and low. Previous month's high and low. Each of the level types is customizable. In the indicator settings, you set line style, line color, enable or disable separate levels. This version is provided with an option for alerting using an audio signal a

Correct market entries and exits are essential for any Forex trader. MasterArrow indicator addresses this issue. It has no redundant elements and draws only buy/sell arrows. The up arrow is a BUY signal, while the down arrow is a SELL one. The indicator is simple to configure. Change the Strength parameter to configure the signals frequency. The product is based on standard indicators (MA, RSI, ATR, etc.). But it also features the custom algorithm allowing to combine them into a single tool and
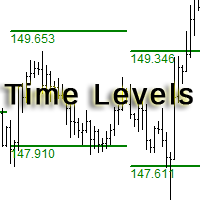
The indicator is designed for displaying the following price levels on the chart: Previous day's high and low. Previous week's high and low. Previous month's high and low. Each of the level types is customizable. In the indicator settings, you set line style, line color, enable or disable separate levels. The version of the exact same indicator but only with sound alerts there - Time Levels with Alerts .
Configurations ----Day------------------------------------------------- DayLevels - enable/
FREE

Tarantula is a trend Expert Advisor that looks for entry points based on the standard Moving Average indicator. It works with two timeframes selected in the settings. The EA looks for the points of trend change and opens an order when the signal matches on different timeframes. All orders are protected by stop loss. However almost all orders are closed by the EA on a signal change.
Parameters SL - stop loss. TP - take profit. OnWork_1 - enable/disable searching for signals on the first timefram
FREE

This Utility is a tool to manage level of profits or losses for each order without using stop loss or take profit. The Utility applies virtual levels to close orders in profit or loss. You can use the robot to manage manually opened orders or manage orders opened by another EA.
You can to get the source code from here .
Parameters OrdersManage - orders to manage (all orders of all symbols or orders on the current chart). Stop Loss Pips - virtual stop loss level. Take Profit Pips - virtual take
FREE
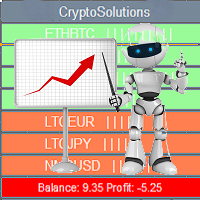
This indicator shows the current situation on the cryptocurrencies available for trading, depending on the signal strength specified in the settings. It can be used for determining the expected increase/decrease in the asset price, displayed by the corresponding color, and the signal strength, displayed by a vertical dash near a certain cryptocurrency pair. Indicator Parameters Panel color - color of the indicator panel Long color - cryptocurrency pair uptrend color Short color - cryptocurrency
FREE

Optimizes the value of overbought and oversold on each new bar. This expert strives to choose the best values for a simple strategy where it sells when the indicator crosses below an overbought level and executes a buy when it crosses above an oversold level. The best overbought and oversold level is calculated on each new bar according to how that value would have performed during the optimizing periods which can be specified.
Inputs Unique number for this EA - can be any integer value. Optimi
TrendySignalMt4l is a trend-following indicator that quickly responds to a trend change. The indicator forms the line so that it is always located above or below the chart depending on a trend. This allows using the indicator both for a trend analysis and setting stop loss and take profit. The indicator should be attached in the usual way. It works on any timeframe from M1 to MN and with any trading symbols. The indicator has no configurable inputs.
Recommendations on working with the indicator
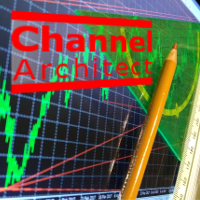
This indicator calculates and draws lines over the chart. There are two types of channels: Channel A: the mainline is drawn using local lows for uptrends and local highs for downtrends Channel B: the mainline is drawn using local highs for uptrends and local lows for downtrends The parallel lines of both types are built using the max. fractal between the base points of the mainline. There are a few conditions, which have to be fullfilled and can be changed by the parameters (see also picture 4):
The Expert Advisor is based on Williams` Percent Range. The EA trades both during low volatility and a trend if MACD is enabled. Two Williams` Percent Range indicators can be used to enter a trade with different parameters, while the third one can be configured to close a trade. Besides, the EA has the trailing stop and stop loss calculation functions depending on the currency pair movement strength.
Inputs Lots - lot size (if 0, the lot volume is calculated based on the % of account free margi
With this utility, switching the object visibility for individual objects has never been easier. This will help eliminate the clutter that plagues MetaTrader 4 traders when they create objects and then go to a higher timeframe and see that the objects interfere with the visibility of the chart. The demo version of Visibility Switch only works on the EURUSD currency pair. The full version of Visibility Switch can be found here. By default, every new object created has its visibility set to the cu
FREE

Colored trend indicator advanced is a trend indicator that is based on Fast Moving Average and Slow Moving Average and also uses RSI and Momentum to give a trend strength in percent. It is aimed to find more healthy trends with this indicator. This indicator can be used alone as a trend indicator.
Colors (Default) Green = Uptrend (Default) Red = Downtrend No color = No trend, no good trend
Indicator Parameters WarnPosTrendchange: Warns you when the trend may change. FullColor: See screenshot.

L'indicatore EZT Trend ti mostrerà la tendenza, il pullback e le opportunità di ingresso. Sono disponibili filtri opzionali e tutti i tipi di avvisi. Vengono aggiunti avvisi tramite posta elettronica e notifiche push. Stiamo anche sviluppando un EA basato su questo indicatore, che sarà presto disponibile.
È un indicatore multifunzionale composto da due istogrammi di colore e una linea. È una rappresentazione visiva della direzione e della forza di un trend, inoltre troverai divergenze molte vo

Candle Power Pro è un indicatore di analisi del volume progettato per analizzare il volume reale dei tick , la pressione rialzista/ribassista , gli squilibri tra acquirenti e venditori e le relazioni prezzo-volume direttamente dal grafico. L'indicatore trasforma l'attività del volume delle candele in un sistema di analisi di mercato visivo, mostrando le percentuali di volume rialzista e ribassista , la dominanza del volume, le condizioni di divergenza e i segnali di co

Better Scroll abilita e disabilita la funzione AutoScroll di MT4 durante lo scorrimento, rendendo la funzione più intuitiva e conveniente. Non dovrai più abilitare e disabilitare manualmente AutoScroll o farti portare alla fine del grafico perché ti sei dimenticato di disattivarlo durante il backtest o guardando i dati storici sui prezzi. Riepilogo
AutoScroll è DISATTIVATO quando:
Clic del mouse + Trascina a sinistra (oltre la candela attualmente aperta) Rotellina del mouse Scorri a sinistra (o

STO Currency Strength Meter uses Stochastic Oscillator to monitor how strong a currency is, or in other words, if it's being bought or sold by the majority compared to the other currencies. It displays the strength-lines of the currencies of the pair (base and counter currencies of the chart) with changeable solid lines. Also, you can add up to five additional currencies to the "comparison pool". If you want to look and compare, for example, EUR, USD and JPY, it will only look at the EURUSD, USD

Introducing Early Morning Scalper ATR: Precision Trading During Asian Forex Market A breakthrough in forex trading automation, the Early Morning Scalper ATR Expert Adviser offers a fully autonomous solution meticulously engineered for a specific window of opportunity—the early hours of the Asian Forex market. At its core, this innovative tool employs an advanced algorithm that orchestrates forex trading seamlessly. Augmenting its prowess are sophisticated internal indicators, which deftly ident

Grid Expert Advisor with floating step. The strategy of this EA is based on the main idea of trading - "Buy Low & Sell High". Pending orders "slip" behind the price in order to open a buy or sell order at an optimal price. The EA has several tactical techniques to reduce the loss.
Features Grid Expert Advisors have a serious drawback. It consists in the fact that there is a high risk of the deposit drawdown as a result of imbalance in a large number of BUY or SELL orders. This EA contains prote

Displays multiple indicators, across multiple timeframes and symbols to give a comprehensive overview of the market. Uniquely, the indicators are configurable and can include custom indicators, even those where you just have the ex4 file or those purchased from Market. Standard indicators can also be selected, the default being ADX, CCI, market price above/below Moving Average (MA), Moving Average Cross (MAX), MACD, Momentum (MOM), OsMA, RSI, Parabolic SAR, William's Percentage Range (WPR). Use

Quantina Multi Indicator Reader can analyse up to 12 most popular and commonly used together indicators in seconds on any timeframe, on any currency pair, stocks or indices. On the chart panel you can easily read each indicators default meanings and also there is an Indicators Summary on panel.
Features 1 file only: Quantina Multi Indicator Reader is 1 file only. No need to install other indicators to work. It is using the built-in indicators from MetaTrader 4 terminal. Detailed Alert Message:

It is a fully automated trading Expert Advisor, whose algorithm is based on trading using pending orders at the high and low of the daily working channel. StopLoss and TakeProfit are set manually by the trader, which provides ample opportunities for Expert Advisor optimization. When the UseTrall function is enabled, the EA only uses TakeProfit without setting a fixed StopLoss level. Upon reaching the specified profit target level, the EA sets StopLoss at the specified NoLossLevel distance from t
FREE

iSTOCH in iMA is an indicator which applies the stochastic changes to the iMA. Changes are reflected by altering the moving average colors. It is a useful tool to see easily the upsides or downsides of the stochastic.
You can to get source code from here .
Parameters MA_Periods - iMA period. MA_Method - iMA method. K_Period - K line period. D_Period - D line period. Slowind - slowing. STOCH_MA_METHOD - averaging method for MA. PriceField - price (Low/High or Close/Close). STOCH_LevelUp - uptre
FREE

Market Sponge EA is a fully automated Expert Advisor based on the RSI indicator and a custom home made algorithm who constantly analyzes the market to determine the best times to place orders that are confirmed by the RSI. This one is fully parametrable which gives you a great control over what the EA can do. Use this EA on EURCHF with the default settings if you want to use it on another Symbol you will need to optimize parameters. Basic settings are optimized and I will update them every 6 mon
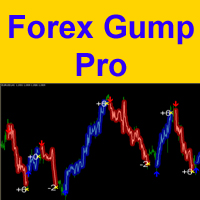
Attention! Friends, since there have been many scammers on the Internet recently selling indicators called ForexGump, we decided to warn you that only on our page is the LICENSE AUTHOR'S VERSION of the INDICATOR sold! We do not sell this indicator on other sites at a price lower than this! All indicators are sold cheaper - fakes! And even more often sold demo versions that stop working in a week! Therefore, in order not to risk your money, buy this indicator only on this site!
Forex Gump Pro is

The Elize Expert Advisor has been designed to work with the EURCHF currency pair. It considers the peculiarities of this trading instrument, its behavior and dependence on the behavior of other currencies. In particular, when the currencies of the European countries (EURUSD, GBPUSD, EURNOK, EURCHF) move in the same direction, the EA starts its operation and opens a deal in the trend direction of the European currencies. In the event of price rollbacks, the EA uses a unique method for making the
MetaTrader Market - i robot di trading e gli indicatori tecnici per trader sono disponibili nel tuo terminale di trading.
Il sistema di pagamento MQL5.community è disponibile per tutti gli utenti registrati sul sito MQL5.com che effettuano transazioni su MetaTrader Services. Puoi depositare e prelevare denaro usando WebMoney, PayPal o una carta di credito.

Ti stai perdendo delle opportunità di trading:
- App di trading gratuite
- Oltre 8.000 segnali per il copy trading
- Notizie economiche per esplorare i mercati finanziari
Registrazione
Accedi
Accetti la politica del sito e le condizioni d’uso
Se non hai un account, registrati