YouTubeにあるマーケットチュートリアルビデオをご覧ください
ロボットや指標を購入する
仮想ホスティングで
EAを実行
EAを実行
ロボットや指標を購入前にテストする
マーケットで収入を得る
販売のためにプロダクトをプレゼンテーションする方法
MetaTrader 4のための新しいエキスパートアドバイザーとインディケータ - 138

Buy a Coffee for Yuniesky Carralero Cuellar
This indicator draws the RED - GREEN and GREEN - RED candlestick pattern, the green candles that close above their previous red candle, and the red candles closing below your previous green candle. https://www.youtube.com/watch?v=UAW-fIyV-0U&t=1154s
Input Parameters 1. RED - GREEN: Draw the green candles that close above their previous red candle. 2. GREEN - RED: Draw the red candles that close below their previous green candle. 3. PREV CANDLE: D

Price Action Trading is an indicator built for the "Price Action" trading strategy. The indicator shows the points of the change in the direction of price movement, the direction of the trend, the dynamics of the trend, the distance traveled in points from the beginning of the change in the trend. This information is enough to trade and get good results in Forex. The Price Action Trading indicator has proven itself very well on GBPUSD, XAUUSD, EURUSD and other major currency pairs. You can inst
Buy a Coffee for Yuniesky Carralero Cuellar
This indicator draws:
TX - The max price since the last cross down, between M20 and M200, and the previous up cross
BX - The min price since the last up crossover, between M20 and M200, and the previous down crossover
You will need to use the A4_D template that shows
1. Simple Moving Average 20
2. Simple Moving Average 200
3. Period Separators
4. ASK line
Support
I will be happy to hear your recommendations to improve this product.

1. This EA yields an annualized return of 15% or about 50% . MT 4 Watch Watch Signal Search Saihuigongzuoshi Watch Watch Watch Watch Watch Watch watch the account number. 2. Retest 8 years of historical data, annualized return of about 30% , the net value of about 20% . 3. The EA would have to hang gold, U. S. crude oil, sterling against the yen to achieve this effect. Single Hand Count Setting: 0.01 hands for $500. PARAMETER ADJUSTMENT: XDSS adjustment hands, ZSDS stop adjustment, stop adjustme
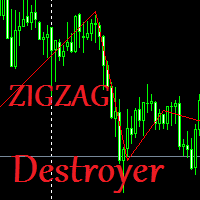
The indicator shows real waves based on alternating upper and lower extremes of the price chart, thus displaying the wave structure of the market. The algorithm of this indicator is absolutely new, everything that connects it is only its appearance, it is based on radically different algorithms and is able to calculate volumes in the market in real time. The wave detection algorithm has nothing to do with ZigZag. The indicator will be very useful for traders trading on the basis of wave analysis
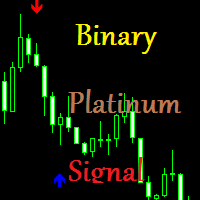
A good and reliable tool if you follow the rules of money management. does not redraw Developed according to its own strategy on a unique algorithm. The indicator is completely sharpened for binary options very easy to use Just add it to the chart and you can start trading Perfect for both beginners and experienced traders. The signals are simple and straightforward. Up arrow buy. Down arrow for sale. Recommended time of expiration is from 1-2 candles. For one transaction, no more than 3% of the
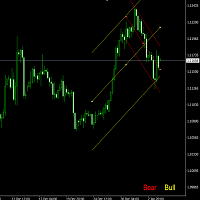
This indicator judges current trend, with Linear regression and the angle. Each parameters setting contents below. Period Period from current
Angle The angle of judging the trend
Width of Lines Width of Linear regression lines* Font size Font size of display text
Lines&Text colour Colour of display lines and test
* This parameter judges that if lines spreads too wide, there is no trend.
FREE

GruberEA Expert Advisor is based on the impulse movement of the forex market . This Expert Advisor was created for the GBP USD pair. The GruberEA Expert Advisor works with several orders . The Expert Advisor has a stop loss , trailing stop and take profit . The principle of the adviser's strategy: The first order opens according to the trend, closes according to the take profit or trailing stop. If a correction or reversal occurs, orders are opened in the same direction as the first order, then

ProExpert is based on a deep artificial neuron, it analyzes data from various trigger functions in the hidden layers that allow you to define the best entry point, even when the market is against it, which is very convenient in markets with high volatility and sudden price changes. The weight factor of each operation is based on the sum coefficient, this reduces the deposit load to a minimum and therefore allows the account to be kept alive until a change in trend.
Signal monitoring: https:
This Expert Advisor is based on Martingale strategy. Tested in EURUSD H4 using default settings. InpSellEnable - to enable opening of sell order InpBuyEnable - to enable opening of buy order InpLotExp - lots multiplier for averaging down an open orders InpLots - initial lots, this will be based on InpDollarPerLots InpMaxLots - if specified, it will limit the maximum lots under InpLotExp, which is also based on InpDollarPerLots InpTakeProfit - take profits in points InpPipStep - minimum distance

2 Copies left.. Royal Trend Indicator will close for public from 01 September 2022.
Royal Trend Indicator This is a Trend Indicator for MT4 Providing Signal To Enter The Position At The Best Time
It can be applied to any financial assets: F orex, Cryptocurrencies, Metals, Stocks, Indices . Benefits of the Royal Trend Indicator Entry Signals At The Best Possible Level The indicator algorithms allow you to find the ideal moments to enter a deal (buy or sell an asset), which increa
50 % OFF LIMITED TIME OFFER! (regular price $ 200 )
VR 4xEA is designed for traders looking for consistent Gains This is an autonomous trading software programme designed for the Foreign Exchange Market. This is a stable and safe investment tool designed to trade its way out of adverse trade situations that would challenge most manual traders. No Overoptimization and No false Claims. You can examine the EA working in strategy tester and can optimise it according to the way EA works VR

40 % OFF LIMITED TIME OFFER! (regular price $16 0 ) Sniper 4xRange is a fully automated Mt4 robot for forex trading with smart money management technique. Sniper 4xRange Expert Advisor won't make the mistakes you do, as it can trade without human emotions. No Overoptimization and No false Claims. You can examine the EA working in strategy tester and can optimise it according to the way EA works Sniper 4xRange Sniper 4xRange is designed to pick up the right moment for the initial market entr

This EA is a breakthrough EA. When the monitoring market changes rapidly, fluctuates rapidly in one direction, and exceeds the set threshold, the EA will quickly place an order and quickly adopt a mobile stop loss strategy to complete capital preservation and profitability. Advantages of this EA: 1. The transaction is very fast to the closing of the position, and it is never procrastinated. 2. After the transaction, the accuracy rate is very high. 3. Place an order with compound interest, and th
The product helps to find the highest peak and the lowest low. Help investors optimize profits. With a win rate of up to 80%. You do not need to adjust any parameters. We have optimized the best product. Your job just need to see and trade. Products with technological breakthroughs. Contact other products: https://www.mql5.com/en/users/hncnguyen/news.
FREE

Утилита TSim позволяет симулировать ручную торговлю в Тестере Стратегий MetaTrader 4. В панеле можно устанавливать размеры лота, тейпрофита и стоплосса. Панель имеет кнопки Sell и Buy для выставления рыночных ордеров, а также кнопки CloseSell, CloseBuy и CloseAll для быстрого закрытия ордеров. Под панелью отображается список открытых ордеров. Внимание. Панель работает только в Визуальном режиме Тестера Стратегий MetaTrader 4.
FREE
The Robot is based on 5 Standard Indicators.
Different settings possible Time Filter SL and TP Exit at opposite Signal Trailing Stop Martingale Increase Volume This Robot is Currency independent.
It works as well on cent accounts.
As there are many different Broker out there i recommend to run the optimization to get the best possible result from your Broker.
I wish everyone who purchases the EA maximum success and good trading results
Please trade carefully and responsibly.
Th

#property description "XAUUSD"
#property description " "
#property description "免责声明:"
#property description "投资有风险,入市需谨慎"
#property description "使用者风险自担,开发者无权承担"
#property description "点击确定,则视为同意上述声明!"
#property description " "
#property description "版权声明:"
#property description "所有版权属于 杨剑锋"
#property description "QQ群:676584332 QQ:7073679"
#property copyright "爱哈网络 日日制胜EA 突飞猛进 周期M15 本金1000以上"
#property link " https://bbs.2ha.cn "
窗口:M15 币对:XAUUSD (黄金美元) 最佳运行环境IC ECN 推荐平台:
Stochastic Trade X is an EA based on Stochastic Oscillator. Stochastic parameters such as %K period, %D period, Slowing, SellValue, BuyValue, and Shift can be adjusted. Stochastic Trade X applies BTN TECHNOLOGY's state-of-the-art intelligent technology to help you create optimal results for your trades. May your dreams come true through Stochastic Trade X. Good luck. === Inquiries === E-Mail:support@btntechfx.com
Moving Average Trade X is an EA based on Moving Average. Moving Average parameters such as BuyMovingAveragePeriod1, BuyMovingAverageMAShift1, BuyMovingAverageShift1, BuyCandlestickShift1, BuyMovingAveragePeriod2, BuyMovingAverageMAShift2, BuyMovingAverageShift2, BuyCandlestickShift2, BuyMovingAveragePeriod3, BuyMovingAverageMAShift3, BuyMovingAverageShift3, BuyCandlestickShift3, BuyMovingAveragePeriod4, BuyMovingAverageMAShift4, BuyMovingAverageShift4, BuyCandlestickShift4, SellMovingAveragePer
MACD Trade X is an EA based on MACD. MACD parameters such as Sell & Buy FastEMA, SlowEMA, MACDSMA and Shift can be adjusted. MACD Trade X applies BTN TECHNOLOGY's state-of-the-art intelligent technology to help you create optimal results for your trades. May your dreams come true through MACD Trade X. Good luck. === Inquiries === E-Mail:support@btntechfx.com
Bears Power Trade X is an EA based on Bears Power. Bears Power parameters such as BuyPeriod, BuyShift, BuyValue, SellPeriod, SellShift and SellValue can be adjusted. Bears Power Trade X applies BTN TECHNOLOGY's state-of-the-art intelligent technology to help you create optimal results for your trades. May your dreams come true through Bears Power Trade X. Good luck. === Inquiries === E-Mail:support@btntechfx.com
RSI Trade X is an EA based on Relative Strength Index. Relative Strength Index parameters such as BuyPeriod, BuyShift, BuyValue, SellPeriod, SellShift and SellValue can be adjusted. RSI Trade X applies BTN TECHNOLOGY's state-of-the-art intelligent technology to help you create optimal results for your trades. May your dreams come true through RSI Trade X. Good luck. === Inquiries === E-Mail:support@btntechfx.com
Force Trade X is an EA based on Force Index. Force Index parameters such as BuyPeriod, BuyShift, BuyValue, SellPeriod, SellShift, and SellValue can be adjusted. Force Trade X applies BTN TECHNOLOGY's state-of-the-art intelligent technology to help you create optimal results for your trades. May your dreams come true through Force Trade X. Good luck. === Inquiries === E-Mail:support@btntechfx.com
Fractals Trade X is an EA based on Fractals. Fractals parameters such as FractalsShift1, MovingAveragePeriod1, MovingAverageMAShift1, MovingAverageShift1, FractalsShift2, MovingAveragePeriod2, MovingAverageMAShift2, MovingAverageShift2, FractalsShift3, MovingAveragePeriod3, MovingAverageMAShift3, MovingAverageShift3, and RSIPeriod1, RSIShift1, RSIValue1 can be adjusted. Fractals Trade X applies BTN TECHNOLOGY's state-of-the-art intelligent technology to help you create optimal results for your t
MAO Trade X is an EA based on Moving Average Oscillator. Moving Average Oscillator parameters such as BuyFastEMA, BuySlowEMA, BuyMACDSMA, BuyShift, BuyValue, SellFastEMA, SellSlowEMA, SellMACDSMA, SellShift and SellValue can be adjusted. MAO Trade X applies BTN TECHNOLOGY's state-of-the-art intelligent technology to help you create optimal results for your trades. May your dreams come true through MAO Trade X. Good luck. === Inquiries === E-Mail:support@btntechfx.com
Bollinger Trade X is an EA based on Bollinger Bands.
Bollinger parameters such as Sell & Buy Period, Deviations, Bands Shift, Candlestick Index, and Shift can be adjusted.
Bollinger Trade X applies BTN TECHNOLOGY's state-of-the-art intelligent technology to help you create optimal results for your trades.
May your dreams come true through Bollinger Trade X.
Good luck.
=== Inquiries ===
E-Mail:support@btntechfx.com

Golden Cross Trade X is an EA based on Golden Cross. Golden Cross parameters such as BuyMovingAveragePeriod1, BuyMovingAverageMAShift1, BuyMovingAverageShift1, BuyMovingAveragePeriod2, BuyMovingAverageMAShift2, BuyMovingAverageShift2, SellMovingAveragePeriod1, SellMovingAverageMAShift1, SellMovingAverageShift1, SellMovingAveragePeriod2, SellMovingAverageMAShift2, and SellMovingAverageShift2 can be adjusted. Golden Cross Trade X applies BTN TECHNOLOGY's state-of-the-art intelligent technology
ADM Trade X is an EA based onAverage Directional Movement Index. Average Directional Movement Index parameters such as BuyPeriod1, BuyShift1, BuyPeriod2, BuyShift2, SellPeriod1, SellShift1, SellPeriod2 and SellShift2 can be adjusted. ADM Trade X applies BTN TECHNOLOGY's state-of-the-art intelligent technology to help you create optimal results for your trades. May your dreams come true through ADM Trade X. Good luck. === Inquiries === E-Mail:support@btntechfx.com

Parabolic SAR Trade X is an EA based on Parabolic SAR. Parabolic SAR parameters such as Step1, Maximum1, Shift1, CandlestickShift1, Step2, Maximum2, Shift2, and CandlestickShift2 can be adjusted. Parabolic SAR Trade X applies BTN TECHNOLOGY's state-of-the-art intelligent technology to help you create optimal results for your trades. May your dreams come true through Parabolic SAR Trade X. Good luck. === Inquiries === E-Mail:support@btntechfx.com

GMMA Trade X is an EA based on GMMA. GMMA parameters such as MovingAveragePeriod1-24, MovingAverageMAShift1-24, MovingAverageShift1-24 and CandlestickShift1-24 can be adjusted. GMMA Trade X applies BTN TECHNOLOGY's state-of-the-art intelligent technology to help you create optimal results for your trades. May your dreams come true through GMMA Trade X. Good luck. = == == Inquiries = == == E-Mail:support@btntechfx.com
CCI Trade X is an EA based on Commodity Channel Index. Commodity Channel Index parameters such as BuyShift, SlowEMA, BuyPeriod, BuyValue, SellShift, SellPeriod and SellValue can be adjusted. CCI Trade X applies BTN TECHNOLOGY's state-of-the-art intelligent technology to help you create optimal results for your trades. May your dreams come true through CCI Trade X. Good luck. === Inquiries === E-Mail:support@btntechfx.com

Ichimoku Trade X is an EA based on Ichimoku Kinko Hyo. Ichimoku Kinko Hyo parameters such as Tenkansen1, Kijunsen1, SenkouSpanB1, BuyShift1, Tenkansen2, Kijunsen2, SenkouSpanB2, BuyShift2, Tenkansen3, Kijunsen3, SenkouSpanB3, SellShift1, Tenkansen4, Kijunsen4, SenkouSpanB4 and SellShift2 can be adjusted. Ichimoku Trade X applies BTN TECHNOLOGY's state-of-the-art intelligent technology to help you create optimal results for your trades. May your dreams come true through Ichimoku Trade X. Good lu

Awesome Trade X is an EA based on Awesome Oscillator.
Awesome Oscillator parameters such as BuyShift, BuyValue, SellShift, and SellValue can be adjusted. Awesome Trade X applies BTN TECHNOLOGY's state-of-the-art intelligent technology to help you create optimal results for your trades.
May your dreams come true through Awesome Trade X.
Good luck.
=== Inquiries ===
E-Mail:support@btntechfx.com

Трендовый советник работает на валютной паре EURUSD, на графике H1 на основе набора стандартных индикаторов, показывает стабильный результат, однако совершает не так много сделок, так как работает по тренду, одновременно открывается только 1 сделка. Протестирован с 01.01.2000 года по 01.05.2021 года и с 01.2020 по 01.05.2021 на счетах брокеров Alpari и RoboForex, желательно использовать на счетах с небольшим спредом, работает на реальном счете, одновременно открывается не более 1 позиции. Работ

CyberBoom is a fully automatic expert built for the XAUUSD currency pair. CyberBoom does not use Martingale and Grid, All Trades are covered by StopLoss and TakeProfit. CyberBoom only works in XAUUSD currency pairs. CyberBoom has been tested for more than 2 years in Strategy Tester . CyberBoom trades in H1 time frame.
Symbol
XAUUSD
Timeframes
H1
Minimum Deposit
200 USD
Brokers
Any broker
How to work
Combines hundreds of different strategies to predict the USDJPYcurrenc
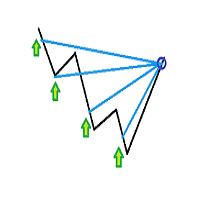
Simple Martingale system EA, You will choose the type of starting order according to the market situation. You will specify the grid range and the take profit value. The Take profit value will be automatically modified according to the number of orders opened and the average opening price. Remember that Martingale systems are always at risk and should be kept under control. Or you must have a large deposit.

5 in 1 GOLD H1 SUBPORTFOLIO
Gold Subportfolio is is a longterm oriented EA that combines not one, but five different EAs. The EA was developed through countless days to deliver the best product to you. Combining five EAs into one ensures that that the drawdown is minimal at every point in time as the strategies included are completely uncorrelated. That means, that you will actually get five EAs for a smaller price that most other EAs. It is a set and forget EA that will serve you for years

The Vigorous EA is one of our best EA’s! It has been successfully backtested +21 years. It scalps the EURUSD pair up to 100 times a week and makes a profit EVERY day! If you’re looking for an EA that makes a consistent profit every day, this is it!
Trades the EURUSD every day Profitable backtests for the past 21 years Projected monthly profit of 1-3% a month (default settings) Recommended starting account size is $5k Recommended leverage is 250:1 50-100 scalp trades a week
How does V

MT4 EA - FX Turbo Specially designed for EURUSD, any time frame can be used as the required time frame is already built into the program.
This unique 12 Level Entry Trading System was developed and modified based on Martingale Concept but with more safety elements built into it to cater for volatile range.
The SLTP specially designed by using equity (not in pips), therefore account that running this EA shall not add on any other open trades.
Past 24 month (May 2019-Apr 2021) Back Te

MT4 EA - X-Gold Specially designed for XAUUSD, any time frame can be used as the required time frame is already built into the program.
This unique 2 Level Entry Trading System was developed and modified based on Martingale Concept but with more safety elements built into it to cater for volatile range.
The SLTP specially designed by using equity (not in pips), therefore account that running this EA shall not add on any other open trades.
Past 24 month (May 2019-Apr 2021) Back Test Res

MT4 EA - MLT Specially designed for GBPUSD, any time frame can be used as the required time frame is already built into the program.
This unique 12 Level Entry Trading System was developed and modified based on Martingale Concept but with more safety elements built into it to cater for volatile range.
The SLTP specially designed by using equity (not in pips), therefore account that running this EA shall not add on any other open trades.
Past 24 month (May 2019-Apr 2021) Back Test R

CMA dashboard is designed to help traders in identifying trend on multiple timeframes and symbols. It displays a clear state of the overall trend at one place without the need to navigate between different charts and timeframes. This saves time and makes decision making process fast so that potential opportunities are not missed. It is based on Corrected moving averages available here Features
Parameters for signal optimization Inputs for multiple timeframes and symbols Usage Higher timeframe
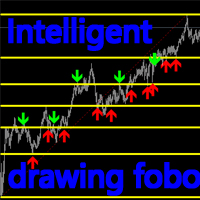
Introduction:
This product is an indicator type tool. This indicator will automatically identify and find a suitable location. FOBO is established, and all the positions of support and suppression are marked in detail. Support and suppression are shown with red and blue arrows. Switch and delete:
TAB : After pressing the TAB button on the keyboard, the indicator will identify and find the next qualified position, and redraw the support and suppression. “ ` ” : The “ ` ” key on the keyboard d

EURUSD H1 SUBPORTFOLIO
EURUSD Subportfolio is is a longterm oriented EA that combines not one, but five different EAs. The EA was developed through countless days to deliver the best product to you. Combining five EAs into one ensures that that the drawdown is minimal at every point in time as the strategies included are completely uncorrelated. That means, that you will actually get five EAs for a smaller price that most other EAs. It is a set and forget EA that will serve you for years to co

5 in 1 GBPJPY H1 SUBPORTFOLIO
GBPJPY H1 Subportfolio is is a longterm oriented EA that combines not one, but five different EAs. The EA was developed through countless days to deliver the best product to you. Combining five EAs into one ensures that that the drawdown is minimal at every point in time as the strategies included are completely uncorrelated. That means, that you will actually get five EAs for a smaller price that most other EAs. It is a set and forget EA that will serve you for y

It is calculated based on the candle and it gives amazing results. ROI is minimum 80% and risk is 20% it gives minimum 100% returns for the minimum investment. It is starts with $100 and it gives amazing results on Forex. This EA can build based on the most powerful technology and the calculations it is giving massive profits to our customers. Please check some attached screenshot for your reference. It'll work on all timeframe like 1M, 5M,15M etc.
For the settings for giving such a great prof
GridScalper London
The EA also has a long backtest history of 10+ years using 99.00% modeling quality! It's a grid system, but over the past 10 years, it has steadily increased profits by money management. You can also set a stop loss for each trade.
RECOMMENDATIONS
・1000$ BALANCE or MORE. ・GBPUSD,GBPCAD ・5M ・Leverage 500:1 or 400:1
INPUTS: PlusProfit: When holding multiple positions, close when the total profit exceeds this parameter value (point) . TakeProfit: Profit margin of one

Easy Growth is a fully automatic ЕА for MT4 with fast algorithm, designed for intraday trading, FIFO compliant. Market orders are opened according to the daily trend, filtering signals with advanced filters, to achieve high percentage of profit trades. All orders are placed with SL and TP. It is possible to open additional positions (optional), only when the conditions are met. Тhe number of additional positions and their lot size is user defined. The user may also allow hedging (optional for N
RSI tells you oversold and overbought levels, but how can you handle with trending markets with RSI? Solution is CFX Adaptive RSI that recalculate oversold and overbought levels according to a moving average.
Indicator parameters: - RSIPeriod: Period of RSI. - Sensibility: high value means that indicator will be more sensible to trending market. Low value means that indicator will be less sensible to trending market. - MAPeriod: Period of the moving average - TotalHistory: number of candles in
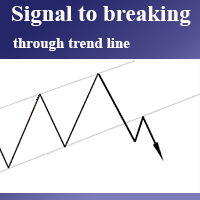
Простой помощник в торговле, информирующий о пробитии трендовой линии. Сигнал о пробитии уровня приходит на терминал и дублируется push сообщением на телефон. Удобная прога, т.к. не нужно сидеть у монитора пол дня в ожидании пробоя трендовой линии, важного уровня и т.п. Как пользоваться: 1) Строим две трендовые/горизонтальные линии. 2) Присваиваем верхней линии имя: "top", а нижней "bottom" (без кавычек). 3) У трендовых линий лучше зайти в свойства=>параметры и поставить галочку "луч" 4) Перет

Monitor floating profit of trades and close half of the lot size when profit reach target. Can monitor either all trades in whole account or by specified magic number. Can set amount of slippage and spread tolerance. Can set retry times and sleep seconds if split order was rejected Can set max split order times. Able to close trades after split when floating profit goes down and near 0, to prevent lose.
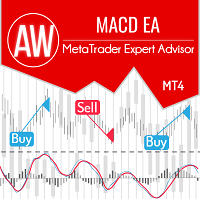
完全に自動化された取引システム。古典的なインジケーターがシグナルとして使用されます MACD 。トレンドインジケーターとオシレーターを組み合わせてエントリーポイントを検出します。平均化、最初と最後のバスケット注文を閉じる機能、および自動ロット計算の機能を使用します。高度なダッシュボードと3種類の通知があります。 Problem solving -> HERE / MT5 version -> HERE / Instruction -> HERE 利点:
完全に自動化された取引システム 簡単なセットアップと直感的なパネルインターフェース キャンドルごとに1つの注文のみを開く機能 内蔵の自動ロット計算 最初と最後のバスケット注文を閉じるための組み込みシステム 通知の3つのタイプ:プッシュ、電子メール、アラート ストラテジー: EAは、インジケーターからシグナルを受信するとポジションを開きます。 -ゼロレベル:「0」マークの速いラインが下から上に交差するとき-買いシグナル、買い注文を開きます。上から下に「0」マークを横切るとき-売りの合図、SELL

キャンドルタイマーカウントダウンは、現在のバーが閉じて新しいバーが形成されるまでの残り時間を表示します。 時間管理に使用できます。
MT5バージョンはこちら !
機能のハイライト 現地時間ではなくサーバー時間を追跡します 構成可能なテキストの色とフォントサイズ シンボルの日次変動のオプションの視覚化 CPU使用率を削減するために最適化
入力パラメータ
毎日の変化を表示:true / false テキストフォントサイズ テキストの色
それでも質問がある場合は、直接メッセージで私に連絡してください。 https://www.mql5.com/ja/users/robsjunqueira/
これが私たちが継続的に進化することができる唯一の方法であるため、改善のための提案に気軽に連絡してください。
FREE

Dark Mimas is a fully automatic Expert Advisor for Scalping Trading. This Expert Advisor needs attention, in fact presents highly customizable. Dark Mimas is based on Dark Oscillator indicator, these Trades can be manage with some strategies. The expert advisor is able to get a very high-rate of winning trades. Optimization experience is required to Download the robot. My tests are indicative, for best results it is necessary to study the user manual and create your settings. All the se
FREE

この指標は、以下に基づいて各ろうそくの上または下にラベルを描画します。 ロブ・スミス ストラト それらがチャート上で時間の経過とともに発展するにつれて。
価格が変化するにつれて、ろうそくは 3 つの状態を切り替えることができます。ローソク足が最初に開いたとき、それが前のローソク足の高値と安値の中に完全に収まっている場合、タイプ 1 として開始されます。タイプ 2 であり、値動きが不安定で方向性がない場合、前のローソク足の反対側を壊してタイプ 3 になる可能性があります。
キャンドル
各キャンドルは、前のキャンドルとの関係によって定義されます。
タイプ 1 - ろうそくの内側 - ろうそくは完全に前のろうそくの高値と安値の範囲内にあります。ろうそくの内側は、市場が優柔不断であることを示しています。
タイプ 2 - トレンド ローソク足 - ローソク足は、前のローソク足の高値または安値のいずれかの上または下に伸びますが、両方ではありません。
タイプ 3 - ろうそくの外側 - ろうそくは前のろうそくの高値と安値の両方を破っています。外側のローソク

Rob Smith の TheStrat について学んでいるときにこの単純なインジケーターを作成しましたが、とても役立つと思いました。共有したいと思います。役に立つと思われる場合は、私が MQL5 で公開した他の指標を見てください。 このインジケーターは、より高い時間枠から選択した価格レベルを示す単一の線をチャートに描画するだけです。 設定を使用すると、表示される時間枠を完全に制御できますが、デフォルトでは 、スケールを 1 ステップ上げるだけで、より高い時間枠自体が計算されます。たとえば、H1 チャートを開くと、H4 チャートのデータが表示されます。
設定
トラックタイムフレーム 価格レベルが引き出される時間枠を選択します。現在のデフォルト設定のままにしておくと、適切な時間枠が選択されます。線は常に上向きに調整されるため、チャートを確認して時間枠を変更する場合、これは非常に役立ちます。 トラックバリュー 下記の標準価格からお選びいただけます。デフォルトは始値です。 PRICE_CLOSE 終値 PRICE_OPEN 始値 PRICE_HIGH 期間中の最高価格 PRICE_LO
FREE

私がこれまでに作成した最高の外国為替スキャナー。
ワンクリックで28の通貨交換すべてを管理できます。
このインジケーターを使用すると、外国為替取引を完全に制御できます。
28の両替所すべてで同時に何が起こるかを見ることができます。
RSI
ATR
移動平均
確率論的
MACD
このスキャナーは、選択した指標に基づいて、市場が強気か弱気かを示します。
各指標の値を自分で選択できるようになります。
シグナルを特定したら、外貨両替の名前をクリックするだけで、対応するチャートがすぐに開きます。
このスキャナーを使用すると、28の外国為替取引所すべてを監視でき、ワンクリックで必要なチャートを開くことができます。
このインジケーターは、他のストラテジーと一緒に、または単独で使用できます。
FREE

FTFC は、Rob Smith の The Strat で定義されている Full Timeframe Continuity を指します。 このインジケーターはチャートに 2 本の線を引きます。四半期、月次、週次、日次、または時間次の開始レベルの最高値の 1 つと、これらの値の最低値の 2 つ目です。これにより、取引が一方向に非常に強くなる可能性が高いチャネルより上または下のチャネルが得られます。ライン間では、価格アクションが途切れ途切れになり、より広いストップを使用する必要がある場合があります. 高値と安値の中間点を示すために、3 番目の破線も描画されます。これは、市場が価格を特定の方向に押し上げようとするため、サポートまたはレジスタンスを見つけるのに適した場所です。色を NONE に設定して選択すると、この行をオフにすることができます。
設定 四半期ごとのレベルを含める 一部の人々はそれを無視することを好むため、四半期の始値を計算に含めることを選択できます。 IncludeCurrentTimeframeOpen true の場合、現在表示されている時間枠が H1、D1、W1
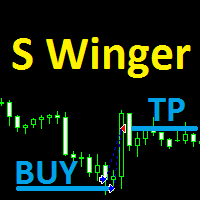
S Wingerは、取引を行うためにMACDインジケーターと組み合わせて以前の高値と安値を使用するエキスパートアドバイザーです。エキスパートは特定の取引レベルに違反するまで待機し、次に開始される取引の確認にMACDインジケーターが使用されます。デフォルトセットはアカウント通貨を使用します(米ドル用ですが、利益がある場合は他のアカウント通貨でも機能する可能性があります)および最大損失パラメータが調整されます)。最初の取引から利益が達成されない場合、専門家は利益が達成されるまで、最も可能性の高い価格逆転レベルでより多くの取引を開始します。
推奨ペア:EUR / USD;
時間枠:H1;
ロットサイズは手動または自動にすることができます。自動ロットサイズが選択されている場合、注文と潜在的利益の比率を維持するために、「KeepHigherLot」パラメータが「true」に設定されている場合、ロットサイズは下げられません。自動ロット計算をリセットするには、エキスパートを再起動する必要があります。自動ロットモードでは、通貨の利益と最大損失が利益係数と最大損失係数になり、ロットサイズと

Lord Info は、META TRADER 4 プラットフォーム上の金融市場の指標です。
Lord Info は、プラットフォーム上の任意の株式/通貨ペアに配置できます。
Lord Info は、過去 (10) 日間または設定可能な ATR レポートを表示して、ペアの基本ボラティリティとその結果を確認できます。
アベレージ トゥルー レンジ (ATR) は、テクニカル分析で使用される市場のボラティリティの指標です。 これは通常、一連のリアルレンジ指標からの 14 日間の単純移動平均から導出されます。 ATR はもともと商品市場で使用するために開発されましたが、その後あらゆる種類の証券に適用されています。
Lord Info は、Hi-Low (高値/安値)、日次、ローソク足の電流、および最後のローソク足を表示します。
操作の長短の切り替え。
分析パフォーマンスを得るために、ストップレベルを簡素化およびカスタマイズしました。
Lord Oscilator、自動タイムフレーム識別: M1、M5、M15、M30、H1、H4、D1、パーソナライズされたインジケ
FREE
シグナルコンプレックスAtlonは、矢印の形でシグナルを電子メールに送信し、通知を携帯電話にプッシュする既製の取引システムです。 Atlonは、既製のTPレベルも赤い四角で表示します。
システムは任意のチャート(通貨ペア、株式、暗号通貨、金属、石油)で動作します。
時間枠H1。
システムは再描画されず、矢印はどこにも消えません。
セットには、チャートにインストールする前にロードする必要がある既製の設定が含まれています。
設定をダウンロードする
システムパラメータ:
バー単位のスペクトルサイズ-バー単位のスペクトルサイズ。
ポイント単位のスペクトルサイズ-ポイント単位のスペクトルサイズ。
ノイズ-ノイズ
最大バー-バーの最大数
TPを表示-TPを表示するかどうか。
フィルタTF-選択した時間枠を分析に使用します。
ディスプレイでのアラート-チャートにシグナルを表示します
モバイルMT4にプッシュ-電話に信号を送信する
メールを送信-電子メールに信号を送信します
Please read before you purchase : - We don't have buyer's detail when purchase was made. In order to get the bonuses, you need to contact me via product comment ( not product review). That way I will contact you back via mql message asking for email. - Please make sure you enable receiving message from non-friend list, otherwise I cannot message you for email. This indicator is not just about Smart Money Concept, with lots of features which I believe could help you understand the concept. Not on
This is a combine that combines the ATR, Candle Timer, Watermark indicators and a tool for working with graphical objects, which allows you to reduce the time for marking charts. Functionality: Levels and proteins with price tags; drawing strictly horizontal levels; continuous zigzag manually; expansion / truncation of lines, wrinkles; quick change of colors and fonts and shapes; Filling/removing the filling of vessels, triangles, ellipses; dragging by 1 (first) point and auto alignment of the h
FREE

Super Trend Pro Its simple. as you see in product picture you can find out how it work. We Use Several MA and use Statistics and Probability inside the code to draw nice, great and pure Trend Detection. Do you like it? Yes me too Here, Super trend pro with 100% non-repainting indicator
Input Parameter is clear and simple.
Inputs Period 1 --------------------------->>>> Use for mathematical calculating
Period 2 --------------------------->>>> MA Period
Indicator Type ------------------->>>>
FREE
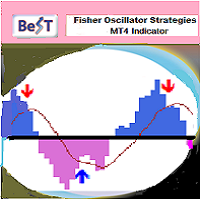
BeST_Fisher Oscillator Strategies is an MT4 Indicator that is based on the popular Fisher Indicator and it is mainly used to identify trend reversals with a high accuracy . It is a great forex trading indicator for scalping , day trading and swing trading purposes. The indicator comes with 2 corresponding Strategies of Reversed Entries each one of which can be used either as a standalone Trading System or as an add-on to any Trading System for finding or confirming the most appropriate Entry o

SIRR Advanced Trend Scalper EA PRO is a robot that has the Stochastic indicator working in combination with RSI and MACD filters built in. It is a dynamic EA that is very active with trades and capital management. Our product is also fully compatible with PipFinite Trend Indicator PRO. The EA has been designed for trading with the popular symbols EURUSD, GBPUSD, USDCHF, USDJPY, USDCAD, AUDUSD, EURGBP, EURCHF, EURJPY, AUDNZD, AUDCAD, EURNZD. This EA operates in various and different types of trad
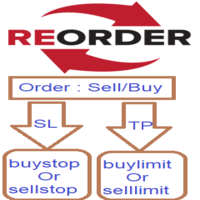
Reorder it is simple expert will help you when your order closed by TakeProfit to excute limit pending order in the same order price and same stop loss and take profit, and if your order is closed by StopLoss execute the stop pending order in the same order price and same stop loss and take profit.
- Open Limit order if the order closed by Takeprofit : true/false. - Open Stop order if the order closed by stoploss : true/false. - Alert : true/false. - Support_Conatct :https://t.me/IsmailMe

This BetMarsEA2 can trade BTCUSD and XAUUSD. It can trade one of them individually or both at the same time.
When two currency pairs trade, a hedging strategy is used. Use trend strategy when trading separately. The parameters are as follows:(these parameters are reserved. Please do not modify them. What can be changed is CurrentSymbolFlag. MaximumRisk =0.02; DecreaseFactor=3; MovingPeriod =12; MovingShift =6; CurrentSymbolFlag=true When the parameter CurrentSymbolfFlag = true, only the

Friends, at first you may think that this tool is difficult to use, but by reading its guide, you can easily use it. Once you learn, you can test thousands of strategies in it. Dear friends, this tool can not be tested in backtest. Using this tool, you can test your strategies live.
Create strategies that are in your mind. With this tool, you can make the strategies you have in mind a reality. Create and use experts using popular indicators such as RSI, MACD, Moving Average, Bollinger Band, et
MetaTraderマーケットは、履歴データを使ったテストと最適化のための無料のデモ自動売買ロボットをダウンロードできる唯一のストアです。
アプリ概要と他のカスタマーからのレビューをご覧になり、ターミナルにダウンロードし、購入する前に自動売買ロボットをテストしてください。完全に無料でアプリをテストできるのはMetaTraderマーケットだけです。
取引の機会を逃しています。
- 無料取引アプリ
- 8千を超えるシグナルをコピー
- 金融ニュースで金融マーケットを探索
新規登録
ログイン