YouTubeにあるマーケットチュートリアルビデオをご覧ください
ロボットや指標を購入する
仮想ホスティングで
EAを実行
EAを実行
ロボットや指標を購入前にテストする
マーケットで収入を得る
販売のためにプロダクトをプレゼンテーションする方法
MetaTrader 4のための新しいエキスパートアドバイザーとインディケータ - 132

The indicator determines the trend and draws arrows in the direction of the transaction.
Non-repaint!
By default, the recommended parameters are set, provided that the H1 timeframe is used.
Period parameter is the main parameter that calculates the arrows.
Frequency parameter is responsible for the frequency of signals.
Bars of calculating parameter is responsible for the number of bars on which the arrows are displayed.
It is recommended to adjust the indicator for each pair an

The QRSI indicator is one of the most important and well-known indicators used by traders around the world. By its nature, the QRSI indicator is an oscillator, that is, it fluctuates in a certain zone, limited by the maximum (100) and minimum (0) values. Specifically, this indicator works according to an accelerated algorithm, but this is not its only difference. This indicator implements a more advanced calculation based on the Relative Strength Index algorithm. The peculiarity of the implemen

The indicator checks the trend and draws arrows in the direction of the transaction.
Recommended parameters are set by default.
The Signal mode parameter is responsible for confirming the signal. Live - signal without confirmation On bar close - confirmation signal after closing the current candle (non-repainting)
The indicator is designed for any pairs. Recommended pairs:
EURUSD, AUDUSD, USDCAD, USDCHF, USDJPY, NZDUSD, GBPUSD
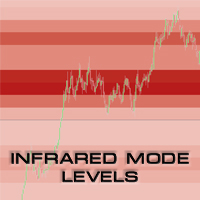
UPDATE 3 - Scan what you see - the indicator will scan and draw levels for all VISIBLE bars on the chart, rather than Current Bar - till first visible bar on the chart (historical bar on the left side). Assumption is, if you are going back in history and you want to check levels, you care about that specific moment in time and what the levels were during that moment (excluding data of the future which is not visible). UPDATE 2 - version 2.1 introduces the "Always ON" feature. If enabled, you ca

Hello all investors. Most of you do not know how to trade in this financial market. As far as I know 95% of market participants will lose. Today I want to introduce to you an EA, it operates on the principles of capital management and price balancing. EA trades multiple currency pairs at the same time to increase profits while reducing account risk. The EA works and gives orders 24/5 so you don't miss the opportunity. If possible, use it for a better experience. See my expert account at the

RSI Scanner, Multiple Symbols and Timeframes, Graphical User Interface An indicator that scans multiple symbols added from the market watch and timeframes and displays result in a graphical panel. Features: Multi symbol Multi timeframe Alerts and Notifications Live Monitoring Sorting modes One click to change symbol and timeframe Inputs for RSI and scanner settings
FREE

MTF Trader EA uses several Bollinger Bands indicators for filtering and MAs for trigger. Symbol: GBPCAD. Timeframe: 1H. Deposit: 300 and higher. All trades covered by fixed Stop Loss and Take Profit . No Grid. No Martingale. Works with high spread This EA operates only once per bar opening. Fast methods of strategy testing and optimization are valid. User can test / optimize by model: (control point) / (open prices only) developed, tested and optimized from 2010 to release d
FREE

Killer Market MT4 is an advisor with a system for "Resolving" a basket of unprofitable orders, a news filter, a filter for open positions on other trading instruments and the function of sending trading signals to your Telegram channel.
The Expert Advisor can be used to restore unprofitable positions on the account as a utility to bring trades to breakeven that you opened with your hands or other Expert Advisors.
Works inside a linear regression channel, input on several conditions. The sig

Big Player EA USDJPY is an EA that generates trading signals with custom strategies. The EA scans 5 months of history and generates signals and buys or sells on these signals. At least 5 months of data should be behind when testing the EA. Also, cross Takeprofit strategies are implemented in the EA. Single, double, triple and quad TP strategies are applied. Thanks to the cross Takeprofit strategies, the EA works easily even during high activity times.
Big Player EA Family Single Symbols: E

Big Player EA EURUSD is an EA that generates trading signals with custom strategies. The EA scans 5 months of history and generates signals and buys or sells on these signals. At least 5 months of data should be behind when testing the EA. Also, cross Takeprofit strategies are implemented in the EA. Single, double, triple and quad TP strategies are applied. Thanks to the cross Takeprofit strategies, the EA works easily even during high activity times.
Big Player EA Family Single Symbols: EU

Big Player EA AUDUSD is an EA that generates trading signals with custom strategies. The EA scans 5 months of history and generates signals and buys or sells on these signals. At least 5 months of data should be behind when testing the EA. Also, cross Takeprofit strategies are implemented in the EA. Single, double, triple and quad TP strategies are applied. Thanks to the cross Takeprofit strategies, the EA works easily even during high activity times.
Big Player EA Family Single Symbols: EU

Active investments Most investment funds and banks are engaged in passive investments - they buy assets and wait for them to rise in price. While Expert Advisor Candle Banker EA performs trading. This significantly increases a user's profit.
Earns even during the crisis! For the adviser Candle Banker EA it does not matter what state the world economy is in. Our investment robot makes a profit at any time!! This way, you will increase your capital during any crisis!
Your money will stay with

Binary Options Assistant (BOA) Multi Currency Dashboard for Binary Options (MT4) .
You can use any of the BOA Signals Indicators with the dashboard. Just change the BOA Signals Indicator Name in the dashboard settings to the indicator you want to get signals from. For example: CHILL.
BOA_BURN_Indicator_v1 Strategy : Ana Trader Binary Options Strategy (MACD & Stochastic)
BOA_COLD_Indicator_v1 Strategy : Amalia Trader Binary Options Strategy (Keltner & Stochastic)
BOA_CHILL_Indicator_
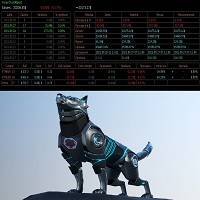
Советник основан на максимально быстром закрытие сделок от заданных параметров.Это можно так сказать разрульватель просадок.. У него встроено 3 окошка на панели.с полным мониторингом вашего терминала по всем парам. вы можите оценивать свои ситуации по разным парам. всегда можите любую ситуацию закрыть в ручную простым нажатием на экране по кнопке..
При наведении курсора мыши на ниже перечисленные столбцы, осуществляется подсветка поля: Бай профит Селл профит Прибыль Закрыть только "+" Закрыт
My Expert Advisor trade EURUSD on M15 time frame, Base on ADX indicator, and follow the trend. stop loss 20 usd/0.01 lot take profit 13 usd/0.01 lot Min deposit: from 300 usd Profit: 600%/1 years (High risk). Draw Down: < 35% Min deposit: 150 usd Recommended deposit: 300 usd Input Setting to test my EA: - Lots: 0.01 - Stoploss: 20 usd/0.01 lot depend on your broker and your account ( adjust to the correct ratio and do not change) - Takeprofit: 13 usd/0.01 lot depend on your broker an

Auto SL and TP is a simple program that add StopLoss and TakeProfit automatically, so you don't need to worry about it anymore. Trailing Stops also included. The program checks at any time if StopLoss and TakeProfit are set correctly!!! You can enter your values via the input parameter. This is for those who trades based on fundamentals specially like expecting big moves on the market and doing manual trading, this is for you.
Input-Settings Auto SL = (x)pips Auto TP = (x)pips Use Trailing

Индикатор содержит 3 RSI с возможностью выбора рабочего таймфрейма, периода и параметра сглаживания каждого. Не перерисовывает начиная с 1 бара. При задании параметра сглаживания большего 1 показания будут обработаны специальным образом, для исключения мелких колебаний. Возможно использовать в качестве готовой торговой системы, где показания старших ТФ определяют тренд, а младший используется для поиска точек входа, в качестве примера может служить система Дмитрия Брылякова https://www.infoclub
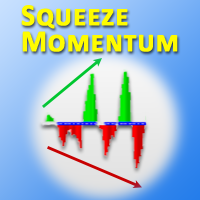
This is the MetaTrader version of the very popular Squeeze Momentum indicator. It is based of of John Carter's TTM Squeeze volatility indicator, as discussed in his book Mastering the Trade. With this version you can enable notifications when a squeeze is released (push notification, email, or pop-up message). Strategie
Grey dots indicates a squeeze in the current timeframe. Blue dots indicates that the squeeze is released. Mr. Carter suggests waiting till the first blue dot after
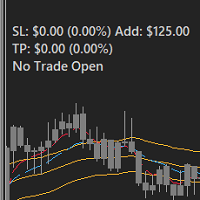
FEATURES: -Current total SL & TP -Allowed Risk per Trade -Maximum Daily Loss Alert -SL level to matc Risk per Trade
Input: MoneyOrPercent >> True=MoneyRisk, False=PercentRisk Money Risk per trade >> Fixed $$ per trade Percent of Account Balance per trade >> Fixed % of Account Balance per trade Max losing trades per day >> Max daily loss limit Font Type SL TP Label Positions SL TP Font Type and Size

The Pivot Dashboard is a multicurrency Dashboard that indentifies the Pivot prices and tells the user if they were tested or not. With this Dashboard you will be able to change (Symbol/Timeframe (M15,H1,H4)) immediately with just one click. It is also possible to visualize the Pivot Price clicking on the Pivot Button. The Dashboard can also be Minimized and Closed.
IMPORTANT ALL SYMBOLS THAT THE USER PUTS ON THE DASHBOARD MUST ALSO BE IN THE MARKETWATCH:
With the new Feature,that were a
The avatar indicator is one of the most powerful current indicators in the forex and binary options market. The indicator works on all pairs and all time frames, and the indicator has certain conditions in order to avoid loss and achieve 95% profits from it. The conditions are: Avoid volatility markets Avoid flat and casual markets I work in the trend markets, the market is moving in a trend, and you are able to determine the direction of the trend, where is it Make time for yourself to work in,

MT4のエキスパートアドバイザーリスクマネージャーは非常に重要であり、私の意見ではすべてのトレーダーにとって必要なプログラムです。
このエキスパートアドバイザーを使用すると、取引口座のリスクを管理することができます。リスクと利益の管理は、金銭的およびパーセンテージの両方で実行できます。
エキスパートアドバイザーが機能するには、それを通貨ペアチャートに添付し、許容可能なリスク値を預金通貨または現在の残高の%で設定するだけです。 PROMO BUY 1 GET 2 FREE - https://www.mql5.com/en/blogs/post/754725
アドバイザ機能
このリスクマネージャーは、リスクの管理を支援します。
-取引のために -1日あたり - 1週間 - ひと月ほど
制御することもできます
1)取引時の最大許容ロット 2)1日あたりの最大注文数 3)1日あたりの最大利益 4)エクイティを引き受ける利益を設定する
それだけではありません。設定で自動設定を指定した場合、アドバイザーはデフォルトのSLとTPを設定することもできます。

簡単な説明、ゴールド/ XAUUSD 金は何千年もの間貴重な商品と見なされており、金の価格は世界中の金融市場で広く支持されています。
外国為替では常に、ヘッジ資金提供者と大きな子供たちは、市場リスクからバスケットをヘッジするために金を使用しています。そして彼らはこの金をヘッジとして使用します。このため、金は価値を十分に保持し、リスクオンおよびリスクオフの感情のような信頼できる安全な避難所になります。 米ドルがいくらかの力を得るとき、大きな子供たちは米ドルを買うために金を売ります、そして、米国が下がるならば、彼らは彼らの資産を保護するために金を買います。一般的に、金の価格は株式や債券が下落するにつれて上昇する傾向があります。
私たちはFX市場での安全な避難所のペアについて話している。金は生きているキャラクター、貴金属のようなものであり、経済ニュースに迅速に反応し、国の政策と米国のインフレ期待を変えるために迅速に反応します。 したがって、テクニカル分析だけでそれを取引することは専門的ではありません。 市場がリスク/オン-リスクオフになると、米国の政体が変化し、国債の利回りが変化し

Dark Gold is a fully automatic Expert Advisor for Scalping Trading on Gold , Bitcoin , Eurusd and Gbpusd. This Expert Advisor needs attention, in fact presents highly customizable. Dark Gold is based on Dark Support Resistance indicator (owning it is not necessary) , these Trades can be manage with some strategies. If you Buy this Expert Advisor you can write a feedback at market and get Dark Support Resistance indicator for Free , for More info contact me The basic strategy st
アップデート!矢印が100レベルと200レベルに追加されました。
このインディケータは極値にアクセスするために正確であり、主に1分間の買いポジションをサポートします。他の時間枠を使用することもできますが、レベルは異なります。これは優れた発振器であり、他の発振器と比較して違いを確認します。
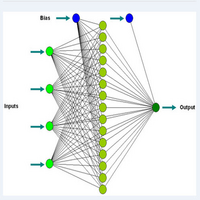
ニューロネットワークの概念を使用したデイトレード。このインジケーターは、基本的な形式のニューロネットワークを使用して売買するシグナルを生成します。 1分足チャートのインジケーターを使用します。インジケーターは再描画されません。 1分間のチャートまたはさまざまなレベルを使用する他のチャートを使用してテスターでダウンロードして実行し、取引を分析して自分で確認します。市場を頭皮にする多くの機会。より高い時間枠で使用できますが、レベルはあなたの裁量に応じて変更する必要があります。時間枠が長いほど、範囲が広くなります。
このモデルで考慮すべき概念と事項:
複数のインジケーターが使用され、重みが適用され、最大値と最小値に2つのデータポイントがあります。この指標は主に上昇トレンドを取引するための
EAの戦略はスウィングトレードに基づいており、iPumpインジケーターによって計算された鋭いインパルスの後のエントリーがあります。 前述のように、EAには自動サポートで手動取引を開始する機能があります。 -下降トレンドの場合↓価格が修正された後に取引を開始し、資産が買われ過ぎゾーンに入り、トレンドに沿って販売します。 -上昇トレンド↑の場合、価格が修正的に下落した後に取引を開始し、資産が売られ過ぎゾーンに分類され、トレンドに沿って購入します。 選択した資産で取引する場合、アドバイザーはトレンドを考慮し、現在のトレンドに従ってのみ取引を開始します。不採算の取引は、停止と平均化の両方を使用して閉じることができます。2番目のオプションは確かにより収益性が高く、リスクも高くなります。 利点 さまざまなTFのレベルを分析するための組み込みレベルインジケーター チャート上で手動で平均化のレベルを選択する機能 多くのピラミッド型注文を開くことによって利益を増やす能力(注文数は自分で制御できます) iPumpインジケーターのリバースシグナルに基づいて、TPを%で設定するためのより多くの基準 「ハンド
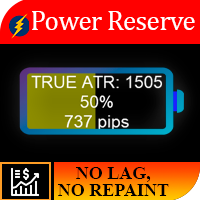
作業ロジック この指標の重要性は、「燃料が機器に残っている」量を理解できるという事実にあります。状況を想像してみてください。あなたが半分放電したバッテリーを搭載した車に残した場合、平均して、この量のエネルギーは通常250 kmの車に十分であるため、必要に応じて700kmの距離を超えることはできません。そのため、商品ごとに一定の日次価格変動があり、統計的観察の結果、資産が1日あたり1 ATRを通過する時間の85%、2以上のATRを通過する時間の15%のみであることが明らかになりました。
例、毎日のATR EURUSD = 682ピップ。トレードに参加します。たとえば、TPが500ピップのレベルのブレイクアウトの場合、正しいTPサイズを設定したように見えますが、資産がすでに1日のATRの90%を通過していることを考慮していません。取引が開始された時間、したがって、楽器にはTPを受け取るのに十分なエネルギーがない可能性があります。楽器の残りのチャージが10%しかない場合は、TPを調整するか、取引にはまったく参加しません。
パワーリザーブインジケーターは、計測器が慣性を使い果たした量

このスクリーナーを使用すると、選択した期間(時間枠)内に通常よりも買われ過ぎ(成長率)または売られ過ぎ(減少率)の資産を特定できます。 市場は法律によって支配されており、より安く購入し、より高価に販売しますが、自動スキャナーがないと、たとえば今週内に、通常よりも買われ過ぎまたは売られ過ぎの通貨/株を特定することは非常に困難です。現在の時間、または月。 数十または数百の機器が存在する可能性があり、すべてを手動で分析する時間がないことが物理的に可能な場合もあります。これらの問題は、Screenerを使用して簡単に解決できます。 スクリーナーができること スキャナーはどのTFでも使用できます スキャナーは、通貨、株式、暗号通貨、商品、インデックス、およびその他の機器で動作します 資産を特定するロジックは、市場の基本法則に基づいているため、普遍的です。 スクリーナーの助けを借りて、あなたはさまざまな戦略に従って作業することができます、最も一般的なものの1つはポンプとダンプです 各商品の平均値を明らかにする-SoftimoTradeScreenerは、選択したTFの資産の買われ過ぎと売られ過ぎ

EasyTradePad は、手動/半自動取引用の取引パネルです。 ポジションと注文を処理し、ワンクリックで資金管理を計算します!
パネルは間違いなくあなたを助けます:
あなた自身が%または預金の通貨で指定した正確なリスクで取引を開始します ストップロスを損失なしに移動して利益を節約する 市場のボラティリティを平滑化することによって取引を平均化する 取引があなたの方向に進む場合は、トレンドに沿ってポジションを追加します さまざまなトレーリングストップ設定を使用して最大利益を絞ります すでに開いている取引のパラメータを変更する 収益性の高いポジションの部分的なクローズを実行する 主な機能: 注文の開始と終了 ポイント単位のSLとTPの計算 預金の%でのSLとTPの計算 $でのSLとTPの計算 ピラミッド 平均化 損益分岐点に転送 リスクに対する利益の比率の自動計算(比率) ポイントとローソク足の影によるトレーリングストップ ピラミッド
パネルは、取引が最初に指定されたTPに近づくと、追加の取引の段階的な開始を実行します。同時に、次の注文ごとに%リスク削減を設定できるため、新

作業ロジック
ストップアウトユーティリティは、ストップアウトレベルまで残っているポイント数を示すシンプルですが非常に便利なインジケーターです。
その利点は、多くのトレーダーが利益を追求して取引する際のリスクを故意に過大評価し、利用可能な証拠金を最大限に使用するという事実にあります。この場合、ブローカーがあなたのポジションを強制的に閉じることができる場所を知ることは非常に重要です。
チャートにインジケーターを配置するだけで、買いまたは売りのオープンポジションに応じて、チャート上にこの取引の価格の境界マークが表示されます。
ポジションを開くまで、ラインはチャートに表示されません。 おすすめのロボットスキャルパー- https://www.mql5.com/en/market/product/77108
変数
フォントサイズ-ラベルのフォントサイズ
エッジインデント-エッジからインデントします
線の色-線の色
テキストの色-テキストの色
FREE

このプロジェクトが好きなら、5つ星レビューを残してください。 インスタグラムでフォロー:borelatech 大規模なボリュームを取引するには、複数の楽器/チャートを調べる必要があります
新しい機会を見つける, このインジケータは、特定の特定のプロットによってあなたを助ける
数またはそのサフィックスの複数のレベルによって、それらを自動的に更新します
価格が変更されると、そうでなければ退屈なタスク。 例えば、GBPUSDでは、インジケーターの4つのインスタンスを
チャートをプロットする: 線長100バーの各0.01間隔。 線の長さ25バーの0.0075間隔で終わる各価格。 線長50バーの0.0050間隔で終わる各価格。 25バーの線長で0.0025間隔で終わる各価格。 このようにして、定規に似ているので、この例が非常に見られます。
スクリーンショット。 また、色やラインのスタイルを異なるスタイルで設定できます。
レベルを視覚化しやすいようにします。
FREE
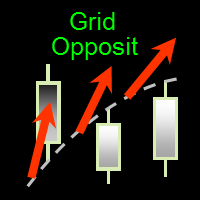
2 in 1. This answers the question, what is GridOpposit?
The Expert Advisor likes trends, so it is trending – this is the TIME. But, like any bot, GridOpposit can make mistakes and then it becomes grid or averaging – these are TWO. The main thing is to act without fuss, according to a competent trading algorithm. GridOpposit also knows how to do this, using a flexible, dynamic order step corresponding to the market situation, rather than a static one. After all, it is on static grids that most a

MetaTraderユーティリティMTI(メイントレーディング情報)–トレーダーの基本的なトレーディング情報を表示します。 平均および現在のスプレッドサイズ ショートポジションとロングポジションのスワップサイズ 1つの取引ロットに対して1ピップのコスト ストップレベルサイズ(保留中の注文を出すための最小距離) 現在の(赤)終了までの時間と次の(灰色)取引セッションの開始までの時間 現在の取引セッションが終了するまでの時間は赤で表示され、次のセッションが開始されるまでの時間は灰色で表示されます。色は、インジケーターのプロパティで個別に調整できます。 おすすめのロボットスキャルパー- https://www.mql5.com/en/market/product/77108
表示は次の方法で実行されます。 欧州貿易セッション(EU旗) アメリカの貿易セッション(米国旗) オセアニア貿易セッション(オーストラリア国旗) アジア貿易セッション(日の丸) 取引セッションの終了と変更の時間を知ることは重要です。なぜなら、取引セッションの終了までに、多くのトレーダーはポジションを修正し
FREE
iPumpインジケーターは、3つのカテゴリーのインジケーターの利点を組み合わせた用途の広いインジケーターです。
複数のTFでの同時トレンド検出 抵抗とサポートのゾーンを定義する 買われ過ぎと売られ過ぎのゾーンの決定 インジケーター機能:
トレンドの定義 この機能は、現在の市場の方向性を客観的に評価し、主観を避けたいすべてのトレーダーに必要です。ほんの一瞬で、最も重要な時間枠でトレンドの方向を比較することができ、これは明確で直感的になります。
サポートとレジスタンスレベルの決定 iPumpインジケーターを使用すると、数秒以内に資産の潜在的な価格障壁を評価できます。
また、インジケーターは目の前にあるレベルのタイプを示します。
テストレベル(抵抗/サポート) 逆転レベル 弱いレベル テストされていないレベル 買われ過ぎと売られ過ぎのゾーンの決定 このタスクでは、インジケーターに遅延や再描画のないシグナルオシレーターがあり、アセットの現在の状態を示します。このデータに基づいて、次のことができます。
購入するのが面白くなる時期を正確に知る 資産を売却することが興味深い
不採算注文のバスケットを「解決」するためのシステム、ニュースフィルター、他の取引商品のオープンポジションのフィルター、および取引シグナルをテレグラムチャネルに送信する機能を備えたグリッドアドバイザー。
エキスパートアドバイザーは、手または他のエキスパートアドバイザーで開いた取引を損益分岐点にするユーティリティとして、アカウントの不採算ポジションを復元するために使用できます。
線形回帰チャネル内で機能し、いくつかの条件で入力します。信号は、線形回帰チャネルの方向、チャネル幅、指数移動平均の交点、1日の平均ボラティリティ、次数平均を使用します。
主な機能: 戦略に含まれるシグナルの取引 ボタンでの取引 ニュースフィルター 他のトレーディング商品のオープンポジションでフィルタリング アカウントの不採算ポジションの決済 位置平均 ポジションのトレーリングストップ利益 損益分岐点に転送 電報にトレードシグナルを送る 電報にニュースを送る
グリッドステップが構成され、価格が私たちに反する場合、一定数の注文の後、アカウント回復機能(ドローダウン削減)がアクティブになり、最も

Description Better version of RSI indicator which offer a complete visual trading strategy and realize an auto-optimization Support: We create great tools for the entire trading community. Most of them are free. If you believe in what we do Support Us Here. KEY LINKS: How to Install – Frequent Questions - All Products How is this indicator useful? NEVER repaints. Detect best parameters of RSI indicator, based on profit factor during the specified period. This indicator can be used as

パネルには、すべての初心者が処理できる最も直感的なインターフェイスがあります。
SLp列で-SLサイズをピップで指定する必要があります。値が灰色に変わり、同時にベイ/セルボタンも非アクティブになっている場合は、ブローカーによって設定される前に許可されていた値よりも小さいSL値を指定しています。
[TP%]列で、アカウント残高の%でTPを示します。設定では、この指標の計算内容に基づいて、資本、残高、または自由証拠金を選択できます。
R%列では、取引のリスク値を設定できます。
Insボタン。 -設定値ですぐに注文を開くことができます。無効になっている場合は、取引のパラメータをチャートに直接プリセットできます。
上部の左上隅にあるマイナス記号をクリックすると、グラフのパネルを最小化できます。
パネル名の下にある+ボタンと-ボタンを調整することで、パネル自体のサイズを拡大または縮小することもできます。
保留中の注文を開いてBUへの転送、トレーリングストップ、注文を開くためのさまざまな設定の保存、さまざまな手法での注文のサポートも必要な場合は、より機能的なEasyT
FREE

このEAは、移動平均クロスとRSIを使用して、他の多くの条件とともに取引を開始し、誤ったシグナルを除外します。 EAには不安定なマーケットフィルターが組み込まれており、EAが機能する期間を設定することもできます。オプションで、マーチンゲールロットのサイズ変更も使用できます。
インストールする方法:
EAをMT4Expertフォルダーにコピーします。 MT4を更新/再起動します 推奨ペアにEAをロードします 必要に応じて設定を変更してください 設定説明
ロットサイズ=>ここでロットサイズを設定できます。ロットサイズがデポジットと一致していることを確認してください。デポジットが少ない場合は、ロットサイズを大きくしないでください。 トレードを失った後のロットサイズの乗算=>ここでマーチンゲールのロットサイズを設定できます。マーチンゲールが必要ない場合は、これを「1」のままにします。 最大ロットサイズ=>これはマーチンゲールがある場合に便利です。マーチンゲールがここに記載されているサイズよりもロットサイズを大きくした場合、取引は行われません。 下位MA期間=>これはMAク
The EA opens and closes new orders on time. It can be used to implement trading scenarios of any complexity by creating a list of tasks. There are two options for completing the task The task is executed on the specified date and time - it is executed once and is removed from the list. The task is executed with repetition on the specified day of the week and time - the task with repetitions is not removed from the list. Panel settings Symbol - select the symbol for the trade function. Time -
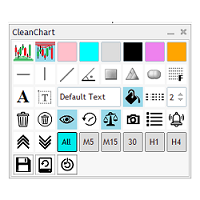
Do you get tired of having a messed up chart with chart objects from various pairs showing up on your current chart? Do you find it boring to have to click multiple clicks to update object colors and styles? Do you want to be able to load a specific set of configurations for your mostly used chart objects? Look no further, CleanChart has it all. 6 customizable Colors User configurable Support and Resistance Colors 10 mostly used chart objects Timeframe visible of any of the objects created Set m
FREE
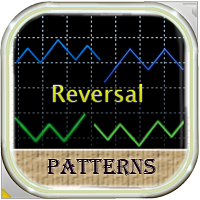
This EA finds technical analysis patterns that foreshadow a trend reversal: "Double Bottom", "Triple Bottom", "Head and Shoulders" and their opposite analogs. The Expert Advisor identifies them on the chart of a currency pair and trades if the pattern has been formed and has been broken through. In addition to the figure itself, the volatility of the currency pair and the readings of some indicators are determined. This allows you to trade more correctly, excluding unnecessary signals, for exam

Scalping indicator. It takes into account volatility, price movement in the local interval and the direction of the current trend. Recommended timeframe - M5. Advantages: Low volatility when a signal appears ensures minimal movement against an open position. The indicator does not redraw its signals. There are alert signals. It is a great tool for day trading.
Settings: Name Description Period Indicator period Range of each bar in the period (pp.) The maximum size of each candle in the indicat
FREE

Defines extremes. This indicator consists of two parts. The first draws lines on the chart indicating low volatility in relative daily market activity. The second is responsible for determining the extremum and gives signals to buy or sell. This system is suitable for all instruments. It is recommended to use a timeframe from m15 to h4. Before using, you need to choose the settings for yourself. Configure lines deviation. Specify volatility coefficient. Advantages The indicator does not repaint
FREE

Monitors the current trend, gives signals for an uptrend, downtrend and weakening of the current trend. Colors the situation on the market with the appropriate color. Tool - any. Timeframe - any. Advantages The indicator does not repaint its signals. There are alert signals. Easy to use. Flexible settings. Suitable for trading any financial instruments. Settings Name Description Fast parameter The value of the fast parameter in the indicator (Should be less than the slow one). Slow parameter The
FREE

The indicator is based on the classic CCI indicator. I recommend watching my advisor - Night Zen EA Doesn't redraw its signals. There are alerts for the incoming signal. It contains 2 strategies: Entry of the CCI line into the overbought zone (for buy trades ) / into the oversold zone (for sell trades ) Exit of the CCI line from the overbought area (for sell trades) / from the oversold area (for buy trades)
Settings: Name Setting Description Period Period of the classic CCI indicator Price C
FREE

Super Scalping M5 is a professional scalping robot for the Metatrader4 platform. The robot works on the algorithm of end-to-end market analysis using trading and analytical modules for virtual simulation of price behavior. Thanks to modern market analysis algorithms, the robot is able to quickly respond to sudden price changes and actively accompany transactions in order to optimize effective trading. How do I test a robot? Download the free version of the robot from the website (only from a PC

Matrix is a Forex arrow indicator. Displays signals simply and clearly! The arrows show the direction of the transaction, and are colored accordingly, which can be seen in the screenshots. As you can see, trading with such an indicator is easy. I waited for an arrow to appear in the desired direction - I opened a deal. An arrow formed in the opposite direction - closed the deal. The indicator also displays the lines with the help of which the arrow signals are formed, taking into account the int

Platoon is an indicator designed to be able to detect a bottom or top similar to the Fractals indicator, but of course a different algorithm is used. In other words, you should not enter into a buy deal if the fractal is below. And you should not enter into a sell deal if the fractal is higher.
The indicator only denotes fractals on the chart without performing any additional calculations, therefore, theoretically, any trader can find these patterns by himself. But what is a fractal, how exac

Angry is a trend indicator, it indicates well the points of the beginning of the trend and its completion or reversal. This tool scans the market looking for the correct entry. Against the background of insignificant fluctuations, it is possible to identify a trend and indicate its direction. It uses only price data and analytics to calculate entry points. Does not use auxiliary indicators.
Angry captures moments of stable price movement direction. There are only three types of trend: Bullish

The Matios indicator visually unloads the price chart and saves analysis time: no signal - no deal, if an opposite signal appears, then the current deal should be closed. This is an arrow indicator for determining the trend.
According to the wave theory, Matios displays the course of the wave, while the oscillator can specify the entry point, that is, catch the price movement inside it, i.e. small “subwaves”. By correctly understanding the wave nature of price movements and using the Matios i

The Schindler indicator implements a trend trading strategy, filtering and all the necessary functions built into one tool! The principle of operation of the indicator is to automatically determine the current state of the market when placed on a chart, analyze historical data based on historical data and display instructions for further actions on the trader's screen. You need to understand that any arrow indicator is only a visual form of a signal. As a rule, such Forex indicators contain a wh

Provided is a trend trading Expert Advisor based on the simplest indicator strategy of following the market towards global price movements. The robot can effectively trade on almost any trading asset or currency pair, but subject to proper optimization. It is recommended to use the robot on the hourly chart of the Euro / Dollar currency pair.
List of all settings: Magic - Magic number. StartVolume - Sets the lot size for entering the market. OnRisk - Activates Money Management. PercentRisk -

===== NEW YEAR 2023 PROMO PRICE TILL END MONTH IS 4.999$ or 10 Licenses ==================
REGULAR PRICE 4.999$
PPtraderEA42 is an EA developed on the basis of years of PROFESSIONAL experience
It is based on the original INDICATOR and is executed in compound interest lot, which will give you EXCELLENT results, as you can see when doing Backtesting.
The minimum and recommended DEPOSIT is only $ 100 USD
It is a RISK strategy, but if you are PATIENT, the profits will come EA supplied in

===== NEW YEAR 2023 PROMO PRICE TILL END MONTH IS 4.999$ or 10 Licenses ================== REGULAR PRICE 4.999$ PPttraderEA73 is an EA developed on the basis of years of PROFESSIONAL experience It is based on the original INDICATOR and runs on the composite batch size which will give you EXCELLENT results, as you can see by doing Backtesting The minimum and recommended DEPOSIT is only $ 100 USD It is a RISK strategy, but if you are PATIENT, the profits will come
EA supplied in SETUP Plug and

This is an Expert Advisor for binary options based on the MACD indicator. It analyzes the market and makes a buy or sell decision. the advisor himself decides. He displays his solution on the chart in the form of arrows. There are only two types of arrows. It is possible to use martingale steps. For this you need to use Magic number. It is already configured by default. You can also specify the size of the rate for it in the current currency. You can simultaneously trade on any currency pair. H

An informational indicator that displays useful information on the chart, as well as notifies you about the occurrence of any event on the market.
Indicator shows:
Broker server time Trading symbol and TF Current profit in points, percent and in the deposit currency Time until the end of the current bar Current spread size
The indicator has an alert system that allows you to signal about any event on the chart:
Price move up or down Break of any level in any direction
Signals can come

MT4 library destined to LICENSING Client accounts from your MQ4 file
Valid for:
1.- License MT4 account number
2.- License BROKER
3.- License the EA VALIDITY DATE
4.- License TYPE of MT4 ACCOUNT (Real and / or Demo)
+ + + + + + + + + + + + + + + + + + + + + + + + + + + + + + + + + + + +
+++++++++++++++++++++++++++++++++++++++++++++++++++ ++++++
+++++++++++++++++++++++++++++++++++++++++++++++++++ ++++++

Trading has never been easier! Let's check this out! MT5 version: https://www.mql5.com/en/market/product/72185 Strategy
There are some news within a day that can make the price jumps up or down very quickly and that is a good opportunity for traders to get some profits. Looking to scalp a news release? Here's how you can do it: Open two stop orders (a buy stop and a sell stop) 3 to 5 minutes before the news release. Place them about 15 to 20 pips away from the current market price. When the n
FREE

HkRecoil MT4 HkRecoil is a fully automatic expert Advisor for trading on the Forex market. The Expert Advisor uses its own price action algorithms The Expert Advisor does not need a news filter Unique transaction tracking algorithm Trend friendly play with technical analysis rules I strongly recommend using HkRecoil on Golde XAUUSD with a low-ping VPS. The recommended leverage is from 1: 500 and above. The Expert Advisor does not need a news filter. Recommended minimum deposit: 100$ Best fr

Delta Channel is a trend indicator by which you can set take profit for buy and sell separately by adjusting the line for each of them. Entering the market by the EURUSD symbol must be done when the price deviates from the corresponding line by 30 points on the H1 timeframe, while the take profit should be set at the level indicated by the indicator (line level), at the same time we set a stop loss in points and an arbitrary trailing -stop pull it up.

The Switches bot works using the Technical indicator. Work only with the USDCAD currency pair, period H1. The expert system goes through the whole history and can work with several currency pairs (USDCAD) with a single setting. The Expert Advisor can be launched on any hourly period, but it works with the H1 period. You can start using it with $ 100 and 0.01 lot. Recommended 1000 $. It is necessary to test the bot both on all ticks and in any other mode, the opening prices are also suitable.

EA Voltz Gold
EA Voltz was designed based on recommendations from the lovely EA Calmed customers. EA Voltz features 2 Strategies with 3 optional enhancements in addition EA Voltz has an option to avoid Support and Resistance Zones; We have tried to test it on Gold and BTC but nothing is guaranteed, please do your own tests and assess your risk before going live.
Live Demonstration Signal for EA Voltz can be found HERE EA VOLTZ MAIN PARAMETERS SESSION TIMER Settings (1.5 = 1:50): Enable

After purchasing, you can request and receive any two of my products for free!
После покупки вы можете запросить и получить два любых моих продукта бесплатно! Advisor for trading gold XAUUSD timeframe M1, it is possible to optimize for other major pairs with preliminary testing using minimal risks. The EA does not use dangerous trading methods - martingale or grid. It works only with pending orders, the EA has a built-in protection against an increased spread, for each transaction there is a

The expert system Rebecca goes through the whole history and can work with a currency pair (USDCAD) with a single setting. The Expert Advisor can be launched on any hourly period, but it works with the H1 period. You can start using it with $ 100 and 0.01 lot. Recommended 1000 $. It is necessary to test the bot both on all ticks and in any other mode, the opening prices are also suitable.
Rebecca bot, works using the Mockingbird indicator. Work only with the USDCAD currency pair, period H1. T
GannRS Trend Scalper GannRS is an advanced trading tool based on Gann Law and Supports and Resistances. designed to have an active trading at any time not lagging Indications are given at the beginning of a new candle
Please watch the full tutorial video.
How to use GannRS Very easy to set up... Put it on your chart Adjust inputs
Inputs Show Resistance and support : [bool] true = Shows R/S on chart false = does not show Show Levels :[bool] true = Shows levels on the chart false = doe

The UltimateX Expert Advisor is a trend trading expert based on the simplest indicator strategy of following the market towards global price movements. The robot uses several moving averages with different periods for price analysis (Delta Channel indicator). Therefore, in theory, a robot can effectively trade on almost any trading asset or currency pair, but subject to proper optimization. It is recommended to use the robot on the hourly chart of the Euro / Dollar currency pair.
The Ultimate

Indiana is a trend Expert Advisor. It works by entering the market with only one buy order and another sell order. Does not form a series of rendering, only 1 order! It uses an indicator to enter. The bot implements a money management system, which consists in a competent calculation of the risk depending on the deposit. To calculate the volume correctly, you need to specify the base deposit for calculating the risk. By default, we are talking about a $ 1000 deposit on the GBPUSD currency pair

Pivot Pro with Alert Pivot points offer very good brands that are often run over by price. At these brands, reactions of the price arise. They can be used excellently as target zones, or as entrances.
The alarm function allows several charts to be opened and it is very easy to find profitable entries.
No missed entries through notification on the mobile phone. You can watch the market with Alerts.
These settings can be changed:
Width of the alarm zone Colors of all pivot lines Colors of
A simple Utility Trading Tool for calculating your profits automatically.
once your orders are active, it calculates your profit or loss in pips value and displays it at the bottom right corner of the screen.
ADVANTAGES - shows order movement graphically - Helps you calculate profit and loss percentages per trade in each asset. - Shows progress of each trade - Easy trading - Helps you meet daily profit targets - Professional trading
FREE
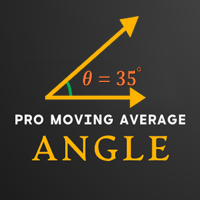
This indicator is a professional Trend identifier, it measures the angle or slope of moving averages with different methods. As this indicator calculate angles you can identify the strength of trend by magnitude of angle. It also shows if angle is increasing or decreasing which gives you the opportunity to make more information about current trend. You can combine this indicator with your strategy as a filter or you can use it alone to make your trading system. This is not a repainting indicator
FREE
MetaTraderプラットフォームのためのアプリのストアであるMetaTraderアプリストアで自動売買ロボットを購入する方法をご覧ください。
MQL5.community支払いシステムでは、PayPalや銀行カードおよび人気の支払いシステムを通してトランザクションをすることができます。ご満足いただけるように購入前に自動売買ロボットをテストすることを強くお勧めします。
取引の機会を逃しています。
- 無料取引アプリ
- 8千を超えるシグナルをコピー
- 金融ニュースで金融マーケットを探索
新規登録
ログイン