YouTubeにあるマーケットチュートリアルビデオをご覧ください
ロボットや指標を購入する
仮想ホスティングで
EAを実行
EAを実行
ロボットや指標を購入前にテストする
マーケットで収入を得る
販売のためにプロダクトをプレゼンテーションする方法
MetaTrader 4のための新しいエキスパートアドバイザーとインディケータ - 128

The Magic EMA indicator is of great help in determining trend direction. It can be an excellent addition to your existing strategy or the basis of a new one. We humans can make better decisions when we see better visually. So we designed it to show a different color for rising and falling trends. Everyone can customize this in the way that suits them best. By setting the Trend Period, we can optimize it for longer or shorter trends for our strategy. It is great for all time frames.
IF YOU NEED
FREE

The Magic SMA indicator is of great help in determining trend direction. It can be an excellent addition to your existing strategy or the basis of a new one. We humans can make better decisions when we see better visually. So we designed it to show a different color for rising and falling trends. Everyone can customize this in the way that suits them best. By setting the Trend Period, we can optimize it for longer or shorter trends for our strategy. It is great for all time frames.
IF YOU NEED
FREE

EasyMトレーディングロボット! 使い方は簡単! 信じられないほどの利益率ランクで最高の利益! 特殊なトレンド戦略によるシンプルでユニークなトレーディングロボット! シンプル、グリッド、またはマーチンゲールにトレーディング戦略を適用する機能! スタート残高は500Eur/USDからがおすすめ! 取引ペア EURUSD、GBPUSD、AUDUSD、USDJPY。 M5 から H1 までの取引時間枠。 任意のスプレッドを持つ任意のブローカーに適しています! 注意!!!これは、使用中の単純な取引ロボットです! bla bla blaはありません....REALがあり、強力なMoney Makerがあります! 購入後、最高の収入を得るための特別なアドバイスを得るために私に連絡してください! ありがとうございました、 よろしくお願いします
MT5 Version
Advanced Daily Breakout
Advanced Daily Breakout allows you to trade session breakouts in an automatic way and with an accurate order and risk managing. This EA focuses on defining the session range and trading its breakout. You can let the trade run until the end of the session or keep a tight trailing stop loss (TSL) to catch as much as possible of breakouts' characteristic explosive price movements while protecting the trade if it turns out to be a fakeout. There are three main w
Thank you for your interest in "Goldfish Indicator". I have been trading since 2008. I usually trade on Renko chart in reversal pattern with Goldfish Indicator. If you share your vps details with me, I will connect your account (Live/Demo). To get proper results copy my trades for at least 30 days. Minimum Deposit: $1000 Leverage: 100:1 Profit Target: Monthly average profit target is 10% to 20%+/- Draw-down: The average drawdown is 10% to 20% Risk
Warning: Trading financial products on margin
FREE

I will support only my client. สำหรับลูกค้า Alien Lots Ai Robot is a safe system for Forex and Crypto currencies trading. Developed exclusively for the XAUUSD pair(GOLD), any currency pairs and any broker. Try now!
The Ai Robot is designed to operate in the XAUUSD (GOLD) and any currencies market, entering only when there are high probabilities of success and certain unique conditions. The Ai Robot is based on a robust, profitable strategy and using percent level step of 1st lot size for MARTI

Divergence
Divergence refers to when the price of a currency pair moves in one direction while the trend indicator is moving in the opposite direction. With divergence, there can be positive and negative signals. Divergences in Forex trading are quite common signals of technical analysis. These are basic early Forex signals indicating the trend reversal and filter false signals. Application of this indicator It is usually not easy to detect divergences by the trader and it may be time-consumin
It is the simplest indicator in existence. It has only one function: report the seconds elapsed since the last minute end in a very convenient way, with a label that can be moved in the chart, so that the trader does not have to take his eye off the forming candle. It is used on M1, but also on larger intervals, for those interested in opening/closing positions at the best time. Sometimes an intense movement in the last 10" of the minute gives indications of future trend, and can be used for sc
FREE

SmartDash Trader EA This is MT4 Semi Automated EA which trade using BUY, SELL and CLOSE Buttons to executes trade actions. You can use Auto Set SL/TP/Lot of your choice since the EA comes with only 0.01 lot and 0 for TP/SL. Set 10 pips for TP to take advantage of trades. NOTE: THIS EA DOES NOT BACKTEST. ITS BUTTON TRADER EA HOW THE STRATEGIES TO USE THE DASHBOARD TRADER Wait for a weaker or stronger currency means the currency strength meter should show less than 15% for SELL and more than 88% f

The LineMagnit Indicator for MT4 is a highly precise tool that builds support and resistance levels which magnetically attract prices. This feature allows traders to easily determine the most probable entry and exit points in the market, as well as identify the market's directional forces, as levels are based on capital inflows into the instrument. Equipped with an intuitively understandable graphical interface, the LineMagnit Indicator enables users to quickly locate and analyze support and res
!! FLASH SALE !! Over 80% off !! For ONE week only. Now only $47 - normally $297! >>> Ends on 30 June 2023 - Don't miss it!
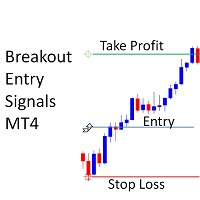
Buy and Sell Alerts when price breaks out following strict price action. Sends Alerts – On MT4 To Your Phone To Your Email
Does not repaint .
Works on any Forex pair, any timeframe.
10 Activations allowed so you are free from limitations >> MT5 Version Here For spreads from a tiny 0.1 pips RAW/ECN Accounts, click here . Check out my Waka Esque EA signal her

The indicator returning pivot point based trendlines with highlighted breakouts . Trendline caculated by pivot point and other clue are ATR, Stdev. The indicator also includes integrated alerts for trendlines breakouts and foward message to Telegram channel or group if you want. Settings · Lookback bar: Default 200 is number of bar caculate when init indicator. · Length: Pivot points period · Slope Calculation Method: Determines how this lope is calcula
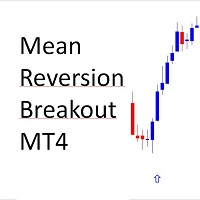
Buy and Sell Arrows when price breaks away from mean price. Sends Alerts – On MT4 To Your Phone To Your Email
Does not repaint .
Works on any Forex pair, any timeframe.
10 Activations allowed so you are free from limitations >> MT5 Version Here
For spreads from a tiny 0.1 pips RAW/ECN Accounts, click here . Check out my Waka Esque EA signal here: >> High Risk Settings or Medium Risk Settings .
What Is The Meaning Of Mean Reversion? Mean reversion, or reversion to the mean, is a theor
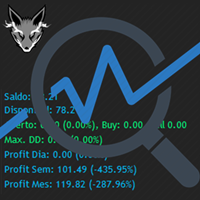
Track your overall trades! Monitor New Fox is an excellent indicator, which displays your current profits, being them monthly, weekly, and daily, that is, all profits obtained when you opened the mt4. Our brand new Monitor New Fox indicator is able to unlock all advanced features of MetaTrader 4. This indicator can graph with simple data key meta trader account data (Balance, Equity, Free Margin, Current Profit/Loss, Profit/Loss total, amount of open position(s) and size, etc.) and all this in a
FREE

請點選copyright link跳轉至官方網站觀看詳細說明 https://www.ainstein.com.tw/
由AInstein研發團隊獨立開發的全方位交易整合軟體,並獲得經濟部核可「智能交易系統軟體」智產權專利,提供協助交易者最專業的交易資訊軟體與諮詢服務。 由AInstein研發團隊獨立開發的獨創外匯智能交易系統,並持有經濟部智慧財產局頒發的專利證書新型第M598465號—智能交易系統,讓交易者能以玩遊戲的形式,輕鬆愉快地進行交易。 提供官方專屬的合作券商平台優惠方案,並依據個別需求,提供客製化策略方案設計及諮詢服務。 提供同業與異業間彼此推廣的商業合作策略方案設計及諮詢服務。 提供專業的客製化EA代寫,協助有策略但非程式專長的交易者,也能有專屬的量化交易工具。 提供與券商間互惠互利的合作,以及代理技術客製化培訓課程,協助代理專業交易知識與技術的提升。

Based on famous and useful indicator - Super Trend, we add some features to make this Indicator much easier to use and powerful. Ease to identify the trend of any chart. Suitable for both Scalping & Swing Better to use in the trending market be careful in sideway market, it might provide some fake signals Setting: ATR Multiplier ATR Period ATR Max Bars (Max 10.000) Show UP/DOWN node Nodes size Show Pull-back signals Pull-back filter ratio Period of MA1 Mode of MA1 Period of MA2 Mode of MA2 A
FREE

Forex Trade Manager MT4 simplifies managing open orders in MetaTrader 4. If you open a new order, the manager automatically sets Stop Loss and Take Profit. When price will move, then the program could move Stop Loss to Break Even (stop loss = open price) or continuously moving Stop Loss (Trailing Stop) to protect your profits. Forex Trading Manager is able to control orders for only current symbols (where EA works) or for all opened orders (regardless symbol) and hide the Stop Loss and Take Prof
FREE

Forex Trade Manager Grid MT4 helps you to managing orders and achieve the goal. You only need to place first order with Take Profit, run EA and set in params profit (pips) you want to get. EA will be managing your positions, as will gather appointed amount of pips. It’s a strategy for management of manual trades opened on current pair. The strategy adds positions to currently opened trades in a grid management (with chosen distance in pips between trades) - up to 15 trades (or less). First up to
FREE

Dear Traders this is my another tool called " Swing Master Indicator ". As the name above the indicator is designed to help you in swing trading by capturing the low and highs of the price. You may us this tool with any trading strategy and style from scalping to position trading. It is made for level of traders including newbies and advanced traders even prop-firms, hedge funds and banks to help them make sold market analysis. I create tools for serious traders who want to make a difference in

Key Price Levels Indicator Indicator that shows the highs and lows for the significant price levels for past periods that could be potentially considered as reaction levels. The indicator displays the following price levels: Yesterday high and low The day before yesterday high and low Two days back high and low Last week high and low Last month high and low Last three month high and low (Quarter) Last year high and low
FREE

Dear Valuable Friends , This New Free EA works as below : - waiting the M15 diagram to show the reverse or continuing of the trend - confirm signal on H4 Diagram . - wait till the entry strategy is being extremely true - put direct entry point (sell or Buy ) and put Pending Orders (P.O) in grid
All these will be Active after manually set in common parameters that u fully controlled .
Check the pics to recognize ..
for any Question write to me directly ..
Best Luck Best Luck
FREE
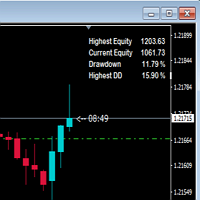
This indicator shows drawdown based on highest equity. Usually drawdown is used to show performance of a trading account especially when someone participate in a trading contest. If drawdown exceed a determined number, the contest account will be disqualified. So, I hope, this indicator will warn us in maintaining the drawdown and the account still be saved.
FREE

Karla Three is the final piece of the Karla series. It differs from Karla One & Karla Two in the strategy and symbols that it trades. It is a very complex piece of software that analyses each H1 candle of every symbol from the list and is capable of identifying rare patterns which are usually too difficult to spot for a human eye. Because such patterns have a high probability of repeating themselves, this EA will try to repeatedly catch them and monetize on them. To get the best results I traine
MFG 2022 is fully automated and optimized to work with AUDUSD. Analyzes suitable points for opening orders and uses a suitable grid, maximally safe. Based on the author's price analysis, the expert is optimized and does not need further optimization. Best results are achieved with AUDUSD, time frame 15 min. Suitable for beginners and experienced traders.
Info:
• Working symbol AUDUSD
• Working Timeframe: M15
• Min deposit: $300
• Min leverage 1:100
• Good ECN broker is require

Optimizable inputs are included, optimize before test and use to find best settings. Leave some star reviews if you like. Golden Age of Trade trades XAU/USD on 1 hour charts. The trading logic uses the Keltner channels and ATR. The EA will short at certain bar range and go long at a certain bar range. Load in the tester to see if this EA fits you. It is optimized but it may be more optimizable. Try some inputs to find the best values to trade by. The inputs are simple and it uses a fixed

This is a price action trading robot, the EA will stick to the medium term trend and price to deliver trades. Orders are always protected by the user set stop loss points. With the capital management system, it will help that EA operates in accordance with its purpose. Telegram : https://t.me/trungtqIT Timeframe is M15,H1,H4. Minimum account balance: $100. Attention is Important: EA only test live on demo or real accounts. Backtest results are just random and inaccurate.
Features: Every trade i

This system is dynamic in the way places orders across all assets it's used on. The product is currently underpriced for the moment to get users to appreciate the quality of the product. It is created in a simple fashion to focus on positive results. In future we will improve on the look if that is necessary for our customers using the product. The system as-is triggers limit orders at levels that we believe should experience some bounce in price movements. Test and share your success with us an

Expert for portfolio of basic set long term strategies. You can choose for your AOS trading two ways – first way is pucrhased for EA with grid, martingale and other similar dangerous strategies. This EAs work great and have very profitables results – days, weeks, maybe months, years?.. Until they didnt blow up your account. The second way is to use EAs based on real trading strategies and logical patterns. On MQL Market are very few of these strategies. The risk of trading with these EAs

QCAFE+ Trend Filters is a simple but useful for Traders to eliminate false signal from all kinds of Buy/Sell signal indicators. With QCAFE+, Traders can identify UP Trend/DOWN Trend or SIDEWAY period of Market to decide whether Enter a Trade or Not. With 5 Elements of Filters which are shown the Momentum and Strength of the Market; Each element has 3 types of arrows to show Uptrend (Blue UP arrows), Down Trend (Orange Down arrows) or Sideway (Grey Arrows). The Top Element is the main signal tha
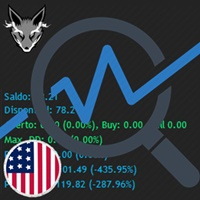
Track your overall trades! Monitor New Fox is an excellent indicator, which displays your current profits, being them monthly, weekly, and daily, that is, all profits obtained when you opened the mt4. Our brand new Monitor New Fox indicator is able to unlock all advanced features of MetaTrader 4. This indicator can graph with simple data key meta trader account data (Balance, Equity, Free Margin, Current Profit/Loss, Profit/Loss total, amount of open position(s) and size, etc.) and all this in a
FREE

PLEASE LEAVE US A 5-STAR REVIEW LDS Scalper User Manual+ Extra LDS CSDIF INDICATOR + Training Videos ABOUT LDS SCALPER INDICATOR STRATEGY Built on 15+ years of trading experience. LDS Scalper is a very powerful trading indicator for scalping strategy, returns very high accuracy rate in forex, futures, cryptocurrencies, stocks and indices. This indicator displays arrow signals based on price action information with high accuracy. The LDS Scalper Indicator strategy when applied can turn a ne
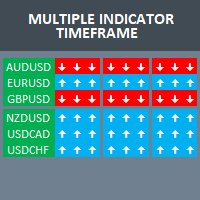
Build your own strategy by using this panel and specify indicator and multiple time frame to display and use in a summary calculation to generate a trade signal. A panel or dashboard that display multiple Indicator in a multiple Time Frame. The user has an option to specify number of Indicator to enable or display on the dashboard. A maximum of 10 indicators can be enabled. Each indicator column can be selected from multiple lists of Indicator type. The user has an option which Time Frame of eac

Apollo BuySell Predictor は、いくつかの取引モジュールを含む専門的な取引システムです。独自のブレイクアウト ゾーン、フィボナッチ ベースのサポートとレジスタンス レベル、ピボット トレンド ライン、プルバック ボリューム シグナル、およびトレーダーが日常的に必要とするその他の便利な機能をトレーダーに提供します。システムはどのペアでも機能します。推奨される時間枠は M30、H1、H4 です。インジケーターは、H4 よりも高い時間枠を除いて、他の時間枠でも機能します。 このシステムは、トレーダーが取引を成功させるために必要なすべてを提供するため、普遍的です。システムは複数の方法で使用できます。デイトレード、スイングトレード、さらにはスキャルピングにも使用できます。どのような取引スタイルを好む場合でも、システムは市場を真の姿で見るのに役立ちます。すべての信号は再描画せず、ラグもありません! 取引の好みやタスクに応じて、システムのさまざまなモジュールのオン/オフを切り替えることができます。システムは、PUSH 通知を含むすべてのタイプのアラートを提供します。必要なアラー

** All Symbols x All Timeframes scan just by pressing scanner button ** *** Contact me to send you instruction and add you in "M W Scanner group" for sharing or seeing experiences with other users. Introduction: Double Top(M) and Double Bottom(W) is a very repetitive common type of price reversal patterns. Double Top resembles M pattern and indicates bearish reversal whereas Double Bottom resembles W pattern and indicates a bullish reversal that they have high win rate. The M W Scanne
株価指数の開始時に発生する爆発的な動きから利益を得て、毎日実行可能な優位性を手に入れましょう。 オープニング レンジ ブレイクアウト EA は、DAX、DOW、NASDAQ、S&P500 などの主要な株価指数で毎日オープン直後に形成されるトレンドを捉えるために、好みに合わせて微調整できます。 これらのオープンは毎日同時に発生するため、いつボラティリティが発生するかを知ることができ、多くの場合、この EA でキャプチャして取引セッション全体に乗ることができる強いトレンドが形成された直後に発生します。
始値の範囲は、通常、株式市場が開いてから最初の 5 ~ 15 分であり、大規模な市場参加者による最初の注文の後、投機的な取引が開始されます。 開いた後、2 つのうちの 1 つが発生する傾向があります。 1. インデックスが上昇し、反転し、再び反転するレンジまたはローテーション日を取得します。 最近では、戦略と EA が損益分岐点になるか、少額の損失を出すことがよくあります。 2. 何時間にもわたって市場が一方向に動く傾向がある日。 これらは、戦略が実際にバンクし、トレンドに乗って 3 ~
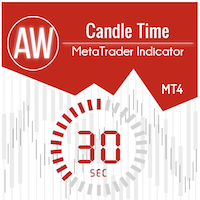
ろうそくの終わりまでの時間の指標。ろうそくの終わりまでの時間とサーバー時間を表示します。テキストはろうそくの傾向または方向を表示でき、サウンド通知が組み込まれています 特徴:
現在のろうそくの終わりまでの時間と、必要に応じて調整または無効にできる他の時間枠を表示します AWキャンドルタイムは、AWスーパートレンドインジケーターで現在のキャンドルまたはトレンドの方向を選択できます トレンド戦略は選択した色で強調表示されます ろうそく交換前の音通知と追加彩色を内蔵 表示は、現在の価格の横またはチャートの隅に設定でき、入力設定で柔軟に調整できます Instruction -> ここ / その他の製品 -> ここ 入力変数:
主要 Candle_Time_Location - ローソクのタイムスタンプの場所。チャートの隅または現在の価格の隣に配置できます Trend_Strategy - 色付きのろうそくのタイムスタンプを使用します。 AW SuperTrend インジケーターを使用して、トレンドの方向に色を付けることができます。現在のろうそくの方向に応じて色を付けることができます
FREE

IndexWizard は、MT4 プラットフォームおよび Ger30 などの指数の取引用に設計および最適化されたプロの自動取引システムです。 S&P500、US30指数。
このシステムは端末上で独立して動作します。ロボットの実行中にコンピューターの電源を入れる必要があるため、コンピューターまたは VPS で実行できます。
ロボットは市場を 24 時間分析し、Ger30 の H1 時間枠で取引を開始します。 S&P500 の H1 または 5M 。 & 5M US30。そのおかげで、人間よりも効果的です。
更新と最適化は継続的に行われ、購入者が利用できます。
ロボットはさらに開発され、将来的にさらに優れた取引効果を達成するのに役立ちます.
危険な戦略を使用しないでください。実際のストップロスとテイクプロフィットのみ。
インターネット接続や電気が失われた場合でも、注文はストップロスで保護されます。
ロボット IndexWizard の動作原理。
ロボットは常に取引を行い, 戦略的で質の高い結果が得られます. しばらくお待ちください, ロボットを起動して結果を確認してく

このアルゴリズムは、指標 UPD1 Trend Direction に基づいて減少したボラティリティのゾーンを検出し、指標 UPD1 Volume Box に基づいて最大水平ボリュームを構築します。 原則として、蓄積を終了するときに強い傾向の動きが発生します。 価格が累積を残している場合は、その最大水平ボリューム(POC)をテストすることができます。 スマートアラートは設定で使用できます。
入力パラメータ 。
基本設定 。 Bars Count – 指標が機能する履歴バーの数 。 Timeframe Flat - フラットが検索され、クラスターが構築されている時間枠の選択。 デフォルトでは、それは常に現在のものです。 Data Source - 見積期間の選択。 自動的に検出(最適) 。 Vertical Step - 密度と垂直精度に影響します 。 Period - オシレーターの周期を選択します 。 Start Flat After Bar - フラットを描画を開始する傾向の終了後に無視するろうそくの数 。 Minimal Flat Bars - フラット内のキャンドルの最小
FREE
インジケータは、指定された係数に基づいて、低、高、極端なボリュームを検索し、指定された色でそれらをペイントします。 Metatraderターミナルの標準ボリューム描画機能に置き換えられます。 キャンドルは、ボリュームの色で着色することもできます。 極端なボリュームを持つローソク足では、最大水平ボリューム(クラスタ/POC)が決定されます。 その位置(押す、中立、停止)に応じて、クラスターにも独自の色があります。 クラスターが影の中にあり、ろうそくが極端なボリュームを持っている場合、反転のための矢印が得られます。 設定でアラートを有効にすることができます。 さらに、インジケーターには、クラスターをシャドウで表示する別のオプションがあります。
入力パラメータ 。 (色と視覚的な設定に関連するいくつかはスキップされます) 。
基本設定 。 Bars Count – 指標が機能する履歴バーの数 。 Data Source - 見積期間の選択。 あなたが切り捨てられ、不完全なように過去の歴史を見ると思われる場合は、あなたが勉強している楽器のためのより多くのM1引用符をダウンロー 。 Ver

このインジケータは、フラット位置とトレンド位置を表示するために使用されます。 設計は発振器に基づいています。 これは、通常のチャート上の取引のために、バイナリオプションの両方のために、追加のフィルタとして使用されます。 フラットの場所は、スマートマネーの概念に従って取引するための指標 UPD1Volume Cluster で使用されます。 内蔵のアラートは、最大の買われ過ぎ/売られ過ぎの場所を通知します。
入力パラメータ 。
基本設定 。 Bars Count - 指標が表示されるバーの数を指定します 。 Period - オシレータの周期を選択します 。 Start Flat After Bar - フラット描画を開始するために、トレンドの終了後に無視するバーの数 。
視覚的な設定 。 Color - 自動または手動で 。 Floor Color - 色が「手動」に設定されている場合は、独自の色を設定できます 。 Histo Width (0 - Auto) - ヒストグラムの太さを選択するか、自動モードを設定します 。
Alert Settings 。 Alert - 通
FREE

インジケータには、選択した時間枠の最大水平ボリュームが表示されます。 インジケーター UPD1 Volume Box に基づいています。 ラインは接続または分離することができます。 設定では、スマートタッチ通知を有効にすることができます。 この指標は、市場プロファイルとスマートマネーの概念を使用して取引する人に役立ちます。
入力パラメータ 。
基本設定 。 Bars Count - は、TF POCが描画されるバーの数を示します 。 Data Source - ティックが使用される時間枠 。 Vertical Step - 密度と垂直精度に影響します 。 TimeFrame Period - 最大水平ボリュームが適用される時間枠期間 。 ID - インジケータ識別番号。 異なる値を選択して、同じチャート上のインジケーターを複数回使用します 。
視覚的な設定 。 Current POC - 表示されるPOCの表示 。 Crop Line To Current Bar - 行は最後のバーを超えません 。 Link POC - POCラインを垂直線で接続する 。 POC Width
FREE

現在の主要市場セッションと次の主要市場セッションを開始するまでの残り時間を表示します。
市場
ニューヨーク ロンドン フランクフルト トキオ シドニー カスタム名、開始時間と終了時間を含むセッションが 1 つ
時計時間
GMT / UTC ローカル (コンピュータから) ブローカー (サーバー時間) 設定のデフォルト時間は GMT です。 ローカル時間またはブローカー時間に変更した後は、選択した時間タイプに基づいて各セッションの開始時間と終了時間を手動で調整する必要があります。 各市場の開場時間と閉場時間は調整可能
グラフィック設定 各セッションは個別に表示または非表示にすることができます。 これには以下が含まれます: セッション名、オープンバーに表示 始値ライン、セッションが終了するまで描画されます 背景色 セッションの背景色には 2 つのモードがあります
最初のバー、区切り文字として役立ちます 開始時間から終了時間までセッション期間を完了する
※セッションカラーが重なる場合は、セッションカラーが混合されます。 これにより、チャート上に新しい特定の色が作成されます。履歴デー
FREE

ボラティリティに適応し、取引ポジションに報酬を与えるための潜在的なリスクは、平均真の範囲に基づいて示されています。 "購入または売却"ボタンをクリックすると、リスク-報酬-ボックスが表示されます! ATR計算の有用性は、取引を終了するときのためのハードな決定の一部ではない問題で喜ぶ。 この問題は、あなたのリスク管理の決定を支援します。
仕様 平均真の範囲は、ピップまたは価格で市場のボラティリティを測定する一般的に使用される指標です。 真の範囲は、任意の期間におけるローソク足の最低取引価格と最高取引価格との差です。 平均真の範囲は、すべてで、日の"前の"期間のこれらの高値と安値を平均します。 例では、ATRインジケータのデフォルト設定は、私たちに14日間の期間を与えます。 ATRは、14日で割って、ピップ値で高値と安値を収集します。
しかし、もちろん、これは一般的な指標、ATRを超えています。 実際には、3つの全く異なるTPsは、異なるピップ消費のために独自の時間枠にのみ依存しています。 ローソク足のルールは、各時間枠で技術的に異なります。 したがって、同じ期間を使用すると、時間枠

Balance Martingale MT4 は、MetaTrader 4向けに設計されたエキスパートアドバイザーで、シンプルかつ効果的なマーチンゲールおよびリバースマーチンゲール戦略を用いて取引を管理します。このツールは、連続した勝利または敗北のストリークに基づいてロットサイズを調整し、勝利が続く場合は勝利乗数、敗北が続く場合は敗北乗数でロットを増やします。勝利サイクルから敗北サイクル、またはその逆に移行する際には、ロットサイズがデフォルトにリセットされ、リスクを最小限に抑えながら、敗北ストリーク中に買い注文と売り注文を交互に切り替えて回復を最適化します。 MT5バージョンはこちらでダウンロードできます: Balance Martingale MT5 MT4のフルバージョンはこちらでダウンロードできます: Balance Martingale MT4 詳細なドキュメントはこちら: 全体設定/入力ガイド バックテストおよび設定ファイルはこちら: バックテストと設定ファイル 機能: マーチンゲール戦略:敗北ストリーク中にロットサイズを敗北乗数で増やし、損失を回収します。 リバースマーチン
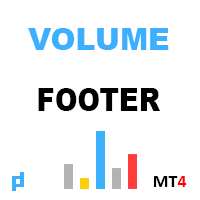
インジケータは、垂直方向の音量を示しています。 設定では、高と極を決定するための2つの係数、および低ボリュームを決定するための1があります。 同様のアルゴリズムが指標 UDP1 Volume Pixel でも使用されます。 指定されたボリュームが検出されると、ヒストグラムは適切な色で着色されます。 ヒストグラムの幅は、スケールに応じて自動的に選択されます。 原則として、価格は最大量と最小量に反応します。 しかし、確認信号を使用する必要があります。
入力パラメータ 。
基本設定 。 Bars Count - インジケータが表示されるキャンドルの数 。 Calc Bars - ボリューム偏差を決定するためのキャンドルの平均数 。 Low Volume Factor - 我々は、低ボリュームを定義する以下の係数 。 High Volume Factor - 我々は大きなボリュームを定義する上の係数 。 Extreme Volume Factor - 我々は極端なボリュームを定義する上の係数 。
視覚的な設定 。 Histo Color - キャンドルのボリュームと方向に応じてヒストグ
FREE
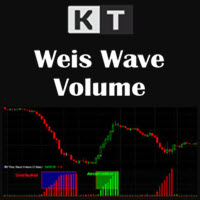
KT Weis Wave Volumeは、現在の市場トレンドと価格変動の方向に基づいたテクニカル指標です。このインジケーターは出来高に基づいており、価格の上昇と下降に対する累積出来高をチャート上に表示します。
さらに、インジケーターウィンドウには、緑色の波と上昇する赤い波のヒストグラムが表示されます。
緑色は上昇の動きを示しており、価格が上がるほど緑の出来高も増加します。赤色は下降の波を示しており、価格が下がるにつれて赤い出来高も増加します。インジケーターが描く各波を分析することで、市場の変動状態を深く理解することができます。
主な機能
あらゆる市場における価格波と出来高を表示します。 トレンドの方向性と強さを把握するのに役立ちます。 設定やカラースキームを自由にカスタマイズ可能です。 すべての時間足で使用可能です。
KT Weis Wave Volumeの仕組み Weis Wave Volumeでは、各波における出来高を合算して表示します。これにより、交互に現れる波の累積出来高を棒グラフとして視覚化できます。
累積された出来高こそが、Weis Waveチャートのユニークな

Obie 1M Scalper Metatrader 4 Forex Robot は、13 の移動平均を利用する自動化された外国為替取引ソフトウェアです。
基本的に、売買シグナルの市場をスキャンするロジックを策定する際に複数の移動平均を使用することで、そのようなアラートがますます正確になります。
名前が示すように、GBP/USD、EUR/USD、USD/CHF、USD/CAD などの主要な外国為替ペアや上場株式の 1 分間の時間枠で最も効果的なスキャルピング アルゴリズムです。 ナスダックで。
この自動取引システムの取引に伴うリスクはスプレッドです。
したがって、1 分間のスキャルパー エキスパート アドバイザーは、比較的狭いスプレッドの外国為替ペア (たとえば、EUR/USD、USD/JPY、GBP/USD) にのみ展開する必要があります。
ストラテジーテスターレポート 1分チャートのGBP / USD外国為替ペアの1ミニッツスキャルパー外国為替ロボット戦略テスターレポートの下を見つけてください。
総合業績 EA は、合計 13 の取引から合計 $605.44 の利益を
取引の精度を向上させるために、Ultimate Confluence Signal Indicator MT4 を使用してください。これは、外国為替、CFD、暗号通貨、商品の高確率セットアップのための、十数以上の実証済み技術ツールから信号を同期させる強力なマルチインジケータースイートです。コンフルエンス取引の基本原則からインスピレーションを得て—1990年代にAlexander Elderのような専門家が「トリプルスクリーン」システムで先駆けた—このインジケーターは、トレーダーが複数の分析(トレンド、モメンタム、ボラティリティ)を重ねてノイズをフィルタリングし、整列した市場力を活用することを求める中で人気を博しています。小売および機関トレーダーに広く採用され、強固なトレンドの特定、反転のピンポイント、ブレイクアウトの検出に優れており、研究ではコンフルエンス戦略がRSI、MACD、ADXなどのインジケーター間のコンセンサスを要求することで勝率を20-30%向上させる可能性を示しています。これにより感情的な意思決定を減らし、偽信号からのドローダウンを最小限に抑え、ボラティルな環境でのスキャ

STM Trade Panel MT4で取引を簡素化しましょう。このユーザーフレンドリーなエキスパートアドバイザー(EA)は、MetaTrader 4での取引実行と管理を効率化するために設計されており、ワンクリックでの注文配置とカスタマイズ可能な利益および損失閾値に基づく自動取引クローズを提供します。MQL5、Forex Factory、Redditのr/Forexで直感的なインターフェースと効率的な取引管理により高く評価されており、このEAは外国為替、指数、暗号通貨などのボラティリティの高い市場でスキャルパー、デイトレーダー、スイングトレーダーの主要なツールです。ユーザーは、取引実行時間が40〜60%削減され、リスク管理が改善されたと報告しており、多くの人が迅速な設定と利益ロック機能を持つシンプルなパネルを称賛しています。使いやすさを求める初心者トレーダーや複数の取引を管理するプロフェッショナルに最適なSTM Trade Panel MT4は、さまざまな取引戦略において効率と規律を向上させます。 STM Trade Panel MT4は、ワンクリックの購入/売却ボタン(ButtonB
FREE

Bigger chart labels would allow the user to be entirely aware of which chart he/she is on. Each chart window is unique, containing different patterns and economic motives so acknowledging the chart window would be absolutely essential! There are well known Economic Time Zones included in clear view, by choice! Simple does it! Use your computing mouse scroller, clicking with the right finger on the label, in order to customize the label properties. From there, choose your preferred color, fon
FREE

MMDによるダイヤモンド
Diamond by MMD は、価格動向にとって重要な場所を特定する高度な指標です。 このインジケーターは、任意の時間枠で、チャート上の価格反応ゾーンを検出してマークします。 ダイヤモンド - MMD 方法論の知識ピラミッドの要素の 1 つ - は、非常に厳しい条件を満たすキャンドルです。 ダイヤモンドには主に 2 つのタイプがあります。 - 標準ダイヤモンド - 逆認知症。 これらのモデルはどちらも自動的に識別され、チャート上でマークされます。 インジケータは、たとえば H1 間隔の M5 間隔から、ダイヤモンドをマークできます。 インジケーターのデフォルト設定では、現在チャートを開いている時間枠にひし形が表示されます。
指標パラメータの説明。 標準ダイヤモンドを使用 - モデル 00100 のダイヤモンドを表示/非表示にします 逆ひし形を使用 - モデル 0010100 のひし形を表示/非表示にします ダイヤモンドの時間枠 - ダイヤモンドを表示する間隔を指定できるオプション。 たとえば、M1 または H1 ローソク足でチャートの M5 間隔のダイ
「タンブラー」と呼ばれるこの Expert Advisor は、マーチンゲールの原理に基づいて動作し、設定によっては確率的シグナルをエントリーに使用します。その独自性は、ストップロスによってトランザクションをクローズするときに、前のトランザクションまたは一連のトランザクションに投資された資金を考慮して、トランザクションが別の方向に開かれるという事実にあります。 設定に応じて、アシスタントとしての手動取引と自動取引の両方で使用できます。 `Tanburā' to yoba reru kono Expert Advisor wa, māchingēru no genri nimotozuite dōsa shi, settei ni yotte wa kakuritsu-teki shigunaru o entorī ni shiyō shimasu. Sono dokuji-sei wa, sutoppurosu ni yotte toranzakushon o kurōzu suru toki ni, mae no toranzakushon matawa ichiren no to

Pure Management Metatrader 4 Forex Robot は、1 日のセッション中にわずか 10 ピップスの利益を得るように設計されたアルゴリズム トレーダーです。
EA は、入札で連続して勝つ可能性が高いことを優先してより良い結果を見つけるアルゴリズムを展開し、それによって期待されるペイオフを改善します。
ピュアマネジメントのエキスパートアドバイザーは、過去の統計データに基づいた資金管理手法と、負けた後のロットの増加を利用しています。
Pure Management forex ロボットは、いくつかの連続した勝利の直後に注文ロットを増やしてリスクを軽減します。 デフォルトの最大ロットサイズの上限である 5.0 を使用して、この増加する注文ロットを抑制します。
ストラテジーテスターレポート
以下の 1 分足チャートの EUR/USD 外国為替ペアの Pure Management ロボット戦略テスター レポートを見つけてください。
総合業績
EA は、合計 198 の取引から合計 $1640.00 の利益を上げました。 最大の勝ちトレードは $5

あらゆる時間枠に適しています あらゆる通貨ペアに適しています 構成は不要 インジケーターとして、または完全に自動化された EA として使用できます カスタマイズ可能な設定 1. 主なパラメータ 1.1 ロング / ショートオーダーの 2 つの注文コメント 1.2 2 つのユニークなマジックナンバー。ロング / ショート用 1.3 最大許容スプレッド 1.4 最大許容スリッページ 1.5 この EA 内で使用されるすべての指標は完全にカスタマイズ可能です 1.6 ブローカーの数字を定義する 1.7 完全に自動化された EA として使用するか、取引を行う場所を示すインジケーターとして使用します 1.8 注文実行を含むメールを送信する 1.9 注文 / 実行時にサウンドを再生する 1.10 エラー発生時の再試行回数 1.11 買い / 売り注文を識別するための色を定義する 1.12 ポップアップメッセージボックスのアラートのオン / オフを切り替えます ( すべてのメモは [ ジャーナル ] タブに印刷されます ) 1.13 ヘッジに使用されているかどうかを定義します (EA は取引
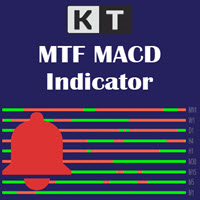
トレーダーとして複数の時間足を同時に監視することで、全体のトレンドをより深く理解し、異なる時間足が同じ方向に動いているのか、それとも相反しているのかを把握することができます。 KT マルチタイムフレーム(MTF)MACDは、すべての時間足におけるMACD(移動平均収束拡散)を一つのチャート上に表示することで、銘柄全体の方向性を一目で確認できるインジケーターです。 各時間足ごとのMACDのトレンドを示すシンプルな表を表示し、MACDが時間足ごとに勢いを増しているのか、あるいは失っているのかを視覚的に把握できます。
特徴
KT MTF MACDは最大5つの異なる時間足、間隔、銘柄を同時に監視できます。 各データストリームにおけるMACDのトレンドとシグナルを検出します。 複数の時間足チャートを一つの要約ビューにまとめることで、チャートの見やすさが向上します。 複数のチャートやインジケーターを使用しないため、PCリソースの消費を抑えます。 高度なカラーコード機能とカスタマイズオプションを搭載。 トレンドの変化が発生した際にアラートを出す機能もあります。
まとめ マルチタイムフレーム分析は
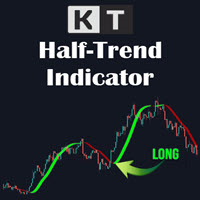
KT HalfTrend は、移動平均線に基づくトレンド指標であり、チャート上にゾーンを描画します。トレンドの変化を示すために、強気および弱気の無効化ゾーンを視覚的に表示します。 また、メインチャート上に矢印を用いて売買の強さを示します。トレンドがない場合、インジケーターはフラットになります。これは蓄積、価格の一時停滞、または分配ゾーンであることを示唆します。トレンドがある場合、傾きがその方向に現れます。 傾きが急であるほど、トレンドシグナルはより強力です。強い上昇トレンドは青色で、強い下降トレンドは赤色で示されることがあります。
機能
非常に使いやすく、視覚的にも優れたインジケーターです。 すべての通貨ペアと時間枠で効果的に使用できます。 積極的なエントリーと慎重なエントリーの両方に対応しています。 移動平均、パラボリックSAR、色設定などをカスタマイズ可能です。
活用方法 一般的に、価格がインジケーターの傾きを上回り、HalfTrendが青に変わると買いの条件が整います。 価格ローソク足の下に青い上向き矢印が表示され、強気のシグナルを示します。ストップロスはインジケーターの下に
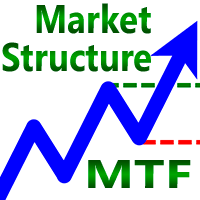
The Market Structure MTF indicator is a successful attempt to formalize the structure of price movement using a unique algorithm. It accurately decomposes any price movement into its constituent elements and allows you not to miss a single interesting entry or exit point. An important feature of the Market Structure MTF indicator is the visualization of the structure of price movement on two timeframes at once – on the current and on any older one at the user's choice. Despite the external sim

The Time End bar by MMD is a simple indicator that shows the number of seconds remaining in the three selected intervals. According to the MMD methodology, the moment when a directional price movement occurs is important. This indicator allows you to use this relationship more effectively in Forex and Futures trading.
Functionality description:
Time Frame 1 Period - defining the first time interval Time Frame 1 Color - specifying the color for the first time interval Time Frame 1 Period - def
FREE

Break Even Line by MMD
The Break Even line is a useful indicator for people using strategies that allow simultaneous trades in both directions, such as the MMD methodology. This indicator is useful when playing statistical models and averaging positions in accumulation and distribution zones. The indicator draws levels by summing positions in three groups: positions included in BUY, positions included in SELL and all positions included.
Functionality description:
Show BUY BELine - shows or
FREE
This is exactly what the name says. Visual strategy builder . One of a kind. Turn your trading strategies and ideas into Expert Advisors without writing single line of code. Generate mql source code files with a few clicks and get your fully functional Expert Advisors, which are ready for live execution, strategy tester and cloud optimization.
There are very few options for those who have no programming skills and can not create their trading solutions in the MQL language. Now, with Bots Builde

Analyzing multiple time frames of a currency pair in one window can make you confused. To analyze multiple time frames, you need reliable indicators. One of them is using 9TF RSI MA . I've been working day and night to create code that is simple but reliable and covers all nine time frames in just one indicator . Let's look at some of the advantages of this indicator: Colorful histogram . The color of the curve in each timeframe is different from one another. Arrows indicating the crossing of

All about Smart Money Concepts Strategy: Market struture: internal or swing BOS, CHoCH; Orderblock; Liquity equal; Fair Value Gap with Consequent encroachment, Balanced price range; Level with Previous month, week, day level or in day level (PMH, PWH, PDH, HOD); BuySell Stops Liquidity (BSL, SSL); Liquidity Void Long Wicks; Premium and Discount; Candle pattern ... "Smart Money Concepts" ( SMC ) is a fairly new yet widely used term amongst price action traders looking to more accurately navigate

The construction of a breakdown system includes the following steps: 1. Determination of the current volatility and the breakdown threshold. The current volatility, in this case, is defined as the difference between yesterday's daily high and the daily low. The breakdown threshold is set at 70-75% of this value. 2. Setting pending buy and sell orders. 3. Entering into a transaction, placing stop loss and take profit orders. Breakouts occur, as a rule, during periods of consolidation. As can be s

Индикатор строит блоки заказов (БЗ) по торговой системе (ТС) Романа. Поиск блоков осуществляется одновременно на двух таймфремах: текущем и старшем (определяемым в настройках). Для оптимизации и игнорирования устаревших блоков в настройках задается ограничение количества дней в пределах которых осуществляется поиск блоков. Блоки строятся по правилам ТС состоящем из трех шагов: какую свечу вынесли (что?); какой свечой вынесли (чем?); правило отрисовки (как?).
FREE

XA Risk Reward Ratio Tool MT4 tool is a professional algorithm, that calculates risk of every transaction before it is finalized. It allows you to precisely estimate gain and possible loss. The professional tool can estimate levels of Take Profit and Stop Loss incredibly precisely, making investments more effective and safer. Using Risk Reward Ratio Tool, you can with one click carry out transactions, cancel position, set position rate, set opening point, TP, SL and many other features. List of
FREE
Индикатор предназначен для разметки ,фибо уровней и фибо зон.Также есть возможность удаления и редактирования уровней на текущем графике. При установке нескольких индикаторов (FIBO-ZONES)на график,не забывайте менять имя в поле (NAME).В утилите также есть возможность менять цвет зон, толщину линий и стиль линий уровней фибо. При установке индикатора ,зоны выстраиваются автоматически.
FREE
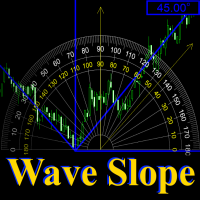
Wave Slope - works on the basis of the ZigZag indicator and is designed to measure the slope of the current wave, in degrees.
The sharper the angle of inclination, the stronger the trend. And on this you can build a trading system.
In the settings, you can connect the ZigZag indicator, set the color and width of the slope line.
And you can also turn on and off the sound signal, which is triggered in case of a change in the slope of the wave.

** Automatically Adds to your existing trades that you open ** KFX Dashboard EA monitors Price Action using Candle Direction + Moving Average on Multiple currency pairs (selected by you) and on Multiple Timeframes (selected by you). The dashboard also reveals Currency Strength of pairs based on your Moving Average selection. KFX Dashboard EA option to set Stop Loss(SL) and Take Profit(TP) based on your selected Timeframe and ATR / Points settings. Trailing stop by ATR / Points also available (s
Place the indicator on the chart, preferably with a timeframe of H1 or H4. If you are trading in the daily range or, conversely, on lower timeframes, you will need to adjust the RSI and ATR levels accordingly.
The blue arrows of the indicator will be a signal to open a long position, the red arrows will be a signal to open a short position:
1) Blue arrow for longs (growth) and red arrow for shorts (decline).
2) Two horizontal lines for current positions (one for entry and one for stop).
3
This indicator is very useful for those who trade with investor techniques. That's why I named it InvestorTool. Why investors? Isn't this a tool for trading? This indicator is basically to help investors to identify which pairs are very close to their All-Time-Low or All-Time-High. So that the investor will quickly spot which instruments are "relatively" at its low cost, and telling the minimum equity required.
If the pair is close to All-Time-Low then investor can put a buy position. When t
MetaTraderマーケットはMetaTraderプラットフォームのためのアプリを購入するための便利で安全な場所を提供します。エキスパートアドバイザーとインディケータをストラテジーテスターの中でテストするためにターミナルから無料のデモバージョンをダウンロードしてください。
パフォーマンスをモニターするためにいろいろなモードでアプリをテストし、MQL5.community支払いシステムを使ってお望みのプロダクトの支払いをしてください。
取引の機会を逃しています。
- 無料取引アプリ
- 8千を超えるシグナルをコピー
- 金融ニュースで金融マーケットを探索
新規登録
ログイン