MetaTrader 4용 새 Expert Advisor 및 지표 - 128

This is a trend scalping EA because it uses trend indicators like Bollinger Bands and Moving Average. Easy to use forex expert advisor designed for EURUSD H1 but fully capable of trading other forex pairs and other timeframes too. Features: 1. NO Grid 2. NO Martingale 3. Smart Lot Sizing 4. Auto Take Profit in Money 5. Auto Stop Out at % of Balance 6. Minimal Inputs 7. Can trade 100 USD Account too. 8. High Win Rate 9. Positive Equity Curve Account Requirements: *Broker - Any *Account type - He

WARNING: PRICE IS SUBJECT TO RISE AT ANY TIME. GET YOUR COPY TODAY TO AVOID MORE COST! Dear Traders I am so glad to introduce to you my other tool called the Forex Sniper Entries Indicator. This tool is designed to help serious traders and investors capture big moves in the currency price movements. The philosophy behind this tool is all about winning big and riding the price movement from its beginning until the maximum point. We want to capture those big moves in both down and up markets as mu

The technical indicator "Reversal patterns" is a mathematical interpretation of the classic reversal patterns: Pin Bar, Harami and Engulfing. That is, the "reversal bar", "Harami" and "Absorption". This indicator allows you to determine the moment of reversal of quotes based on market dynamics and the winner between the "bulls" and "bears".
The indicator displays the moment of reversal at the local highs and lows of the chart of any timeframe, which allows you to increase the accuracy of the s
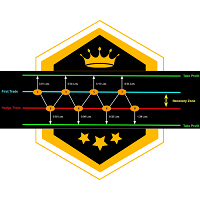
Hello; This EA uses the hedge system as an automatic trading strategy. It detects the time of high volatility and starts the system in a certain region. With the help of configurable variables, system security is taken under control with the help of optimization. GBPJPY M5 ready set file is gifted to those who buy the product. This set file has successfully completed the long-term optimization and walk forward tests in the relevant parity. You do not need to run optimization in the relevant par

Range Break Scalper is a forex robot designed to trade breakouts of predefined price ranges. The robot has several input parameters including Auto Lot Size, Max Auto Lots, Risk % of the account, Lot size, SL in range percentage, Target in range percentage, Allow Trailing stop, Trailing points, Range start time(Hours), Range start time(Minutes), Range duration(Hours), Range duration(Minutes), Range close time(Hours) and Range close time(Minutes). The Auto Lot Size parameter allows users to choose

"Price reversal arrows" Forex indicator, which shows price reversal points on an hourly chart (PERIOD_H1) with arrows, is one of the most popular tools for traders in the Forex market. This indicator is used to identify the most likely price reversal points, which can help traders make better trading decisions. The "Price reversal arrows" indicator works on the basis of various mathematical algorithms and formulas that analyze data on previous price movements in the market. At the same time, th

This EA run Only EURUSD at Timefram H1 Balance start 1000$ Indicator with ADX to be confirm trend and DX for Entry (New Calculate) MM with martingale system open not over 15 order and Can setting stop-loss begin set 30% Before run real you can optimise new every time with your balance your risk that you take risk. Inside have 3 EA with normal martingale Balance lot device and Fix Lot and last one have TP/SL Real account monitoring : Click Welcome to make cash flow everyday

Lemm is a scalper designed for intraday trading in M1 timeframe, therefore very fast and aggressive. It can be configured in a quieter version with higher timeframes or on different assets simultaneously using different magic numbers. The default configuration is for forex pairs, but by changing the parameters, it can be used on any pair (it has had excellent results on XauUsd and DjiUsd). It is equipped with a movable and minimized summary panel and push notifications on the smartphone.
Recom

The Multi Channel Trend indicator was developed to help you determine the trend direction by drawing channels on the graphical screen. It draws all channels that can be trending autonomously. It helps you determine the direction of your trend. This indicator makes it easy for you to implement your strategies. The indicator has Down trend lines and Up trend lines. You can determine the price direction according to the multiplicity of the trend lines. For example , if the Down trend lines start to

Advanced Wakarimasu is an expert advisor based on the RSI and ATR strategy combined with other indicators, forming very precise entries while making little use of martingale. General recommendations : M15 AUDCAD, AUDNZD, NZDCAD. It can also be used on other pairs, use lot sizes according to your account. Recommended to use 0.01 lot for every 5000 USD. Signal https://www.mql5.com/pt/signals/1840351?source=Site+Signals+My#!tab=account Backtest Youtube: https://www.youtube.com/watch?v=-rMWyHQo2K4

This outside bar indicator is the opposite of the inside bar. So what this MT4 outside bar indicator does is identifies outside bars for you as they form on your charts. Outside bar is a famous trading pattern in which the bar carry higher high and lower low compared with the previous bar, also known as mother bar. To trade based on Outside Bars, simply place buy stop order above the high price level of a bullish Outside Bar, and sell stop order should be placed below the low price level of a be
FREE

Panelux - информационная панель показывающая актуальную информацию для трейдера, такую как: Номер торгового аккаунта и торговое плечо; Символ, период, последнюю цену, время до закрытия бара и спред; Отдельный блок для мани менеджмента; Данные свопа инструмента; Блок информации о депозите, балансе, профите, позициях, equity и margin; Блок о прибылях и убытках за год, квартал, месяц, неделю и по последним пяти дням. Имеется опция для включения отображения совершенных сделок на графике цены. Что уд
FREE

This indicator shows both GMT time and your broker's time on the chart.
Simply attach the indicator to a chart, and you will see the GMT time and your broker's time displayed in the top left corner, as shown in the screenshot. By using this indicator, you can always stay informed about your broker's time, which is especially useful during daylight saving changes.
You won't have to worry about whether your broker follows the US or EU schedule, as the indicator automatically adjusts to reflect an
FREE

If you are boring in repeatedly changing of trading symbol in every charts when use multiple charts to analyzing prices or trading. This indicator can help you. It will change the symbol of any other charts in the terminal to the same as in the chart you have attached this indicator to it whenever you add new symbol to the chart or click on the button. After finished the job it will sleep quietly waiting for new occasion in order to minimize resource usage of the computor.
FREE

ProAlgo EA MT4 is a fully automatic professional trading software with several preconfigured trading strategies to choose from. This EA works like a manual trader and is designed for manual traders who have difficulty sticking to their trading strategy due to indiscipline.
There is no Holy Grail in trading. If you are looking for a foolproof trading system that never fails, you can give up trading, you will never be profitable. Believe me, I have tried everything and I have come to this fina

MT4 Discord Copier - the perfect tool for those looking to remotely copy trades between multiple MT4 accounts on different computers over the internet! With the added convenience of Discord transactions monitoring, you can now easily share trades with a global group of people on your own terms, all while benefiting from the features of a Discord server . This solution is ideal for both providers and receivers, as providers can effortlessly copy trades to multiple receivers, while re

Calculates correct lot-size by just 4 clicks. It is simple, quick and effective. This tool does everything for you. Set your risk percentage and tool settings to fit your needs. You will have one main button to show simple menu, where you can after clicking on "Calc" button (second click) set your Entry level (third click) and SL level (fourth click). Software will show you info box with all information needed - risk %, risk value, ticks distance and calculated position size. Of course, it draw

MT4 Discord Copier - the perfect tool for those looking to remotely copy trades between multiple MT4 accounts on different computers over the internet! With the added convenience of Discord transactions monitoring, you can now easily share trades with a global group of people on your own terms, all while benefiting from the features of a Discord server . This solution is ideal for both providers and receivers, as providers can effortlessly copy trades to multiple receivers, while receivers can
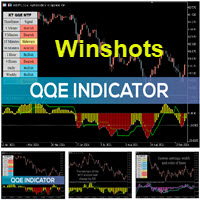
The Qualitative Quantitative Estimation (QQE) indicator is a technical analysis tool developed for the MetaTrader 4 (MT4) trading platform. It is designed to help traders identify potential trend reversals and to determine the strength of a current trend. The QQE indicator is calculated based on the Relative Strength Index (RSI) and Moving Average (MA) indicators. The RSI is used to determine the momentum of price movements, while the MA is used to smooth out the price data and identify trends.
This EA will set breakeven or breakeven-plus for your trades, whether you have manually or automatically set stop loss or not. If your broker charges commissions per trade, you need to set breakeven plus, not just breakeven, in order to cover up those charges and properly let your trades run at zero risk. Inputs:
In the inputs section , set BEPoffsetPips to 0, to use it as a "breakeven" EA. Or set BEPoffsetPips to any amount of pips you want, to use it as a "breakeven-plus" EA. "OnPr

This a high frequency scalper that takes advantage of every move in the market regardless the trend or any fundamentals. There is no single trend that can escape this. This EA puts an anchor to the market, enabling you to swing up and down without losing, only profit .
This EA is based only on GBP/JPY market, nothing else would work (currently), but I can study other markets later (or on-demand). Spread is mendatory to be from 0 until 0.2 pips max
You sould make sure there is no comissions ma

MoBOT EA using momentum breakout technic based on candle stick SNR area to enter the trade, it follow the trend with predefined filter value for best performance trading experience. Using default SL 50 pips and TP 100 pips, you can adjust this setting depend on your preferences.
This robot comes with feature : 1. Time Filter ( Server Time). 2. Martingale feature that you can swith on and off, you can adjust martingale multiplier and maximum lot for every trade. Default is OFF. 3. Advanced Trail
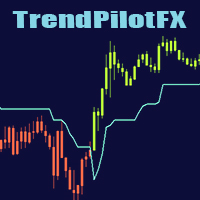
This Mql4 indicator smooths the trend by changing candle colors without altering their size, allowing for better price action reading. It also includes a trend line for trade entry and exit points. Smooth out market trends and improve your price action reading with this powerful Mql4 indicator. Unlike Heikin Ashi, this indicator changes candle colors without altering their size, providing you with a clearer picture of market movements. In addition, it includes a trend line that traders can rely

Features Ordering support tool using Fractals, Alligator, and HeikenAshi technical. Submit a stop order to the latest Fractals value emerging in the direction of Alligator's perfect order. Submit an additional stop order every time the Fractals price is updated. If Alligator's perfect order is canceled, cancel the placed stop loss order (leave only the contracted position). Filter entries by HeikenAshi (large), HeikenAshi (small) positive and negative lines. For filled positions, exit at any tim

The product Divergence Macd Obv Rvi Ao Rsi is designed to find the differences between indicators and price. It allows you to open orders or set trends using these differences. The indicator has 4 different divergence features. To View Our Other Products Go to the link: Other Products
Divergence types Class A Divergence Class B Divergence Class C Divergence Hidden Divergence
Product Features and Rec ommendations There are 5 indicators on the indicator Indicators = Macd Obv Rvi Ao Rsi 4 diffe

The "Lot Size" button toggles between fixed and auto lot size modes. Fixed mode uses a predetermined lot size, while auto mode calculates lot size based on a customizable percentage of the account balance, displayed at the bottom. The "Trailing Stop" button enables the activation or deactivation of the trailing stop feature. Initially set to "No Trailing," clicking the button changes it to "Trailing ON" when the trailing stop is active, and "Trailing OFF" when it is inactive. Below the button,

Customize your charts with this simple utility.
Choose in the 24 pre-built color sets, or use your own colors, save them to re-use them later.
You can also add a text label on your chart.
--- Chart Colors--
Color Set : 24 prebuilt color sets (select "Custom" to use colors below) Background color Foreground color Grid color Chart Up color Chart Down color Candle Bull color Candle Bear color Line color Volumes color --- Label--- Text Label : Type the text you want to appear on the chart Label P
FREE

PlaceGridTrades – Version 1.04
Welcome. Have you ever wanted an easy way to open 1, 2, 3, n trades in a grid fashion in one go, each with its own take profit, with a configurable distance been each trade? Did you ever want the flexibility to open either STOP or LIMIT trades? Did you even want an additional flexibility to open trades with a unique magic number and trade comment so that you can put all your trades into one unique basket? If you did then you have come to the right place. PlaceGri

This expert is based on bollinger bands indicator, Moving average trend indicator, SAR and Money flow index; very simple strategy. NOTE
****I developed it for the EURUSD pair and it works on 15M timeframe***** the code actually allows to apply to any timeframe and to any pair but I mainly studied the EURUSD, not caring about other options. settings default is as saved:
PercMaximumRisk : it calculates lots amount to trade for each order, risk % is over the account balance, default is 3, works fi

The Expert Advisor helps manage your account equity. You can set the EA to close all trades at the total account profit or buy/sell line profit or close at a certain predetermined loss percentage…
Parameters: Chart Symbol Selection: For Current Chart Only/ All Opened Orders Profit all to close all order USD (0 - not use): Profit in money Profit buy to close buy order USD (0 - not use): Profit in money Profit sell to close sell order USD (0 - not use): Profit in money Loss all to cl
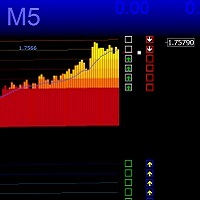
Канал TMA формирует расчёт зеркальным методом, что позволяет плавно компенсировать пробойные удары и точнее определять разворот, канал имеет дополнительную защиту от сужения, канал имеет ускоритель направляющей с заданными настройками, сигналы появляются на возврате направляющей линии, Версия MTF 2023 позволяет индивидуально настраивать канал на другие временные рамки и разные инструменты, возможны доработки, рекомендуется Gold M1 M5

This Indicator will notified you when time to entry into the market, build with double william percent range strategy. --> Buy Notification will flag with the blue arrow --> Sell Notification will flag with the red arrow After Flag Appear, the market usually explode but carefully you must performs double check because weakness of this indicator when in the end of the trend

This Indicator will notified you when market going to trend reversal, build with candlestick pattern strategy
--> Sell Reversal Notification will flag with the Yellow arrow
--> Buy Reversal Notification will flag with the Pink arrow
After Flag Appear, the market usually reverse but carefully you must performs double check because weakness of this indicator when market in the middle of the trend

MetaForecast는 가격 데이터의 조화를 기반으로 모든 시장의 미래를 예측하고 시각화합니다. 시장이 항상 예측 가능한 것은 아니지만 가격에 패턴이 있다면 MetaForecast는 가능한 정확하게 미래를 예측할 수 있습니다. 다른 유사한 제품과 비교했을 때, MetaForecast는 시장 동향을 분석하여 더 정확한 결과를 생성할 수 있습니다.
입력 매개변수 Past size (과거 크기) MetaForecast가 미래 예측을 생성하기 위한 모델을 만드는 데 사용하는 막대의 수를 지정합니다. 모델은 선택한 막대 위에 그려진 노란색 선으로 표시됩니다. Future size (미래 크기) 예측해야 할 미래 막대의 수를 지정합니다. 예측된 미래는 핑크색 선으로 표시되며 그 위에 파란색 회귀선이 그려집니다. Degree (차수) 이 입력은 MetaForecast가 시장에서 수행할 분석 수준을 결정합니다. Degree 설명 0 차수 0의 경우, "Past size" 입력에 모든 봉우리와
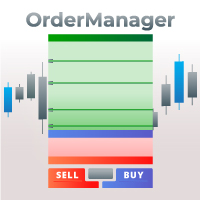
OrderManager 소개: MT4용 혁신적인 유틸리티 MetaTrader 4용 새로운 Order Manager 유틸리티를 통해 전문가처럼 거래를 관리하세요. 단순성과 사용 편의성을 염두에 두고 설계된 Order Manager는 각 거래와 관련된 위험을 쉽게 정의하고 시각화할 수 있습니다. 이를 통해 보다 효과적인 결정을 내리고 거래 전략을 최적화할 수 있습니다. OrderManager에 대한 자세한 정보는 매뉴얼을 참조하십시오. [ 매뉴얼 ] [ MT5 버전 ] [ 텔레그램 채널 ] New: [ Telegram To MT5 ]
주요 특징: 위험 관리: 거래의 위험을 빠르고 쉽게 정의하여 더 나은 결정을 내리고 거래 성능을 향상시킵니다. 시각적 표현: 열린 포지션을 명확하고 간결하게 이해하기 위해 거래와 관련된 위험을 그래픽으로 볼 수 있습니다. 주문 수정: 몇 번의 클릭만으로 주문을 쉽게 수정하거나 닫아, 거래 과정을 간소화하고 소중한 시간을 절약합니다. 손끝의 뉴스: 한 번
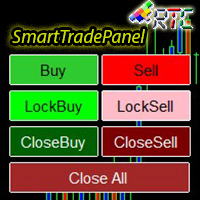
SmartTradePanel 은 트레이더가 주문을 빠르고 효율적으로 실행할 수 있게 해주는 트레이딩 도구입니다. 제공되는 고급 기능을 통해 SmartTradePanel은 거래자가 공개 주문을 관리하고 거래의 수익 잠재력을 최적화하는 데 실제로 도움이 됩니다. 이 기사에서는 SmartTradePanel의 기능과 이점에 대해 자세히 설명합니다.
SmartTradePanel의 주요 기능 중 하나는 공개 주문을 빠르게 실행하는 기능입니다. 몇 번의 클릭만으로 트레이더는 거래 포지션을 빠르고 효율적으로 열 수 있습니다. 이는 실행 속도가 수익 창출의 결정 요인이 될 수 있는 급변하는 시장 상황에서 특히 유용합니다.
그 외에도 SmartTradePanel을 통해 거래자는 잠금 주문을 할 수 있습니다. 잠금 주문은 포지션이 반전되어 미래에 이익을 창출할 것이라는 희망으로 손실 포지션을 잠그는 것을 목표로 하는 거래 전략입니다. SmartTradePanel을 사용하면 거래자는 몇 번의 클릭만
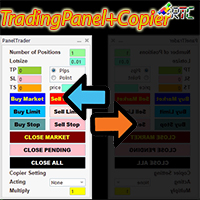
이 TradingPanel은 유사한 거래 패널에 비해 다음과 같은 많은 장점이 있습니다. 1. 즉시(시장) 주문을 열고 원하는 가격으로 대기 중입니다. 2. 핍 또는 포인트 모드에서 설정할 수 있는 TakeProfit(TP), StopLoss(SL) 및 TrailingStop(TS) 설정. 3. 시장가 주문만 청산하거나 보류 중인 주문만 청산하거나 시장 유형 및 보류 중인 모든 주문을 청산할 수 있습니다. 4. 마스터로 열린 주문을 클라이언트로 패널에 복사할 수 있는 CopyTrade도 장착되어 클라이언트에서 로트 스케일 값을 설정할 수 있습니다.
거래 활동을 용이하게 하려면 지금 이 TradingPanelPlusCopier를 사용하십시오.
TradingPanelPlusCopier 사용 방법 및 데모는 설명의 비디오 데모에서 볼 수 있습니다. 인사 이익!

Forex 시장에서 자동 거래에 대한 새로운 알고리즘 멀티 통화 어드바이저 Hewer를 소개합니다! 이 제품은 12년 간의 거래 시스템 개발 경험을 가진 프로그래머 팀의 최신 제품입니다. 하수의 기본 원칙은 로봇이 세 가지 이익 전략을 사용한다는 것입니다. 전략은 처음부터 다음 주문으로 주문 관리를 이전하여 위험을 최소화하고 안정적으로 수익을 창출하는 방식으로 일관되게 작동합니다. 1. 첫 번째와 주요 전략은, 이익을 고정, 다음 두 번째 전략의 관리 명령을 이전하는 주요 소득을 가져옵니다. 2. 두 번째 전략은 개별 저자의 아키텍처 "평균의 그리드"를 기반으로 작동하며, 조심스럽게 나머지 주문을 이윤으로 그립니다. 3. 두 번째 전략이 예정된 시간에 이익 주문을 생성하지 못하는 경우 세 번째 전략이 포함됩니다. 거래 계좌 및 예금 요건: 최소 최소 LOT 0.01 센트 계정에 $ 200 예금
최소 최소

LINEAR REGREESION INDICATOR ==> The indicator represents the Linear Regression Line and the Support and Resistance lines, obtained based on the standard deviation with respect to the Linear Regression. Customization: The following values can be adjusted: Rango Tendencia: The number of bars or periods, within the considered time frame, taken as a reference for the indicator. AmpDesv: The amplitude or number of times to consider the standard deviation of the linear regression for its representatio

인디케이터 구매자는 Fiter 인디케이터를 기반으로 한 EA를 보너스로 무료로 받을 수 있습니다. (EA가 작동하는 모습을 보려면 비디오를 시청하세요.) EA를 받으려면 댓글을 남겨주세요.
Fiter 는 ATR로 조정된 RSI 라인(노란색)을 포함하는 지수 이동 평균(EMA)과 전통적인 이동 평균(빨간색)을 결합한 하이브리드 인디케이터입니다. 이 두 라인의 교차는 두 개의 단순 이동 평균을 사용하는 고전적인 접근 방식보다 훨씬 부드럽고 신뢰할 수 있는 거래 신호를 생성합니다.
백테스트는 이 방법의 효과를 입증했으며, 단순 이동 평균 교차와 비교하여 우수한 성능을 보여줍니다. 과거 데이터를 보면 Fiter는 다양한 시장 상황에 잘 적응하며, 실제 수동 거래에서 주요 트렌드를 식별하는 데 유용한 도구임을 알 수 있습니다.
차이를 경험하려면 스크린샷을 확인하거나 전략 테스터에서 인디케이터를 실행해보세요.
거래 신호에 대한 알림 기능도 포함되어 있습니다.

MT5 버전 | FAQ | EA Universal Breakout Universal Box 는 차트에 가격대를 표시하여 나중에 가격대 돌파 시 거래에 사용할 수 있습니다. 이 지표를 적용할 수 있는 전략은 다양합니다. 이 인디케이터는 기본적으로 차트에 아시아, 유럽 및 미국 거래 세션 범위를 표시하도록 설정되어 있습니다. 범위는 직사각형으로 표시되며, 그 경계는 거래 세션의 시작 및 종료 시간과 해당 기간의 최대 및 최소 가격 수준입니다. Telegram 채팅: @it_trader_chat 새로운 Expert Advisor Prop Master - 트레이딩 터미널에서 테스트해보세요 https://www.mql5.com/ko/market/product/115375
인디케이터 설정은 매우 간단합니다.
Time Open - 거래 세션 시작 시간 Time Close - 거래 세션 종료 시간 Box color - 사각형의 색상 인디케이터에 4개의 가격 범위를 설정할

Automatic trading robot, created with the latest algorithmic trading and money management technologies. Combines three trading classes at the same time: Trending Hedging Multicurrency Your capital is protected by stop orders and management of the total trading position on the account. Works on any trading instruments. Note. Due to the peculiarities of the MT4 terminal, it is impossible to test multi-currency advisors in the tester. Only Real or Demo account. Loyal rental conditions and discount
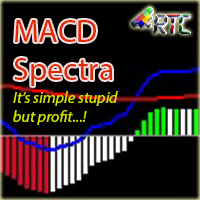
간단하지만 수익성 있는 트레이딩 인디케이터, MACD Spectra ! 이 지표는 모든 시간대와 모든 통화 쌍에서 사용할 수 있습니다. 정확도가 90% 이상인 이 지표는 거래 활동을 지원하는 최고의 지표를 찾고 있는 초심자와 전문 트레이더 모두에게 적합합니다. 히스토그램의 색상, 히스토그램의 위치, Signal 및 MACD 라인의 위치를 따라가기만 하면 쉽게 시장에 진입하고 빠져나갈 수 있습니다. 더 이상 미루지 마시고 꾸준한 수익을 MACD Spectral과 함께 하세요.
입장 및 퇴장을 위해 표시기를 읽는 것은 매우 쉽습니다.
파란색 선이 빨간색 선을 교차하고 교차점이 0선 아래에 있고 막대 2에 나타나는 히스토그램이 빨간색이면 WHITE 히스토그램이 나타날 때 SELL 진입 및 청산에 대한 강력한 신호입니다. 파란색 선이 빨간색 선을 교차하고 교차점이 0선 위에 있고 나타나는 히스토그램이 막대 2에 녹색이면 흰색 히스토그램이 나타날 때 매수 진입 및 퇴장에 대한 강력한 신

Clock GMT Live에는 중개인에 대해 더 많이 알아야 할 모든 것이 있습니다. 여러 번 귀하는 내가 있는 GMT 또는 내 중개인이 작업 중인 GMT를 궁금해할 것입니다. 이 도구를 사용하면 실시간으로 GMT와 브로커와 현지 시간의 시차, 브로커의 핑도 지속적으로 알 수 있습니다. 하루 중 시간에 배치하기만 하면 정보를 얻을 수 있습니다.
인수할 때마다 가격이 상승합니다. 이를 통해 소수만이 나만의 전략을 가질 수 있도록 보호하겠습니다. 내 다른 개발은 여기에서 볼 수 있습니다
정확한 타이밍은 거래에서 중요한 요소가 될 수 있습니다. 현재 런던 또는 뉴욕 증권 거래소가 이미 열려 있습니까, 아니면 아직 닫혀 있습니까? Forex 거래의 영업 시간은 언제 시작하고 끝납니까? 수동으로 거래하고 라이브로 거래하는 거래자에게 이것은 큰 문제가 아닙니다. 다양한 인터넷 도구, 금융 상품의 사양 및 시간 자체를 사용하여 자신의 전략으로 거래할 적기가 언제인지 빠르게 알 수 있습니다.
FREE

Welcome to our Price Wave Pattern MT4 --(ABCD Pattern)-- The ABCD pattern is a powerful and widely used trading pattern in the world of technical analysis.
It is a harmonic price pattern that traders use to identify potential buy and sell opportunities in the market.
With the ABCD pattern, traders can anticipate potential price movements and make informed decisions on when to enter and exit trades. EA Version : Price Wave EA MT4
MT5 version : Price Wave Pattern MT5
Features :
Automatic
FREE
【멀티 타임프레임 기관 Order Block – 깨끗하고 정확】
이 인디케이터는 최대 3개 타임프레임에서 자동으로 강세/약세 Order Block을 검출합니다. SMC/ICT 트레이더를 위해 설계되었으며, 리페인팅 없이 깔끔한 기관 수준의 OB 영역을 제공합니다. 시간 프레임 라벨 및 방향 화살표 포함.
사용법: 3개 시간 프레임 선택 (예: H4/H1/M15). 상위 OB 확인 → 가격 되돌림 대기 → 하위 프레임에서 진입 정교화 → SL은 OB 밖에 설정 → TP는 구조 또는 유동성 기반. 추천 세팅: XAUUSD (H4/H1/M15), EURUSD (H1/M30/M5), NAS100 (H4/H1/M30).
주요 기능: 자동 OB 검출, 멀티 타임프레임 스캔, 기관 시각화, 리페인트 없음, 정확한 구조 인식, OB 개수 조절 가능, 라벨/화살표 설정, 색상 사용자 지정.
FAQ: 리페인트 하나요? 아닙니다. 형성된 OB는 고정됩니다. 매수/매도 신호를 주나요? 아닙니다.
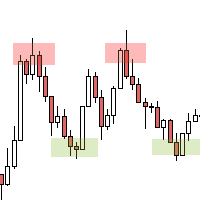
"Price Action Scalping EA" is a professional forex robot designed for strategic scalping trading on the XAUUSD currency pair on the M5 timeframe. Each trade of the robot is accompanied by a stop loss and a trailing stop, which increases the level of security when trading. The name "Price Action Scalping EA" corresponds to the high quality standards of the robot: accuracy, speed and trading efficiency. Price action is a technical analytics tactic based on the analysis of the previous price actio
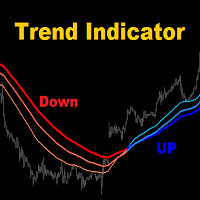
MA3 Trend - is the good trend indicator on three MAs. Benefits of the indicator: The indicator produces signals with high accuracy.
The confirmed signal of the indicator does not disappear and is not redrawn.
You can trade on the MetaTrader 4 trading platform of any broker.
You can trade any assets (currencies, metals, cryptocurrencies, stocks, indices etc.).
You can trade on any timeframes (M5-M15 scalping and day trading / M30-H1 medium-term trading / H4-D1 long-term trading). Individua
FREE

The USOpen breakout strategy is executed at 3pm (GMT+2) and is ideal for extremely short-term and short-term trading, as this is when liquidity and trading volumes for USD-related currency pairs are higher, and there are more trading opportunities in volatile markets.
Using proprietary algorithms to calculate momentum data for the current market conditions, Buy Stop and Sell Stop orders are placed at the high and low points of the range box. When a one-sided market triggers the order, the oppo

** All Symbols x All Timeframes scan just by pressing scanner button ** - Discount : it is not 50$, it is just 39$. *** Contact me to send you instruction and add you in "Head & Shoulders Scanner group" for sharing or seeing experiences with other users. Introduction: Head and Shoulders Pattern is a very repetitive common type of price reversal patterns. The pattern appears on all time frames and can be used by all types of traders and investors. The Head and Shoulders Scanner in
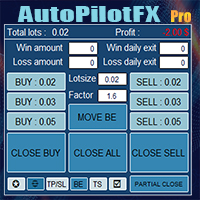
Introducing of AutoPilotFX Pro: Your Ultimate Trading Panel with Advanced Features of order management Take your trading to new heights with our Trade Assistant designed to streamline your trading process and optimize your strategies. Discover the powerful features it offers and learn how it can help you maximize your profits and minimize your risks.
Semi Automated EA for working as your trading assistant with Key Features: Automatic Lot Size Calculation: AutoPilotFX Pro automatically calc

Liberty is a very advanced, multicurrency EA which for now is perfectly capable of trading up to 9 different currency symbols: NZDJPY, EURNZD, GBPCHF, CHFJPY, EURCHF, GBPUSD, USDCAD, AUDUSD and NZDUSD. All of these symbols have been carefully chosen after months of months of back and forward testing. It is fully automated and once attached to NZDJPY H1 chart it can run on it's own. There is no need for additional set file because the default settings. Just like my previous EA - Big Bang - this o

V ery simple EA uses the famous trend scalping i.e. EMA Crossover scalping to open trades with martingale lot system. It includes 03 EMA i.e. Exponential Moving Averages to decide which direction to trade. It also checks distance of a fast moving average from the trend moving average. After all these conditions get fulfilled it opens a position. Single position at a time with hard stop loss and take profit.
Features: 1. Martingale 2. Uses trend indicators 3. Automatic Trading 4. Hard Stop Loss

MT5 Version Order Blocks ICT Kill Zones SMT Divergences ICT Breakers
The ICT Breakers indicator is a powerful tool for traders looking to gain an edge in the market. This indicator is based on the order flow and volume analysis, which allows traders to see the buying and selling pressure behind the price action. This information can be extremely valuable in identifying key levels of support and resistance, as well as potential turning points in the market. Breaker blocks are areas where in
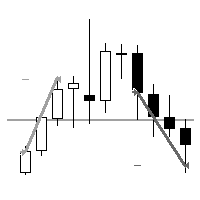
"AV Level EA" is an Expert Advisor for the MetaTrader 4, which is intended exclusively for the german DAX (DE40, GE40, etc.) and is also available as a free version with MinLot to try out.
NEW: More ways to close, third entry.
Strategy:
- Level Trading, DAX M15 (also M5 or M30)
- Entry: Buy level 75, sell level 25
- Exits: TP = 25 (i.e. approx. 00 level) or TP = 50 (buy 75 level, sell 25 level)
- Second entry in the event of a reset, distance e.g. 25 or 50 (it does not take place with 0)
FREE

Hello algo traders. The Expert Advisor trades on gold (XAUUSD), any timeframe (the same on any TF), the initial account balance is from $100.
The following presets are available "GS SL dynamic 001for100" . Each position has several closing logics, including a hidden StopLoss, which is calculated individually for each position, based on the volatility of the last hours. (If you have special stop requirements, then you can set your SL and TP in points via the parameters: "TakeProfit_Safety" and

10 COPIES AT $ 99 ! After that, the price will be raised to $ 150 .
MAPLEROO is a smart EA that uses technical and statistical analysis based on a deep and long study of this beautiful pair loved by many traders.
LIVE HERE --> MAPLEROO
Pair: AUDCAD
TimeFrame: M1.
Recommended Deposit for Safe Risk: 2000$.
For Moderate Risk: 1000$.
For High Risk (be careful!): Less than 1000$
FEATURES:
Solid backtest and proven live performance No need to adjust GMT Very easy to use: just read 3 lines of

TopBottomEA's advantage: the first support for small capital work EA, real trading for more than 4 years; this EA based on volatility adaptive mechanism, only one single at a time, each single with a stop-loss, an average of about 4 orders per day, holding a single length of 12 hours or so, with a limit of $ 20 principal challenge backtesting ran through more than 10 years. Every interval of three days to increase the price of $ 100, the price process: 998 --> 1098 --> 1198...... Up to the targ
Multi Chart Sync MT5 is a tool that synchronizes the chart symbol it is placed on to other charts, it can also be customized to exclude/skip some pairs from being synchronized to other charts, It also supports prefixes and suffixes that can be set from the input parameters for brokers with none-standard symbol formats, Synchronisation can be done once or continuously where if a synchronized chart symbol changes it will be reverted to the original/master symbol. This tool comes in handy for multi

This is a trade management EA that will close all your Open Orders (or both Open and Pending Orders) when your drawdown against balance exceeds a set percentage limit. E.g. Balance = $10,000 and “DrawdownPercent” is set at 2.0, if floating P&L is greater than -$200.00, all Orders will be closed.
It will send a notification to you MT4 app on your phone ( ”Drawdown Percent Close triggered!”) A text display is included for some visual feedback.
Basic notes: It only needs to be attached to one char
FREE

Here is the signal associated with the robot : https://www.mql5.com/en/signals/2114246?source=Site+Profile+Seller Have you ever dreamed of being able to trade in the financial markets without having to spend hours in front of your computer? We have the solution for you: our trading robot that automatically trades on AUDCAD, AUDNZD and NZDCAD pairs.
Thanks to our trading robot, you will finally be able to enjoy your days without having to worry about fluctuations in the financial markets. Our

Beta version of a semi-automatic utility for trading grid strategy. When using, please give feedback on the shortcomings / suggestions.
Good luck to us!
Parameters:
Lot exponent - multiplication of the lot on the next order. Grid pips - grid size. Take profit pip - distance of the take profit line. Magic number - the magic number of the adviser's work. Trading menu - presence/absence of a trading menu. Menu size - the size of the menu (choose the value for your resolution). Menu font size -

This indicator demonstrates that the price change of financial instruments is NOT a random walk process, as advocated by the "Random Walk Hypothesis", and as popularised by the bestselling book "A Random Walk Down Wall Street". I wish that were the case! It is shown here that the real situation with price change is actually much worse than a random walk process! Deceptive market psychology, and the bulls-bears tug of war, stack up the odds against traders in all instruments, and all time frame
FREE

The indicator is a 15-minute signal indicator for all types of traders. Meaning, you could make lots of profits trading two different signals in one indicator.
NOTE: Both indicators are channels for achieving the same result. RED ARROW -- Sell Signal BLUE ARROW -- Buy Signal
Purchase now to be part of our community. We offer standard chart setups for both novice and intermediate traders. Trade with ease!
FREE

MT5 version here: https://www.mql5.com/en/market/product/89113 Hello traders, I believe you all know that risk and money management along with psychology are the keys to success in trading. No matter how strong one’s strategy is, without these 3 criteria they will always face losses in the long run. I have created an EA to control our human behaviors. This EA will force us to be discipline exactly the way you will set. For examples, 1. If you set the maximum trades in a day = 3. You won’t be

The Gold market with a lot of volatility always brings many trading opportunities. We continuously research and develop unique trading strategies for Gold and synthesize them into EA Auto Gold Strategy. This is an automatic trading robot exclusively for the Gold market, it is programmed to integrate 3 trading strategies, each strategy is a different set of signal logic rules. You can experiment with strategies and choose your favorite in the settings panel. The EA has a simple and easy to use se
Check My Product
Contact me to discover all my services
Pivot indicator is a tool used by many traders. It can be used by beginners and experts alike and allows you to identify support and resistance levels. Pivot indicator is a widely used tool because over the years it has shown the validity of the levels it calculates and can be easily integrated into your trading strategy. Pivot levels can be used on different timeframes and based on the chosen time duration, calculate levels using daily
Sondra Grider Hedge - мультивалютная сеточная система с мартингейлом, автоматическим безубытком и трейлинг стопом. Советник достаточно установить на график любого финансового инструмента с параметрами по умолчанию.
Параметры
Lot фиксированный объем для торговли MagicNumber уникальное число для идентификации советником своих ордеров Komment комментарий к открываемым сделкам Минимальный стартовый депозит для торговли составляет 1000 usd. Прошлые прибыльные трейды советника не являются гарантие
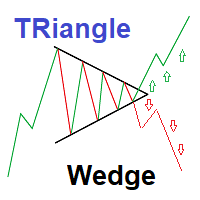
Strategy set to trade Triangle wedge break
This is a simple very effective strategy based on detecting and showing triangle wedges formation Strategy set to trade Triangle wedge break Red Arrows appears on crossing triangle down Green Arrows appears on crossing triangle Up You can also trade lower and upper triangle limit :(new version may be released to allow arrows for side ways trading) ---Sell on price declines from High triangle Level - Buy on increasing from Lower triangle level 2 input

Осциллятор Чайкина ( Chaikin Oscillator ) — это индикатор импульса, созданный Марком Чайкиным , и, очевидно, индикатор назван в честь своего создателя. Он измеряет импульс линии распределения и накопления, используя формулу схождения-расхождения скользящих средних (MACD). На основе данных об этом импульсе мы можем получить представление о направленных изменениях в линии распределения и накопления.
MetaTrader 플랫폼 어플리케이션 스토어에서 MetaTrader 마켓에서 트레이딩 로봇을 구매하는 방법에 대해 알아 보십시오.
MQL5.community 결제 시스템은 페이팔, 은행 카드 및 인기 결제 시스템을 통한 거래를 지원합니다. 더 나은 고객 경험을 위해 구입하시기 전에 거래 로봇을 테스트하시는 것을 권장합니다.
트레이딩 기회를 놓치고 있어요:
- 무료 트레이딩 앱
- 복사용 8,000 이상의 시그널
- 금융 시장 개척을 위한 경제 뉴스
등록
로그인
계정이 없으시면, 가입하십시오
MQL5.com 웹사이트에 로그인을 하기 위해 쿠키를 허용하십시오.
브라우저에서 필요한 설정을 활성화하시지 않으면, 로그인할 수 없습니다.