YouTubeにあるマーケットチュートリアルビデオをご覧ください
ロボットや指標を購入する
仮想ホスティングで
EAを実行
EAを実行
ロボットや指標を購入前にテストする
マーケットで収入を得る
販売のためにプロダクトをプレゼンテーションする方法
MetaTrader 4のための有料のテクニカル指標 - 50

SSA stands for ' Singular Spectrum Analysis '. It combines elements of classical time series decomposition, statistics, multivariate geometry, dynamical systems and signal processing. SSA decomposes time series into a sum of components (ETs), with each component representing a lower smoothing, using several SVD ( Singular Value Decompositions ).
It is a powerful filtering process used in many fields of research (climatology, biomedical, aerospace, etc), where high quality forecasting and smoo
Mars 10 is a Oscillators indicator is a powerful indicator of CHANGE DIRECCTION for any par and any timeframe. It doesn't requires any additional indicators for the trading setup.The indicator gives clear signals about opening and closing trades.This Indicator is a unique, high quality and affordable trading tool. Can be used in combination with other indicators
Perfect For New Traders And Expert Traders Low risk entries. Never repaints signal. Never backpaints signal. Never recalculat
Expert for trading with the BowTie strategy. Intelligent algorithm for scalper and intraday traders. Multi time frame and multi currency panel. The benefits you get: Easy-to-use panel that alerts you to crossings of moving averages, like strategy, on each currency. Possibility to choose your favorite crosses. Possibility to choose to activate only the preferred time frames. Never redesigns, does not retreat, never recalculates. Works on forex and CFD, timeframe from M5 to D1. Integrated pop-up

KT Asian Breakout indicator scans and analyzes a critical part of the Asian session to generate bi-directional buy and sell signals with the direction of a price breakout. A buy signal occurs when the price breaks above the session high, and a sell signal occurs when the price breaks below the session low. MT5 Version is available here https://www.mql5.com/en/market/product/41704
Things to remember
If the session box is vertically too wide, a new trade should be avoided as most of the price

3つの周期のCommodity Channel Index(CCI)から現在の騰落を判断し、色分けでパネル状に表示します。 3つの周期は、第1周期(最小周期)に対して乗ぜられる補正係数によって第2、第3が変更されます。 さらに、それぞれのCCIはATR(Average True Range)でバラツキを修正して表示されます。 3つのCCIのうち、2つが揃ったときにTrend_1、3つすべてが揃ったときにTrend_2を表示します。
//--- Bollinger Bandsのバンド幅が極端に狭くなったところでSqueezを表示します。 Bands周期及びBandsDeviation(偏差)、ならびにバンド幅の過去最大と過去最小に於ける許容偏差を調整することで、 Squeez強度の表示を変更できます。 //--- Up矢印およびDown矢印表示は、 Squeezが発生しているときには表示されません。 Squeez終了時点のTrend_1状況、Trend_2発生の状況に応じ表示されます。
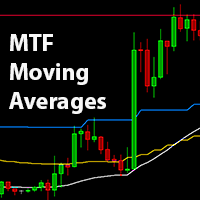
MTF Moving Averages is an useful indicator that brings you data from fully customizable higher timeframe Moving Averages on your charts, you can add multiple Moving Averages to use even more data of current market conditions. Check the indicator in action [Images below]
What MTF Moving Averages does apart from showing higher timeframe MA's?
Time saver , having all your higher timeframe MA's in just one chart, time is key, avoid switching between timeframes. Enter Trends precisely, easy to fol

This Momentum Seeker indicator is super simple! It is based in a few indicators to give you a quick entry to the Market. Once candle is closed and if parameters are all in place, an arrow is drawn in the chart, so there is no repainting! It works with any instrument! Risk management and trading skills are still needed! Inputs: Sensitivity: It is based in Periods, so the lower the number, more signals will come to screen but accuracy will decrease also. Recommended is 9 and above Audible_Alerts:

HEDGING MASTER line indicator It compares the power/strength lines of two user input symbols and create a SMOOTHED line that indicates the degree of deviation of the 2 symbols Strategy#1- FOLLOW THE INDICATOR THICK LINE when CROSSING O LEVEL DOWN --- TRADE ON INDICATOR THICK LINE (TREND FRIENDLY) !! Strategy#2- TRADE INDICATOR PEAKS (Follow indicator Reversal PEAKS Levels)!! you input - the index of calculation ( 10/20/30....) - the indicator Drawing start point (indicator hi
indicator for trading with the strategy with two moving averages. Intelligent algorithm for scalper and intraday traders. Multi time frame and multi currency panel. The benefits you get : Easy to use panel that alerts you to crossings of moving averages, as per strategy, on each currency. Possibility to choose your favorite crosses. Possibility to choose to activate only the preferred time frames. Never redesigns, does not retreat, never recalculates. Works on forex and CFD, timeframe from M

Infinity Oscillators Ultimate は 、RSI、ストキャスティクス、MACD、CCI、ボリューム戦略を利用するトレーダーの取引体験を向上させるために設計された包括的な OSCI-KIT です。包括的な機能を備えたこのインジケーターは、市場トレンドの分析、反転とリトレースメントの特定、ATR を使用した日中ターゲットの計算、および重要な取引イベントに関する情報の入手のための強力なツールセットを提供します。 このインジケーターの際立った機能の 1 つは、最も人気のある 5 つのオシレーターを 1 つのインジケーター ウィンドウに統合できることです。各オシレーターは個別の色で表されるため、トレーダーはトレンド、反転、リトレースメントを一目で簡単に識別できます。これらのオシレーターを組み合わせることで、Infinity Oscillators Ultimate は市場ダイナミクスの全体的なビューを提供し、トレーダーが情報に基づいた取引の決定を下せるようにします。 トレーダーが市場の動向を常に最新の状態に保てるように、インジケーターは高速で信頼性の高い通知システムを提
Welcome to my new indicator. It is a simple trend indicator, suitable for all instruments and timeframes. You should adjust it to your taste and you will know this product it's trustworthy. Trading skills and risk management, as usual are needed! There is not a perfect indicator in the market but you can find great helpers, and I think this is one of them. Inputs: SupRes_Interval Original setting is 5 and works very well with Indices. Lower numbers are more sensitive and suitable for scalpin

The Quadro Trend indicator works stably, correctly, and gives great flexibility when analyzing prices. There are many similar indicators, but Quadro Trend , unlike most of them , gives pretty good signals.
A great tool for working inside the day. On charts with a period of less than a day will help you see the daily candle in its usual form.
U-turn occurs when an arrow of the corresponding color appears. There is a parameter in the indicator to enable the supply of alerts when the color cha

All time zones. But I use it daily and 4 hours continuously. When trading in small time zones it is necessary to check the top time zones and especially 4 hours and logs. Red Arrow - SELL Green Arrow - BUY When the Green Arrow is lit while the Bar is Blue (Check the overall trend rise) - Buy When the Red Arrow is lit while the Bar is Red (Check general trend downtrend) - Sales NO RE-PAINTING GOOD TRADE
Monitoring of real trading on this system https://www.mql5.com/ru/signals/632726 Guru Pro Signal does not repaint! Guru Pro Signal is an original indicator, developed for the work of employees of one of the large funds! It is the best tool that can be added to your chart!
Guru Pro Signal signals about price reversal with the highest degree of accuracy, the best tool for both scalping and position trading. The entry signal is shown by the BUY and SELL arrows. It is possible to receive noti

KT MACD Divergence shows the regular and hidden divergences build between the price and oscillator. If your trading strategy anticipates the trend reversal, you can include the MACD regular divergence to speculate the potential turning points. And if your trading strategy based on the trend continuation, MACD hidden divergence would be a good fit.
Limitations of KT MACD Divergence
Using the macd divergence as a standalone entry signal can be a risky affair. Every divergence can't be interpr

it is an indicator for trading on the forex market and binary options, it is a trend tool with which you can take it most often when the first signal appears, open a trade in the indicated direction stop loss set above the arrow if the signal is lower or below the arrow if the buy signal when signals appear in the same direction where the transaction is open, you can enter into additional stop loss orders; we also set up trading without take profit; you need to close the transaction when a signa
TickChart Indicatorは、MetaTraderのメインウィンドウにティックチャートを表示します。
(無料のLite版、TickChart Indicator Liteでは、 表示するティック数を20に制限し、以下の説明にあるアラート機能を省いています。) ティックチャートは、市場の動きを最も詳細かつリアルタイムに示すティックラインを描画します。値が変わるたびに発生するティックの間隔は1分足のローソク幅より短いので、通常のチャート上には描けません。通常、数個のティック線分が、1分足のローソクが完成する間に発生しており、重要な指標の発表直後には、その数が100を超える事もあります。 このインディケーターは、ティックラインをメインウィンドウの通常のチャートの上に描きます。通常のチャートは、"時間-価格"空間に描きますが、ティックチャートは、"ティック-価格"空間に描かれます。すなわち、ティックチャートのX軸は時間ではなく、市場が活発だとX軸の進行は速く、閑散だと遅くなります。 TickChart indicatorは、いろいろな場面で役立ちます。例えば、 スキャルピングの道

Scalping Modulator is a scalping trading system. The indicator consists of several analytical modules. It automatically analyzes the market and shows the trader all the necessary information for trading. Scalping Modulator draws two trend lines on the chart. One line shows the long-term direction of the price, the second line shows the medium-term direction of the price. The indicator also draws red and blue dots on the chart. They indicate a likely change in price movement. In order to open a
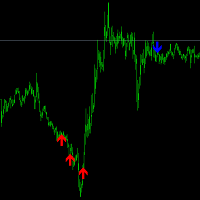
This index doesn't disappear, it doesn't get rewritten, the way it's calculated is to look for a trend shift, when the arrow comes up, there's a high probability that the trend will change. It is recommended to use a larger cycle, but you can also use the 5 minute cycle, the larger the cycle, the higher the winning rate. Indicators in the form of arrows, blue down arrow short, red up arrow do, in a large trend may appear in a continuous arrow, every arrow appears, is an opportunity to add positi
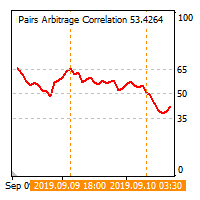
The cross-correlation indicator calculates the relationship between the specified pairs for the previous period. Automatically selects the instruments with the highest and the lowest correlation, and then simulates trading on the selected pairs on the same test period. Then indicator displays the pairs that have shown the best trading results. Visualizes the PAC (Pairs Arbitrage Correlation) criterion for the pairs selected by the trader. The signal to open trades is set by the PAC levels. When

The most handy indicator for searching classical and hidden divergences either between price chart and an oscillator-type indicator or between two oscillator-type indicators.
Just drop the indicator on the chart at which 1 or 2 oscillators are executed (see the video below).
The indicator doesn't require setting-up. You have just to choose the operation mode: to search divergences between price chart and an oscillator or between two oscillators..
Switch between classical and hidden divergen
Индикатор отображает 4 текущих уровня между, которыми находится цена. Уровни вычисляются на основе диапазона предыдущей недели. Количество и значение уровней произвольное и выражается в процентах . Положение уровней отсчитывается от минимума предыдущего дня (пример можно посмотреть в описании параметров). Целесообразно размещать уровни в строке настроек по порядку, тем не менее индикатор сам их отсортирует и если обнаружатся уровни отстоящие менее чем на 1% выдаст ошибку. Индикатор работает н
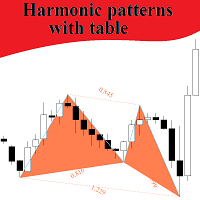
This indicator searches harmonic patterns on different TFs, and can track patterns in real time on all TFs for seted symbols. High and Low points for patterns defined by Bill Williams method, not by Zigzag or Fractals, it's more clear signals. Important input parameters: Where patterns search : "Current symbol" - searches patterns on the current symbol; "Seted symbols" - indicator creates table with seted symbols. Allowable percent of deviation : percent of deviation from perfect pattern Sym
Ни для кого не секрет, что для того чтобы, заработать на финансовых рынках необходимо движение цены инструмента. И чем движение сильнее тем больше возможностей предоставляется для торговли трейдеру. Для поиска сильных движений цены и был разработан PulseScanner. Панель предназначена для быстрого визуального нахождения и отображения сильных движений цены по всем периодам и на любых выбранных валютных парах одновременно. Индикатор имеет несколько режимов поиска и визуального отображения сигналов.
Mars 11 is a Trend indicator is a powerful indicator of FOLLOW DIRECCTION for any par and any timeframe. It doesn't requires any additional indicators for the trading setup.The indicator gives clear signals about opening and closing trades.This Indicator is a unique, high quality and affordable trading tool. Can be used in combination with other indicators Perfect For New Traders And Expert Traders Low risk entries. Never repaints signal. Never backpaints signal. Never recalculates signal.
Gladiator Signal indicator for binary options can be used in the forex market...
a signal appears when you open a new candle, we need to wait for it to close.. and at the time of opening a new one if the signal is to open a deal for one candle of the current timeframe works great on all time frames... in the settings you can enable turn off the alert and sound vision...

この指標により、価格がいずれかのレベルに達する可能性を判断できます。そのアルゴリズムは非常に単純で、特定の通貨ペアの価格レベルに関する統計データの使用に基づいています。収集された履歴データのおかげで、現在のバーの間に価格が変化する範囲を決定することが可能です。 そのシンプルさにもかかわらず、この指標は取引において非常に貴重な支援を提供できます。そのため、トレーディングポジションのTakeProfitレベルとStopLossレベルを決定することができます。保留中の注文の価格の決定と、TrailingStopの価格レベルの決定の両方に役立ちます。 さらに、この指標は既存の戦略に統合できます。たとえば、ある種の日中戦略を使用します。次に、D1時間枠でこのインジケーターを設定することで、新しいトレーディングポジションを開くことは既に望ましくないことを克服した後、レベルを取得できます。 このインディケーターの主な欠点は、純粋に履歴データに依存しており、特定の現在の市場の変化にまったく反応しないことです。 このインディケーターの設定は、入力パラメーター-L1 ... L4-を選択することにより実

DO NOT STOP OCCUPY THE POWER OF THE UNION OF VARIOUS TIME FRAMES. From now on you can see the RSI that you use for your trading analysis in a single window without having to be opening others to form very graphic and easy. Color settings Possibility of deactivating the timeframes you want. Up or down arrows in relation to the previous sail. We also have Multiframe MACD and Momentum version available. Visit My signals https://www.mql5.com/es/signals/620506

Комплексный индикатор который работает на основе 4-х стандартных индикаторов МТ4: Moving Average, Stochastic, Bollinger Bands, RSI (в дальнейшем список индикаторов будет расширятся). Показания индикаторов берутся из 7-и тайм фреймов от М1 до D1. Строка Average показывает средние значения индикаторов в разрезе тайм фреймов. Сигналы индикаторов: Moving Average: быстрая скользящая выше медленной скользящей - покупка; быстрая скользящая ниже медленной скользящей - продажа; данные берутся из последне
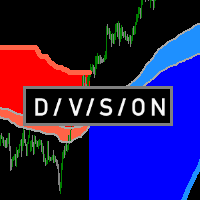
Определения текущей тенденции одна из самых важных задач трейдера не зависимо от стиля торговли. Индикатор Division поможет с достаточно высокой вероятностью это сделать. Division - индикатор распознавания тенденции, использующий в качестве источника данных подобие скользящих средних, в расчете которых используются объемы. От этих средних строятся границы, которые служат сигнализатором для смены текущей тенденции. Показания индикатора не изменяются не при каких условиях. При желании можно вкл

The Ceres Trend Indicator displays polynomial regression on history and in the current time.
In the indicator settings: module - degree of regression (1 - linear, 2 - parabolic, 3 - cubic, etc.) koeff is the standard deviation channel multiplier.
The main direction of application of this indicator is the ability to determine the likelihood of further growth. If there is an intersection of the linear regression line from below, then this indicates a trend inhibition and a possible reversal.

The OMEGA PIP is a unique revolutionary semi -automated software which change the game entirely to your favor.This product developed from years of research in the FX Market is embedded with complex algorithms which filters off false signals, generating only accurate valid signals which is immediately printed on your chart , thus it guarantees profit anytime its installed on your computer. Due to this significant feat, the daunting and the strenuous effort a traders goes through during

Are you a trend trader tired of noise, spikes and whipsaws? The Royal Ace Signal Bar indicator tracks the market trend with an unmatched reliability, by ignoring sudden fluctuations and market noise around the mean price. It allows you to be steady when everyone else is shaky. Amazingly easy to trade The indicator needs no optimization at all It implements a multi-timeframe dashboard The indicator is non-repainting
Anatomy of the Indicator The Royal Ace Signal Bar indicator displays a co

Royal Ace Signal 3 MA The Royal Ace Signal 3 MA indicator tracks the market trend with combine 3 MA. Amazingly easy to trade The indicator needs no optimization at all It implements a multi-timeframe dashboard The indicator is non-repainting
Anatomy of the Indicator The Royal Ace Signal 3 MA indicator displays a colored arrow. If the arrow is gold you should be looking for long trades, and if the arrow is red, you should be looking for short trades. Use this indicator in H1, H4 timeframe
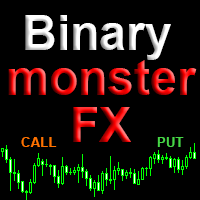
Binary Monster FX is a ready-made trading system. The real-time indicator displays the profitability of its strategy on history. This allows you to choose the most profitable currency pair and evaluate the profitability immediately, even before the start of real trading. Features Ready trading system Displays Binary Monster FX strategy trading statistics for a given number of bars of historical data. Gives a visual and audible warning when a CALL or PUT signal appears. Warns before a signal abou

A trend indicator, the main direction of which is to display the possible direction of price movement. The price reversal occurs with the same patterns on the indicators. The indicator shows the possible direction of price movement. Signals are generated on the previous bar. Red Coogie - the signal is considered unconfirmed. The indicator works best on timeframes H1, H4 and D1.
This is one of the few indicators that can signal strength and direction, which makes it a very valuable tool for tr
DPOMASimple (DetrendPrice Oscillator) is an indicator that removes the price trend, in order to observe the cyclical movements of the price without the noise of the trend, the DPOMASimple indicator can be used to determine support and resistance levels in the peaks and valleys or as trading signal whe cross 0 level.
DPOMASimple > 0 -> Buy. DPOMASimple < 0 -> Sell.
Markets in range: Maximum and minimum will be the same as in the past. Set the overbought and oversold levels ba

Introducing the trend indicator! Ready trading system. The principle of the indicator is to automatically determine the current state of the market when placed on a chart. The indicator analyzes market dynamics for pivot points. Shows the favorable moments of entering the market with stripes. Can be used as a channel indicator or level indicator! This indicator allows you to analyze historical data, and on their basis display instructions to the trader on further actions. To find out how to dete
This indicator is based on the standard MACD indicator, but showing the changes up and down colored. It is a nice assistance to visualize our Expert MAGIC MACD.
MAGIC MACD MT4: https://www.mql5.com/en/accounting/buy/market/41144?period=0 MAGIC MACD MT5: https://www.mql5.com/en/accounting/buy/market/41151?period=0
Inputs in the Indicator: Fast EMA: standard is 12 Slow EMA: standard is 26 Signal: depending on what you want to see. For the MAGIC MACD the standard is 1
in common settings: Fixe

The indicator monitors the market trend with very high reliability. Sharp price fluctuations, as well as noise around averaged prices, are ignored. All intersection points will be ideal points at which the direction of the trend changes. Signal points, places where color changes, can be used as points of potential market reversal. This development can be used both for long-term trading, and for piping on small periods. The indiuctor algorithm implements a kind of technical analysis based on the

This Indicator calculates based on the Stochastic, Fractal and ZigZag the best possible entries in all timeframes.
Input Stochastic Oscillator K line period = standard is set to 10
D line period = standard is set to 3 slowing = standard is set to 4 Method = stadard is set to Linear weighted Price value = standard is set to close/close
ZigZig settings Depth = standard is set to 24 Deviation = standard is set to 5 Backstep = standard is set to 3 Bar filter = staard is set to 35
Alarm set

This indicator will provide you with everything you need in order to overcome losses due to human emotions. The indicator determines the moments of a trend reversal and the direction of its movements. This development is equipped with the most modern, adaptable trading algorithms. The main secret of short-term trading is to have information on when to enter a deal. The indicator works great on all timeframes and informs the trader about the most successful moments of buying or selling a currency
It can be used as an independent trading system. It is based on the idea that some currency pairs follow one another. The indicator allows you to simultaneously display several other charts on the chart of one currency pair, which allows you to anticipate some movements and fairly accurately determine the beginning of trends. The principle of trading according to indicator signals is also simple: you need to sell a currency pair whose chart is higher, and buy the lower one.

This indicator gives signals about a trend change, shows successful signals. High probability of a successful trend, it can be used with an optimal risk to profit ratio. The indicator does not redraw and is not late; it can be used both for piping on small periods and for long-term trading. The indicator algorithm works using open prices, and you can work with a zero bar. It works on all currency pairs and on all timeframes.
This is the FXTraderariel ATM Indicator - the best trend indicator we ever created. It shows different trend perfect and supereasy to Spot. Depending on the settings and trading style, it can be used for scalping or long-term trading . The indicator can be used on every time frame , but we advise to use it on , H4 and D1 . Especially if you are a novice trader. Pro Traders can also you use it for scalping in smaller timeframes (M1, M5 and M15). This indicator is not a complete trading s

Automatic marking of the chart with Pentagram models. This model is based on the Expansion Model from Adversa Tactics. Designed to determine the trend and predict possible levels and targets of price correction in the future. The model describes a developing trend. The trend is relevant until the price crosses the trend line of the model in the opposite direction. Levels of rays of the pentagram, level of HP, distances of 100% and 200% of the distance between points 1-4, levels of HP are possibl

This indicator will provide you with everything you need in order to overcome losses due to human emotions. The indicator determines the moments of a trend reversal and the direction of its movements. This development is equipped with the most modern, adaptable trading algorithms. The main secret of short-term trading is to have information on when to enter a deal. The indicator works great on all timeframes and informs the trader about the most successful moments of buying or selling a currency
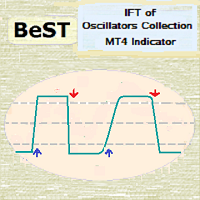
BeST_IFT of Oscillators Collection is a Composite MT4 Indicator that is based on the IFT (Inverse Fisher Transformation) applied to RSI , CCI , Stochastic and DeMarker Oscillators in order to find the best Entry and Exit points while using these Oscillators in our trading. The IFT was first used by John Ehlers to help clearly define the trigger points while using for this any common Oscillator ( TASC – May 2004 ). All Buy and Sell Signal s are derived by the Indicator’s crossings of the Buy or

The indicator ignores sharp fluctuations and market noise and tracks market trends with absolute reliability. It is suitable for trading on small timeframes and on large ones, it ignores sudden price spikes or price movement corrections due to the reduction of market noise around the average price value. For calculations, the indicator uses indicators: iLow, iHigh, iMA, iATR. Since the output signal relies on reliable indicators, it is also reliable. You can configure both a sound signal and se

Recently released !!!! Amazing !!!!! Free indicators for you !!!!!! Win operations with the power of the Macd multi timeframe indicator in a single window. Ideally you can complement it with our Rsi Multiframe to get powerful trades. . Give me 5 stars please Look at our signals made with our indicators. Very profitables - Soon Momentum Multi time frame !!!
https://www.mql5.com/es/signals/620506

持続可能な分布は、金融シリーズをスムーズにするために使用できます。かなり深い履歴を使用して分布パラメーターを計算できるため、場合によっては、このような平滑化は他の方法と比較してさらに効果的です。
図は、10年間のH1時間枠でのEUR-USD通貨ペアの始値の分布の例を示しています(図1)。魅力的ですね。
この指標の根底にある主な考え方は、価格の分散によって持続可能な分布のパラメーターを決定し、データを使用して金融シリーズを平滑化することです。このアプローチのおかげで、平滑化された値は、特定の市場状況で最も可能性の高い価格値になる傾向があります。
インジケータの動作は、パラメータLBを使用して設定されます。その値は、バーで表される平滑化されたシリーズの長さを決定します。また、許容値は1〜255の範囲です。
青い線は平滑化された高値を示し、赤線は安値を示し、緑の線は終値を示します。
このインジケーターの主な欠点は、インジケーターが履歴のすべての部分で等しく安定するように、スムージングウィンドウの幅を設定できないことです。したがって、トレーダーは特定の要件に合わせてパラメ

インジケータMTFクリスタリウム矢印は、半自動取引システムであります. これは、すべての通貨ペアで動作します。
インジケータは、三つのルールを使用しています:1)我々は唯一のトレンドで取引、2)"誰もが販売しているときに購入し、誰もが買うときに販売する"、3)価格
インジケータMTF矢印は、内蔵の指標を使用して、複数の時間枠全体のクリスタリウムフィルタルール。 トレンドは、選択した時間間隔で一致した場合、インジケータは、市場に参入するための矢印を与えます。 それからあなた自身の決定をする。 購入する-緑の矢印、売る-赤い矢印。 指標では、ロットを変更したり、EAの取引時間とシャットダウン時間を設定することができます。 また、作業期間と時間フィルタを変更することができます。 ビープ音が鳴ってる
推薦された働く期間D1。 フィルタH1とH4。
設定:
TF働く期間(推薦されたD1) Cci_cperiodcomment
CCIレベルアップ
CCIレベルDn CCI価格 SARステップ SAR最大値 TFのFilter1–(推薦されたH1

One of the disadvantages of the ZigZag indicator when working with advisers is the need to find the latest extremes. For this purpose, various algorithms of history analysis in indicator buffers are used. However, the indicator itself knows these values and can therefore display them. To this target, the ZigZag Minimum indicator ( https://www.mql5.com/ru/market/product/37975 ) has been refined. The zero buffer stores the value of the last maximum. The first buffer stores the value of the last m
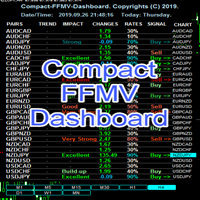
Compact FFMV Dashboard Compact FFMV Dashboard is a little trimmed custom indicator of FULL FOREX MARKET-VIEW DASHBOARD created to give the Traders a full view of what is going on in the market. It uses a real time data to access the market and display every bit of information needed to make a successful trading. It shows as many as 30 currency pairs or as allowed to display in the Market Watch of your MT4 USAGE: For Solo Trading For Basket Trading (See the screenshot on how) For Signal confirmat

Moonwalker MT4インジケーターは、高度なアルゴリズムを使用して市場のトレンドを追跡し、急な変動や市場のノイズをフィルタリングし、独自の信頼性を提供する強力なツールです。これにより、市場を常に監視するストレスなしに、簡単かつ自信を持って取引できます。 Moonwalkerは再描画されず、サウンドアラートとプッシュ通知が付属しています。 取引を次のレベルに引き上げたい場合、WhoopeeEAはMoonwalkerインジケーターとシームレスに連携する素晴らしいオプションです。興味があれば、WhoopeeEAの情報をリクエストに応じて共有できます。 ただし、私の言葉だけを信じないでください - Moonwalkerの動作を確認するために説明ビデオをチェックし、今日トレンドトレードの革命に参加してみてください!

私たちの目標は、アクセス可能で質の高いサービスを提供し、市場参加者、トレーダー、アナリストに、情報に基づいたタイムリーな取引決定のための非常に必要なツールを提供することです。
最も最適化された、非常に堅牢で使いやすいDYJトレンドアナリストインジケーター。
DYJトレンドアナリストは、方向性圧力のタイプごとに1つずつ、2つの別々の測定値を使用して、市場の強気と弱気の力を測定しようとします。
指標のBearsIndexは、低価格に対する市場の欲求を測定しようとします。
指標のBullsIndexは、より高い価格に対する市場の欲求を測定しようとします。
DYJトレンドアナリスト向けのピボットポイント追加インジケーター。
当社のピボットポイントインジケーターは、ピボットポイントとサポートおよびレジスタンスレベルを計算する高度なアルゴリズムに基づいています。
将来の重要な価格レベルと起こりうる市場の逆転の信じられないほど正確な予測。
すべての市場(外国為替、商品、株式、指数など)と時間枠に役立ちます。
特徴
すべてのペアを同時に監視します。 インジケー

G99 GRAVITY
G99 Gravity is a channel indicator for the MetaTrader 4 terminal. This indicator allows finding the most probable trend reversal points. Unlike most channel indicators, G99 Gravity does not redraw. Attach the indicator to a chart, and the alert will trigger once a signal emerges. With our alerting system, you will never miss a single position opening signal! Advantages of the indicator Perfect for scalping. Excellent for identifying trend reversals. Suitable for beginners and expe

取引を決定する際には、履歴データだけでなく、現在の市場状況にも依存することが有用です。市場の動きの現在の傾向をより便利に監視するために、AIS Current Price Filterインジケーターを使用できます。 この指標は、ある方向または別の方向で最も重要な価格の変化のみを考慮します。これにより、近い将来の短期的な傾向を予測することが可能です。現在の市場状況がどのように発展したとしても、遅かれ早かれ現在の価格はこの指標を超えます。トレーダーの観点から最も興味深いのは、価格がインディケーターレベルから可能な限り移動した状況です。これらの瞬間は、新しい取引ポジションを開くために最も最適であることが判明する可能性があります。 インジケーターの動作は、選択した時間枠に依存せず、2つのパラメーターを使用して構成されます。 FS -感度のしきい値を設定できるパラメーター。値が大きいほど、価格の動きは強くなり、インディケータで考慮されます。その許容値は0から255の範囲にあります。ゼロの値が選択された場合、感度のしきい値は現在の広がりに等しくなります。 LB -インジケーターの計算に使用される

«SMART EXIT» - уникальный индикатор высокой точности, созданный для профессиональной торговли на рынке Forex. Индикатор может работать на более чем 20 валютных парах и обеспечивает до 85% успешных сделок ежедневно. В среднем около 30 точных сигналов в неделю, никаких перерисовок или запаздываний. В своей стратегии индикатор использует лучший профессиональный алгоритм с уникальной логикой, который является эксклюзивной авторской разработкой среди всех существующих алгоритмов. Это торговая методик

Trading system for scalping. The indicator shows the direction of the price, the amplitude (channel) of its movement and the pivot point. The system automatically analyzes the market using the tick volume averaging algorithm for a certain period of time. After that, Scalper Thunder compares the data with other analysis indicators to identify potential pivot points. As soon as such a point is found, the indicator shows the price reversal and its current direction on the chart. The essence of trad

This is a convenient tool if you are used to trading on a clean chart, but sometimes you need to look at this indicator. If you are not sure how to determine the inflection point of a trend and are concerned about how to draw trend lines, then this indicator is for you. From now on, you do not need to sit near the computer and analyze the price, use this indicator carefully.
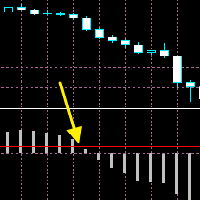
The moment when the MACD line crosses the signal line often leads to a significant price movement and trend changes. MACD Cross Prediction is an indicator that uses OSMA(MACD oscillator) and a red line. You can change the level of the red line on the indicator setting popup(and the red line moves up and down). The alerts(email, mobile push, sound, MT5 alert) will be sent when the MACD histogram touches the red line, which means the alerts can be sent just before/around the time when the MACD lin

This is a multicurrency and multitimeframe indicator that calculates the angle between two points. Points for measuring the angle can be taken from the ZigZag (the last two points), or from the Moving Average (between two given bars), or it can be the closing prices of bars.
Angle measurement is possible in degrees or in radians. You can select the scale for the calculation. For a better understanding of the indicator, you can study the free Angle High Low indicator. In the parameters you can

KT CCI Divergence shows the regular and hidden divergence created between the price and CCI oscillator. Divergence is one of the vital signals that depicts the upcoming price reversal in the market. Manually spotting the divergence between price and CCI can be a hectic and ambiguous task.
Limitations of KT CCI Divergence
Using the CCI divergence as a standalone entry signal can be risky. Every divergence can't be interpreted as a strong reversal signal. For better results, try to combine it
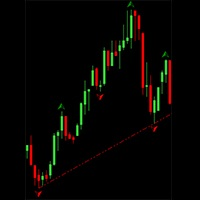
Классический фрактал отличается от остальных тем, что в бычьем фрактале экстремумы предыдущих баров последовательно растут, а экстремумы следующих баров последовательно снижаются. В медвежьем фрактале экстремумы предыдущих баров последовательно снижаются, а экстремумы следующих баров последовательно растут. На основании этих фракталов строятся трендовые линии, где сплошная линия является новой трендовой линией, а пунктирная, "пробитой" трендовой линией.
Параметры: История - Количество баров в
Not a logical continuation of the ZigZag indicator series is an indicator cut to an absolute minimum.
An important property of this indicator is that it will never redraw the value of a completed bar.
Based on previous indicator algorithms, e.g. ( https://www.mql5.com/ru/market/product/37975 ). Parameters: Depth - is depth of search of a local extremum in bars; On minute calc - is switching ON/OFF of calculation on minute bar (it is switched off - calculation on each tic).

This is a hybrid trend indicator, as it is based on the signals of elementary indicators and a special algorithm for analysis. The smart algorithm of the indicator determines the trend, filters out market noise and generates input signals. The indicator uses a color alarm: blue - when changing from descending to ascending, and red - on the contrary, to descending. You can use the indicator as the main indicator for determining the trend. The indicator can work both for entry points and as a filt

人気のボリンジャー バンド ブレイクアウト戦略を強化するために設計された強力なテクニカル指標であるボリンジャー バンド ボリューム ブレイクアウト ディテクターを紹介します。このインジケーターは、出来高データを組み込むことでトレンドフォローを次のレベルに引き上げ、誤ったシグナルを効果的に最小限に抑えます。このツールは「出来高が価格を確認する」という原則に従うことで、トレーダーが出来高の大幅な増加を伴う価格のブレイクアウトを特定し、より正確な取引決定を保証します。このインジケーターのカスタマイズ可能性により、トレーダーは出来高データを活用して独自の戦略を微調整することができます。 このインジケーターの重要な機能の 1 つは、完全にカスタマイズ可能なボリンジャー バンドであり、個人の好みに合わせて調整できます。さらに、出来高データの統合は、移動平均 (MA) との色分けされた比較を通じて視覚的に表現され、22 日平均との関係で出来高のブレイクアウトを簡単に識別できます。トレーダーは、モバイルアラート、ポップアップメッセージ、および電子メールアラートを介して通知を受信し、22 日平均を上回る
True Pattern - индикатор автоматически ищет и анализирует фигуры технического анализа на графике такие как Флаг, Вымпел, Клин, Двойная вершина/дно. Отображает фигуру паттерном 1-2-3 и показывает потенциальные цели. Данный индикатор является хорошим помощником для торговли как новичку так и профессионалу. Помогает анализировать рынок, благодаря данному индикатору проще находить фигуры на графике. Определение момента входа и выхода производится самим трейдером, индикатор в данном вопросе может пр

KT Heiken Ashi Smoothed is a smoothed version of the standard Heiken Ashi. Moreover, it also plots buy/sell arrows on a trend change. A buy arrow is plotted when it change to a bullish state from bearish state. A sell arrow is plotted when it change to a bearish state from bullish state. Mobile notifications, Email, Sound and Pop-up alerts included.
What exactly is Heiken Ashi Smoothed? It filters out the false signals and noise in the standard Heiken Ashi. It applies the set of two moving a
MetaTraderマーケットは、履歴データを使ったテストと最適化のための無料のデモ自動売買ロボットをダウンロードできる唯一のストアです。
アプリ概要と他のカスタマーからのレビューをご覧になり、ターミナルにダウンロードし、購入する前に自動売買ロボットをテストしてください。完全に無料でアプリをテストできるのはMetaTraderマーケットだけです。
取引の機会を逃しています。
- 無料取引アプリ
- 8千を超えるシグナルをコピー
- 金融ニュースで金融マーケットを探索
新規登録
ログイン