MQL5による株式発振器とは
皆さん、こんにちは。
Equityオシレーターを添付するチャートの下に構築する問題で1日悩んでいます(ちなみにTesterのチャートは他の方も書かれているように、相場変動との比較のしやすさというメインが欠けているためです)。
この問題は、私が理解するところでは、2つの側面があります。
一方では、オシレータのOnCalculateメソッドで各バーのEquity AccountInfoDouble(ACCOUNT_EQUITY)を決定するメソッドが動作しない。
一方、AccountInfoDouble(ACCOUNT_EQUITY)メソッドが動作するExpert AdvisorのOnTickコードからオシレータチャート(というかそのデータバッファ)を変更できるかどうかは難しいところです。
以下は、シンプルな割に結果が出ないオシレータのコードである。
直感的に、この問題を単純な方法で解決しなければならないことは理解できるのですが、その方法がわかりません。
このテーマについて、どなたかアイデアをお持ちではないでしょうか?
AccountInfoDouble(ACCOUNT_EQUITY); 現在の持分の状態を返し、履歴はない。この例では、インジケーターバッファーのすべてのセルに同じ値が書き込まれます。以下は株式指標の例ですが、チャート上で起動した時点からしか機能しません。
//+------------------------------------------------------------------+
//|                                                       Equity.mq5 |
//|                                                    Сергей Грицай |
//|                                               sergey1294@list.ru |
//+------------------------------------------------------------------+
#property copyright "Сергей Грицай"
#property link      "sergey1294@list.ru"
#property version   "1.00"
#property indicator_separate_window
#property indicator_buffers 4
#property indicator_plots   1
//--- plot Label1
#property indicator_label1  "Label1"
#property indicator_type1   DRAW_CANDLES
#property indicator_color1  MediumAquamarine
#property indicator_style1  STYLE_SOLID
#property indicator_width1  1

double         Label1Buffer1[];
double         Label1Buffer2[];
double         Label1Buffer3[];
double         Label1Buffer4[];

//+------------------------------------------------------------------+
//| Custom indicator initialization function                         |
//+------------------------------------------------------------------+
int OnInit()
  {
//--- indicator buffers mapping
   SetIndexBuffer(0,Label1Buffer1,INDICATOR_DATA);
   SetIndexBuffer(1,Label1Buffer2,INDICATOR_DATA);
   SetIndexBuffer(2,Label1Buffer3,INDICATOR_DATA);
   SetIndexBuffer(3,Label1Buffer4,INDICATOR_DATA);

   ArraySetAsSeries(Label1Buffer1,true);
   ArraySetAsSeries(Label1Buffer2,true);
   ArraySetAsSeries(Label1Buffer3,true);
   ArraySetAsSeries(Label1Buffer4,true);

   ArrayInitialize(Label1Buffer1,0.0);
   ArrayInitialize(Label1Buffer2,0.0);
   ArrayInitialize(Label1Buffer3,0.0);
   ArrayInitialize(Label1Buffer4,0.0);
//---
   return(0);
  }
//+------------------------------------------------------------------+
//| Custom indicator iteration function                              |
//+------------------------------------------------------------------+
int OnCalculate(const int rates_total,
                const int prev_calculated,
                const datetime &time[],
                const double &open[],
                const double &high[],
                const double &low[],
                const double &close[],
                const long &tick_volume[],
                const long &volume[],
                const int &spread[])
  {
//---
   Label1Buffer1[0]= AccountInfoDouble(ACCOUNT_EQUITY);
   Label1Buffer2[0]= AccountInfoDouble(ACCOUNT_EQUITY);
   Label1Buffer3[0]= AccountInfoDouble(ACCOUNT_EQUITY);
   Label1Buffer4[0]= AccountInfoDouble(ACCOUNT_EQUITY);
//--- return value of prev_calculated for next call
   return(rates_total);
  }
//+------------------------------------------------------------------+
インジケータを少し修正し、より良くなりました。
#property indicator_separate_window
#property indicator_buffers 4
#property indicator_plots   1
//--- plot Label1
#property indicator_label1  "Label1"
#property indicator_type1   DRAW_CANDLES
#property indicator_color1  MediumAquamarine
#property indicator_style1  STYLE_SOLID
#property indicator_width1  1

double         Label1Buffer1[];
double         Label1Buffer2[];
double         Label1Buffer3[];
double         Label1Buffer4[];

datetime Time[1];
datetime curbar[1];
datetime lastbar[1];
//+------------------------------------------------------------------+
//| Custom indicator initialization function                         |
//+------------------------------------------------------------------+
int OnInit()
  {
//--- indicator buffers mapping
   SetIndexBuffer(0,Label1Buffer1,INDICATOR_DATA);
   SetIndexBuffer(1,Label1Buffer2,INDICATOR_DATA);
   SetIndexBuffer(2,Label1Buffer3,INDICATOR_DATA);
   SetIndexBuffer(3,Label1Buffer4,INDICATOR_DATA);

   ArraySetAsSeries(Label1Buffer1,true);
   ArraySetAsSeries(Label1Buffer2,true);
   ArraySetAsSeries(Label1Buffer3,true);
   ArraySetAsSeries(Label1Buffer4,true);

   ArrayInitialize(Label1Buffer1,0.0);
   ArrayInitialize(Label1Buffer2,0.0);
   ArrayInitialize(Label1Buffer3,0.0);
   ArrayInitialize(Label1Buffer4,0.0);

//---
   return(0);
  }
//+------------------------------------------------------------------+
//| Custom indicator iteration function                              |
//+------------------------------------------------------------------+
int OnCalculate(const int rates_total,
                const int prev_calculated,
                const datetime &time[],
                const double &open[],
                const double &high[],
                const double &low[],
                const double &close[],
                const long &tick_volume[],
                const long &volume[],
                const int &spread[])
  {
//---
   if(NewBar())
     {
      Label1Buffer1[0]= AccountInfoDouble(ACCOUNT_EQUITY);
      Label1Buffer2[0]= AccountInfoDouble(ACCOUNT_EQUITY);
      Label1Buffer3[0]= AccountInfoDouble(ACCOUNT_EQUITY);
      Label1Buffer4[0]= AccountInfoDouble(ACCOUNT_EQUITY);
     }
   if(AccountInfoDouble(ACCOUNT_EQUITY)>Label1Buffer2[0])Label1Buffer2[0]= AccountInfoDouble(ACCOUNT_EQUITY);
   if(AccountInfoDouble(ACCOUNT_EQUITY)<Label1Buffer3[0])Label1Buffer3[0]= AccountInfoDouble(ACCOUNT_EQUITY);
   Label1Buffer4[0]=AccountInfoDouble(ACCOUNT_EQUITY);
//--- return value of prev_calculated for next call
   return(rates_total);
  }
//+------------------------------------------------------------------+
bool NewBar()
  {
   if(CopyTime(_Symbol,0,0,1,Time)<1)return(false);

   curbar[0]=Time[0];
   if(lastbar[0]!=curbar[0])
     {
      lastbar[0]=curbar[0];
      return(true);
     }
   else
     {
      return(false);
     }
  }
//+------------------------------------------------------------------+
おおよそこのような図式が浮かび上がってきます。
т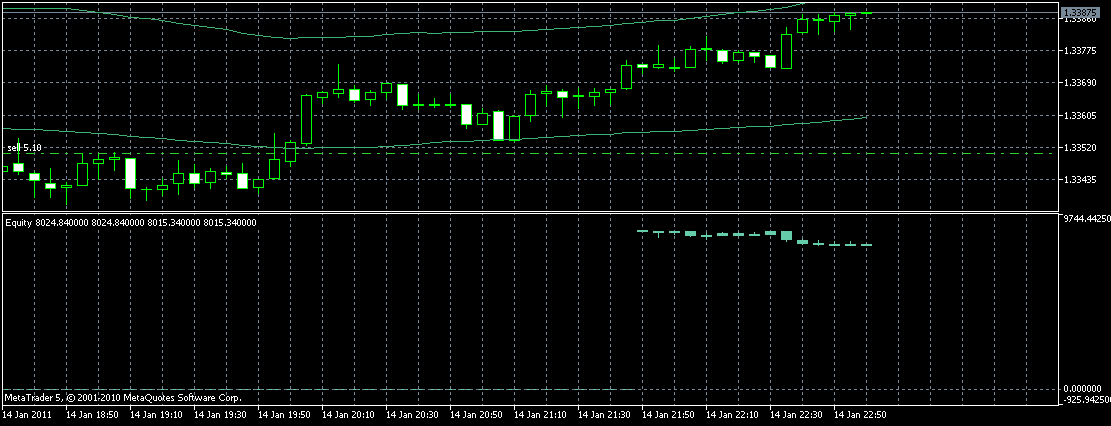
セルゲイさん、ありがとうございます
しかし、歴史を考慮した堅牢なEquityオシレーターを作ることは、本当に可能なのでしょうか?
Expert Advisor は、テスターで選択された期間のすべての Equity 値を最も簡単な方法で表示します。
Print(AccountInfoDouble(ACCOUNT_EQUITY))...
Print(AccountInfoDouble(ACCOUNT_EQUITY))の 値の変化から判断すると、Equityに変化があるのは、ヒストリーのEquityの現在の状態がインジケーターのOnCalculatde(...) メソッドでエミュレートされ、これがEAのOnTickメソッドの処理と同期して行われるからです。
では、何が問題なのでしょうか?出力利益は変化するのに、なぜIndicator(私の場合-10000)では変化しないのでしょうか?
コードは簡単なものです(ちょっとだけ書き直しました)。
//+------------------------------------------------------------------+
//|                                                       Equity.mq5 |
//|                        Copyright 2010, MetaQuotes Software Corp. |
//|                                              http://www.mql5.com |
//+------------------------------------------------------------------+
#property copyright "Copyright 2010, MetaQuotes Software Corp."
#property link      "http://www.mql5.com"
#property version   "1.00"
#property indicator_separate_window
#property indicator_buffers 1
#property indicator_plots   1
//--- plot Label1
#property indicator_label1  "Label1"
#property indicator_type1   DRAW_LINE
#property indicator_color1  Red
#property indicator_style1  STYLE_SOLID
#property indicator_width1  1
//--- indicator buffers
double Values[];


//+------------------------------------------------------------------+
//| Custom indicator initialization function                         |
//+------------------------------------------------------------------+
int OnInit(){
   //--- indicator buffers mapping
   SetIndexBuffer(0,Values,INDICATOR_DATA);
   PlotIndexSetInteger(0, PLOT_DRAW_BEGIN, 100);
   PlotIndexSetDouble(0, PLOT_EMPTY_VALUE, EMPTY_VALUE);
   ArraySetAsSeries(Values, false);
   return(0);
  }


//+------------------------------------------------------------------+
//| Custom indicator iteration function                              |
//+------------------------------------------------------------------+
int OnCalculate(const int rates_total,
                const int prev_calculated,
                const datetime& time[],
                const double& open[],
                const double& high[],
                const double& low[],
                const double& close[],
                const long& tick_volume[],
                const long& volume[],
                const int& spread[]){


   //---Блок контрольных показателей
   HistorySelect(0,TimeCurrent());
   Print("Equity - OnCalculate: HistoryDealsTotal()=", HistoryDealsTotal());
   Print("Equity - OnCalculate: AccountInfoDouble(ACCOUNT_EQUITY)=", AccountInfoDouble(ACCOUNT_EQUITY));
   Print("Equity - OnCalculate: rates_total=", rates_total);
   Print("Equity - OnCalculate: prev_calculated=", prev_calculated);
   Print("Equity - OnCalculate: ArraySize(open)= ", ArraySize(open));
   Print("Equity - OnCalculate: ArraySize(Values)= ", ArraySize(Values));
   Print("Equity - OnCalculate: datetime(time[",ArraySize(time)-1,"])= ", datetime(time[ArraySize(time)-1]));


   //---Блок заполнения Индикатора и журнала сообщений значениями
   for (int i = prev_calculated; i <= rates_total-1; ++i){
      //Путем сопоставления с выводом значений в Print() исследуются 2 варианта:
      // - Первый вариант - индикатор показывает динамику цен - правильно
      //Values[i] = open[i]; //То есть в соответствии с выводом в Print(...)
      // - Второй вариант - индикатор показывает динамику Equity - неправильно, так как объем остается постоянным
      Values[i] = AccountInfoDouble(ACCOUNT_EQUITY); //Хотя в выводе Print(...) он меняется
      //---Блок проверки даты и показателей цены открытия и Equity в цикле заполнения в рамках диапазона тестирования:
      if(prev_calculated > 0){
         Print("Equity - OnCalculate - Cycle: datetime([",i,"])= ", datetime(time[i]));
         Print("Equity - OnCalculate - Cycle: ArraySize([",i,"])= ", open[i]);
         Print("Equity - OnCalculate - Cycle: AccountInfoDouble(ACCOUNT_EQUITY) = ", AccountInfoDouble(ACCOUNT_EQUITY));
      }
   }
   return rates_total;
}
その結果、Indicatorのバランス値は一定で=10000、出力ではPrintが変化し、バランスではなく価格のダイナミクスの場合は正しく表示されるようになりました。
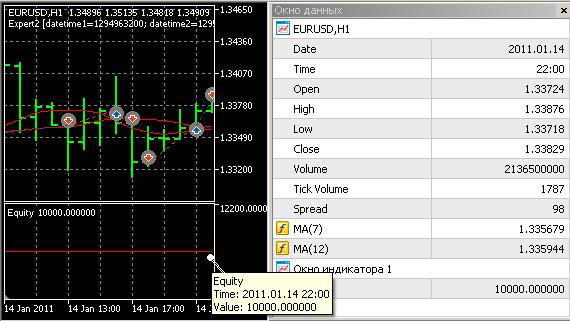
例えば、テスト期間の最後のバーについては、パラメータは以下のとおりです。
2011.01.19 19:27:27 Core 1 2011.01.14 22:00:00 Equity - OnCalculate - Cycle: AccountInfoDouble(ACCOUNT_EQUITY) = 9949.29999999 9949.
2011.01.19 19:27:27 Core 1 2011.01.14 22:00:00 Equity - OnCalculate - Cycle: ArraySize([6418])= 1.33724.
2011.01.19 19:27:27 Core 1 2011.01.14 22:00:00 Equity - OnCalculate - Cycle: datetime([6418])= 2011.01.14 22:00:00。
2011.01.19 19:27:27 Core 1 2011.01.14 22:00:00 Equity - OnCalculate: datetime(time[6418])= 2011.01.14 22:00:00。
2011.01.19 19:27:27:27 Core 1 2011.01.14 22:00:00 Equity - OnCalculate: ArraySize(Values)=6419
2011.01.19 19:27:27 Core 1 2011.01.14 22:00:00 Equity - OnCalculate: ArraySize(open)= 6419
2011.01.19 19:27:27 Core 1 2011.01.14 22:00:00 Equity - OnCalculate: prev_calculated=6418
2011.01.19 19:27:27 Core 1 2011.01.14 22:00:00 Equity - OnCalculate: rates_total=6419
2011.01.19 19:27:27 Core 1 2011.01.14 22:00:00 Equity - OnCalculate: AccountInfoDouble(ACCOUNT_EQUITY)=9949.299999999
2011.01.19 19:27:27 Core 1 2011.01.14 22:00:00 Equity - OnCalculate: HistoryDealsTotal()=12.
- www.mql5.com
こっちの方がきれいなんですよ。

- 2010.02.23
- MetaQuotes Software Corp.
- www.mql5.com
Print(AccountInfoDouble(ACCOUNT_EQUITY))の 値の変化から判断すると、Equityに変化があるのは、ヒストリーのEquityの現在の状態がインジケーターのOnCalculatde(...) メソッドでエミュレートされ、これがEAのOnTickメソッドの処理と同期して行われるからです。
では、何が問題なのでしょうか?なぜ、出力では利益が変化するのに、インジケータでは一定(私の場合は-10000)なのでしょうか?
不要な出力をすべてコメントアウトし、prev_calculatedの値を出力し始めるだけで、インジケータが最初の1回だけ計算され、次のティックではサイクルが機能しないことが理解できる。
   //---Блок контрольных показателей
   //HistorySelect(0,TimeCurrent());
   //Print("Equity - OnCalculate: HistoryDealsTotal()=", HistoryDealsTotal());
   //Print("Equity - OnCalculate: AccountInfoDouble(ACCOUNT_EQUITY)=", AccountInfoDouble(ACCOUNT_EQUITY));
   //Print("Equity - OnCalculate: rates_total=", rates_total);
   //Print("Equity - OnCalculate: prev_calculated=", prev_calculated);
   //Print("Equity - OnCalculate: ArraySize(open)= ", ArraySize(open));
   //Print("Equity - OnCalculate: ArraySize(Values)= ", ArraySize(Values));
   //Print("Equity - OnCalculate: datetime(time[",ArraySize(time)-1,"])= ", datetime(time[ArraySize(time)-1]));
   Print("prev_calculated=",prev_calculated,"   rates_total=",rates_total);
ロッシュ 正直なところ、あなたのことはあまり理解 できませんでした。出力は 、テスト範囲内のEquity が変化 することを確認するためにのみ必要
でした。OnCalculatedの ループがテスト範囲開始前の範囲に対して機能し、テスト範囲内でOnCalculatedの各コールが1ティックとパスだけを含むという事実は明らかですが
、変化する値がIndicator配列に書き込まれているにもかかわらず
、Equityの変化する
値がIndicator上に表示されないのはなぜでしょうか
。int OnCalculate(const int rates_total,以下は
const int prev_calculated,
const datetime& time[],
const double& open[],
const double& high[],
const double& low[],
const double& close[],
const long& tick_volume[],
const long& volume[],
const int& spread[]){
Print("prev_calculated=",prev_calculated," rates_total=",rates_total);
Print("Equity - OnCalculate: AccountInfoDouble(ACCOUNT_EQUITY)=", AccountInfoDouble(ACCOUNT_EQUITY));
for (int i = prev_calculated; i <= rates_total-1; ++i){
Values[i] = AccountInfoDouble(ACCOUNT_EQUITY);
}
return rates_total;
}
テスト期間終了時の結果です。インジケータ値の配列に書き込んだ Equity が変化し、10000 に等しい初期残高と異なることがわかります。
2011.01.20 13:32:07 Core 1 OnTester result 0そして、テスト期間の値を割り当てた 残高のチャートです
2011.01.20 13:32:07 Core 1 2011.01.14 23:59:59 order performed sell 0.15 at 1.33829 [#13 sell 0.15 EURUSD at 1.33829]
2011.01.20 13:32:07 Core 1 2011.01.14 23:59:59 deal performed [#13 sell 0.15 EURUSD at 1.33829]
2011.01.20 13:32:07 Core 1 2011.01.14 23:59:59 deal #13 sell 0.15 EURUSD at 1.33829 done (based on order #13)
2011.01.20 13:32:07 Core 1 2011.01.14 23:59:59 position closed due end of test at 1.33829 [buy 0.15 EURUSD 1.33593]
2011.01.20 13:32:07 Core 1 2011.01.14 22:00:00 Equity - OnCalculate: AccountInfoDouble(ACCOUNT_EQUITY)=9949.299999999999
2011.01.20 13:32:07 Core 1 2011.01.14 22:00:00 prev_calculated=6418 rates_total=6419
2011.01.20 13:32:07 Core 1 2011.01.14 21:00:00 CTrade::PositionOpen: instant buy 0.15 EURUSD at 1.33593 [done at 0.00000]
2011.01.20 13:32:07 Core 1 2011.01.14 21:00:00 order performed buy 0.15 at 1.33593 [#12 buy 0.15 EURUSD at 1.33593]
2011.01.20 13:32:07 Core 1 2011.01.14 21:00:00 deal performed [#12 buy 0.15 EURUSD at 1.33593]
2011.01.20 13:32:07 Core 1 2011.01.14 21:00:00 deal #12 buy 0.15 EURUSD at 1.33593 done (based on order #12)
2011.01.20 13:32:07 Core 1 2011.01.14 21:00:00 instant buy 0.15 EURUSD at 1.33593 (1.33577 / 1.33593 / 1.33577)
。 2011.01.14 22:00 時点のインジケータチャートで Equity 値を確認
します。 2011.01.14
22
:00:00の
ログによると、9949と等しいはずです。... 2011.01.14 22:00:00 Equity - OnCalculate: AccountInfoDouble(ACCOUNT_EQUITY)=9949.299999999999
そして、Indicatorチャートではどう
でしょうか
。
- 無料取引アプリ
- 8千を超えるシグナルをコピー
- 金融ニュースで金融マーケットを探索
みなさん、こんにちは。
Equityオシレーターを添付するチャートの下に構築する問題で1日悩んでいます(ちなみにTesterのチャートには、他の方も書かれている相場変動との比較のしやすさというメインが欠けているためです)。
この問題は、私が理解するところでは、2つの側面があります。
一方では、オシレータのOnCalculateメソッドで各バーのEquity AccountInfoDouble(ACCOUNT_EQUITY)を決定するメソッドが動作しない。
一方、AccountInfoDouble(ACCOUNT_EQUITY)メソッドが動作するExpert AdvisorのOnTickコードからオシレータチャート(というかそのデータバッファ)を変更できるかどうかは難しいところです。
以下は、シンプルな割に結果が出ないオシレータのコードである。
//+------------------------------------------------------------------+
//| Equity.mq5 |
//| Copyright 2010, MetaQuotes Software Corp. |
//| http://www.mql5.com |
//+------------------------------------------------------------------+
#property copyright "Copyright 2010, MetaQuotes Software Corp."
#property link "http://www.mql5.com"
#property version "1.00"
#property indicator_separate_window
#property indicator_buffers 1
#property indicator_plots 1
//--- plot Label1
#property indicator_label1 "Label1"
#property indicator_type1 DRAW_LINE
#property indicator_color1 Red
#property indicator_style1 STYLE_SOLID
#property indicator_width1 1
//--- indicator buffers
double Values[];
//+------------------------------------------------------------------+
//| Custom indicator initialization function |
//+------------------------------------------------------------------+
int OnInit(){
//--- indicator buffers mapping
SetIndexBuffer(0,Values,INDICATOR_DATA);
PlotIndexSetInteger(0, PLOT_DRAW_BEGIN, 100);
PlotIndexSetDouble(0, PLOT_EMPTY_VALUE, EMPTY_VALUE);
ArraySetAsSeries(Values, false);
return(0);
}
//+------------------------------------------------------------------+
//| Custom indicator iteration function |
//+------------------------------------------------------------------+
int OnCalculate(const int rates_total,
const int prev_calculated,
const datetime& time[],
const double& open[],
const double& high[],
const double& low[],
const double& close[],
const long& tick_volume[],
const long& volume[],
const int& spread[]){
int toCount = (int)MathMin(rates_total, rates_total - prev_calculated + 1);
for (int i = toCount - 2; i >= 0; --i){
Values[i] = AccountInfoDouble(ACCOUNT_EQUITY);
}
return rates_total;
}
直感的に、この問題を単純な方法で解決しなければならないことは理解できるのですが、その方法がわかりません。
この点に関して、どなたかアイデアをお持ちではないでしょうか?