Equity oscillator by MQL5 means
Hi all!
I've been struggling for a day with the issue of building the Equity oscillator under the chart to which it is attached (because the chart in the Tester lacks the main thing, namely the ease of comparison with market changes, as others have written about, by the way).
The problem, as I understand it, is two-sided.
On the one hand, the method for determining the Equity AccountInfoDouble(ACCOUNT_EQUITY) for each bar in the OnCalculate method of the oscillator refuses to work.
On the other hand, it is difficult to see whether the oscillator chart (or rather its data buffer) can be changed from the Expert Advisor's OnTick code where the AccountInfoDouble(ACCOUNT_EQUITY) method works.
Below is the code of the oscillator that, for all its simplicity, fails to produce results.
Intuitively I understand that the issue must be solved in a simple way but I cannot figure out how.
Maybe someone has some ideas concerning this subject?
AccountInfoDouble(ACCOUNT_EQUITY); returns the current state of equity and has no history. In your example, all the cells of the indicator buffer are written with the same value. Here is an example of the equity indicator, but it works only from the moment it is launched on the chart
//+------------------------------------------------------------------+
//|                                                       Equity.mq5 |
//|                                                    Сергей Грицай |
//|                                               sergey1294@list.ru |
//+------------------------------------------------------------------+
#property copyright "Сергей Грицай"
#property link      "sergey1294@list.ru"
#property version   "1.00"
#property indicator_separate_window
#property indicator_buffers 4
#property indicator_plots   1
//--- plot Label1
#property indicator_label1  "Label1"
#property indicator_type1   DRAW_CANDLES
#property indicator_color1  MediumAquamarine
#property indicator_style1  STYLE_SOLID
#property indicator_width1  1

double         Label1Buffer1[];
double         Label1Buffer2[];
double         Label1Buffer3[];
double         Label1Buffer4[];

//+------------------------------------------------------------------+
//| Custom indicator initialization function                         |
//+------------------------------------------------------------------+
int OnInit()
  {
//--- indicator buffers mapping
   SetIndexBuffer(0,Label1Buffer1,INDICATOR_DATA);
   SetIndexBuffer(1,Label1Buffer2,INDICATOR_DATA);
   SetIndexBuffer(2,Label1Buffer3,INDICATOR_DATA);
   SetIndexBuffer(3,Label1Buffer4,INDICATOR_DATA);

   ArraySetAsSeries(Label1Buffer1,true);
   ArraySetAsSeries(Label1Buffer2,true);
   ArraySetAsSeries(Label1Buffer3,true);
   ArraySetAsSeries(Label1Buffer4,true);

   ArrayInitialize(Label1Buffer1,0.0);
   ArrayInitialize(Label1Buffer2,0.0);
   ArrayInitialize(Label1Buffer3,0.0);
   ArrayInitialize(Label1Buffer4,0.0);
//---
   return(0);
  }
//+------------------------------------------------------------------+
//| Custom indicator iteration function                              |
//+------------------------------------------------------------------+
int OnCalculate(const int rates_total,
                const int prev_calculated,
                const datetime &time[],
                const double &open[],
                const double &high[],
                const double &low[],
                const double &close[],
                const long &tick_volume[],
                const long &volume[],
                const int &spread[])
  {
//---
   Label1Buffer1[0]= AccountInfoDouble(ACCOUNT_EQUITY);
   Label1Buffer2[0]= AccountInfoDouble(ACCOUNT_EQUITY);
   Label1Buffer3[0]= AccountInfoDouble(ACCOUNT_EQUITY);
   Label1Buffer4[0]= AccountInfoDouble(ACCOUNT_EQUITY);
//--- return value of prev_calculated for next call
   return(rates_total);
  }
//+------------------------------------------------------------------+
Fixed the indicator a little bit so it's better
#property indicator_separate_window
#property indicator_buffers 4
#property indicator_plots   1
//--- plot Label1
#property indicator_label1  "Label1"
#property indicator_type1   DRAW_CANDLES
#property indicator_color1  MediumAquamarine
#property indicator_style1  STYLE_SOLID
#property indicator_width1  1

double         Label1Buffer1[];
double         Label1Buffer2[];
double         Label1Buffer3[];
double         Label1Buffer4[];

datetime Time[1];
datetime curbar[1];
datetime lastbar[1];
//+------------------------------------------------------------------+
//| Custom indicator initialization function                         |
//+------------------------------------------------------------------+
int OnInit()
  {
//--- indicator buffers mapping
   SetIndexBuffer(0,Label1Buffer1,INDICATOR_DATA);
   SetIndexBuffer(1,Label1Buffer2,INDICATOR_DATA);
   SetIndexBuffer(2,Label1Buffer3,INDICATOR_DATA);
   SetIndexBuffer(3,Label1Buffer4,INDICATOR_DATA);

   ArraySetAsSeries(Label1Buffer1,true);
   ArraySetAsSeries(Label1Buffer2,true);
   ArraySetAsSeries(Label1Buffer3,true);
   ArraySetAsSeries(Label1Buffer4,true);

   ArrayInitialize(Label1Buffer1,0.0);
   ArrayInitialize(Label1Buffer2,0.0);
   ArrayInitialize(Label1Buffer3,0.0);
   ArrayInitialize(Label1Buffer4,0.0);

//---
   return(0);
  }
//+------------------------------------------------------------------+
//| Custom indicator iteration function                              |
//+------------------------------------------------------------------+
int OnCalculate(const int rates_total,
                const int prev_calculated,
                const datetime &time[],
                const double &open[],
                const double &high[],
                const double &low[],
                const double &close[],
                const long &tick_volume[],
                const long &volume[],
                const int &spread[])
  {
//---
   if(NewBar())
     {
      Label1Buffer1[0]= AccountInfoDouble(ACCOUNT_EQUITY);
      Label1Buffer2[0]= AccountInfoDouble(ACCOUNT_EQUITY);
      Label1Buffer3[0]= AccountInfoDouble(ACCOUNT_EQUITY);
      Label1Buffer4[0]= AccountInfoDouble(ACCOUNT_EQUITY);
     }
   if(AccountInfoDouble(ACCOUNT_EQUITY)>Label1Buffer2[0])Label1Buffer2[0]= AccountInfoDouble(ACCOUNT_EQUITY);
   if(AccountInfoDouble(ACCOUNT_EQUITY)<Label1Buffer3[0])Label1Buffer3[0]= AccountInfoDouble(ACCOUNT_EQUITY);
   Label1Buffer4[0]=AccountInfoDouble(ACCOUNT_EQUITY);
//--- return value of prev_calculated for next call
   return(rates_total);
  }
//+------------------------------------------------------------------+
bool NewBar()
  {
   if(CopyTime(_Symbol,0,0,1,Time)<1)return(false);

   curbar[0]=Time[0];
   if(lastbar[0]!=curbar[0])
     {
      lastbar[0]=curbar[0];
      return(true);
     }
   else
     {
      return(false);
     }
  }
//+------------------------------------------------------------------+
This is roughly the picture that emerges
т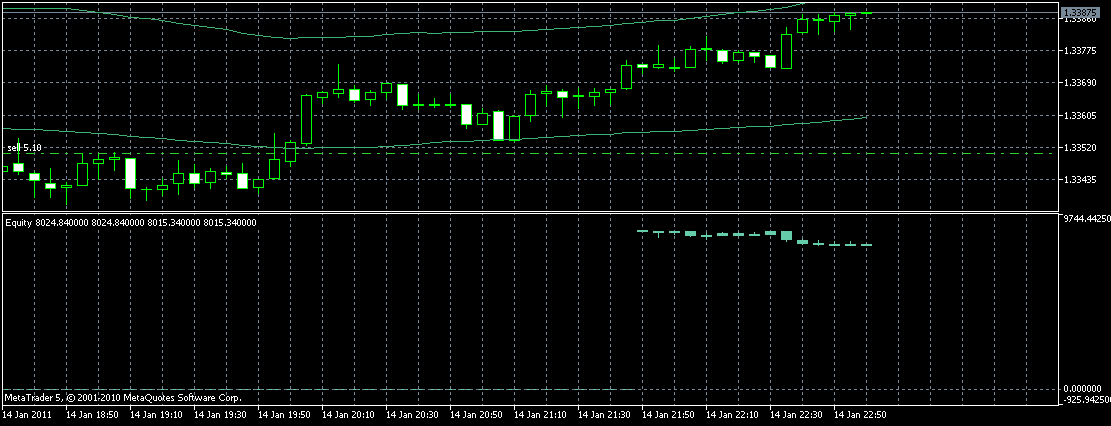
Sergey, thank you!
But is it really possible to create a robust Equity oscillator with history taken into account?
The Expert Advisor shows all Equity values for the period selected in the tester in the simplest way
Print(AccountInfoDouble(ACCOUNT_EQUITY))...
Sergey, thank you!
But is it really possible to create a robust Equity oscillator with history taken into account?
The Expert Advisor shows all Equity values for the period selected in the tester in the simplest way
Print(AccountInfoDouble(ACCOUNT_EQUITY))...
Judging by the changing values in Print(AccountInfoDouble(ACCOUNT_EQUITY)), there are changes in Equity because the current state of Equity from the history is emulated in the OnCalculatde(...) method of the indicator and this happens synchronously with processing in the OnTick method of the EA.
So what is the problem? Why in the output profit varies, while it remains unchanged in the Indicator (in my case - 10000)?
The code is a simple one (I rewrote it a bit):
//+------------------------------------------------------------------+
//|                                                       Equity.mq5 |
//|                        Copyright 2010, MetaQuotes Software Corp. |
//|                                              http://www.mql5.com |
//+------------------------------------------------------------------+
#property copyright "Copyright 2010, MetaQuotes Software Corp."
#property link      "http://www.mql5.com"
#property version   "1.00"
#property indicator_separate_window
#property indicator_buffers 1
#property indicator_plots   1
//--- plot Label1
#property indicator_label1  "Label1"
#property indicator_type1   DRAW_LINE
#property indicator_color1  Red
#property indicator_style1  STYLE_SOLID
#property indicator_width1  1
//--- indicator buffers
double Values[];


//+------------------------------------------------------------------+
//| Custom indicator initialization function                         |
//+------------------------------------------------------------------+
int OnInit(){
   //--- indicator buffers mapping
   SetIndexBuffer(0,Values,INDICATOR_DATA);
   PlotIndexSetInteger(0, PLOT_DRAW_BEGIN, 100);
   PlotIndexSetDouble(0, PLOT_EMPTY_VALUE, EMPTY_VALUE);
   ArraySetAsSeries(Values, false);
   return(0);
  }


//+------------------------------------------------------------------+
//| Custom indicator iteration function                              |
//+------------------------------------------------------------------+
int OnCalculate(const int rates_total,
                const int prev_calculated,
                const datetime& time[],
                const double& open[],
                const double& high[],
                const double& low[],
                const double& close[],
                const long& tick_volume[],
                const long& volume[],
                const int& spread[]){


   //---Блок контрольных показателей
   HistorySelect(0,TimeCurrent());
   Print("Equity - OnCalculate: HistoryDealsTotal()=", HistoryDealsTotal());
   Print("Equity - OnCalculate: AccountInfoDouble(ACCOUNT_EQUITY)=", AccountInfoDouble(ACCOUNT_EQUITY));
   Print("Equity - OnCalculate: rates_total=", rates_total);
   Print("Equity - OnCalculate: prev_calculated=", prev_calculated);
   Print("Equity - OnCalculate: ArraySize(open)= ", ArraySize(open));
   Print("Equity - OnCalculate: ArraySize(Values)= ", ArraySize(Values));
   Print("Equity - OnCalculate: datetime(time[",ArraySize(time)-1,"])= ", datetime(time[ArraySize(time)-1]));


   //---Блок заполнения Индикатора и журнала сообщений значениями
   for (int i = prev_calculated; i <= rates_total-1; ++i){
      //Путем сопоставления с выводом значений в Print() исследуются 2 варианта:
      // - Первый вариант - индикатор показывает динамику цен - правильно
      //Values[i] = open[i]; //То есть в соответствии с выводом в Print(...)
      // - Второй вариант - индикатор показывает динамику Equity - неправильно, так как объем остается постоянным
      Values[i] = AccountInfoDouble(ACCOUNT_EQUITY); //Хотя в выводе Print(...) он меняется
      //---Блок проверки даты и показателей цены открытия и Equity в цикле заполнения в рамках диапазона тестирования:
      if(prev_calculated > 0){
         Print("Equity - OnCalculate - Cycle: datetime([",i,"])= ", datetime(time[i]));
         Print("Equity - OnCalculate - Cycle: ArraySize([",i,"])= ", open[i]);
         Print("Equity - OnCalculate - Cycle: AccountInfoDouble(ACCOUNT_EQUITY) = ", AccountInfoDouble(ACCOUNT_EQUITY));
      }
   }
   return rates_total;
}
As a result the balance value in the Indicator is constant and = 10000, while in the output Print changes, and in the case of dynamics not of balance but of prices it is displayed correctly.
For example, for the last of the bars of the tested period the parameters are as follows
2011.01.19 19:27:27 Core 1 2011.01.14 22:00:00 Equity - OnCalculate - Cycle: AccountInfoDouble(ACCOUNT_EQUITY) = 9949.299999999999
2011.01.19 19:27:27 Core 1 2011.01.14 22:00:00 Equity - OnCalculate - Cycle: ArraySize([6418])= 1.33724
2011.01.19 19:27:27:27 Core 1 2011.01.14 22:00:00 Equity - OnCalculate - Cycle: datetime([6418])= 2011.01.14 22:00:00
2011.01.19 19:27:27 Core 1 2011.01.14 22:00:00 Equity - OnCalculate: datetime(time[6418])= 2011.01.14 22:00:00
2011.01.19 19:27:27:27 Core 1 2011.01.14 22:00:00 Equity - OnCalculate: ArraySize(Values)=6419
2011.01.19 19 19:27:27 Core 1 2011.01.14 22:00:00 Equity - OnCalculate: ArraySize(open)= 6419
2011.01.19 19 19:27:27 Core 1 2011.01.14 22:00:00 Equity - OnCalculate: prev_calculated=6418
2011.01.19 19:27:27:27 Core 1 2011.01.14 22:00:00 Equity - OnCalculate: rates_total=6419
2011.01.19 19:27:27:27 Core 1 2011.01.14 22:00:00 Equity - OnCalculate: AccountInfoDouble(ACCOUNT_EQUITY)=9949.299999999999
2011.01.19 19:27:27 Core 1 2011.01.14 22:00:00 Equity - OnCalculate: HistoryDealsTotal()=12
- www.mql5.com
It's prettier this way.
Below is the oscillator code, which, for all its simplicity, does not produce results.

- 2010.02.23
- MetaQuotes Software Corp.
- www.mql5.com
Judging by the changing values in Print(AccountInfoDouble(ACCOUNT_EQUITY)), there are changes in Equity because the current state of Equity from the history is emulated in the OnCalculatde(...) method of the indicator and this happens synchronously with processing in the OnTick method of the EA.
So what is the problem? Why in the output profit varies, while in the indicator it remains constant (in my case - 10000)?
It is enough to comment out all unnecessary output and start outputting the value prev_calculated, to understand that the indicator is calculated only for the first time, and the cycle does not work on next ticks
   //---Блок контрольных показателей
   //HistorySelect(0,TimeCurrent());
   //Print("Equity - OnCalculate: HistoryDealsTotal()=", HistoryDealsTotal());
   //Print("Equity - OnCalculate: AccountInfoDouble(ACCOUNT_EQUITY)=", AccountInfoDouble(ACCOUNT_EQUITY));
   //Print("Equity - OnCalculate: rates_total=", rates_total);
   //Print("Equity - OnCalculate: prev_calculated=", prev_calculated);
   //Print("Equity - OnCalculate: ArraySize(open)= ", ArraySize(open));
   //Print("Equity - OnCalculate: ArraySize(Values)= ", ArraySize(Values));
   //Print("Equity - OnCalculate: datetime(time[",ArraySize(time)-1,"])= ", datetime(time[ArraySize(time)-1]));
   Print("prev_calculated=",prev_calculated,"   rates_total=",rates_total);
Rosh, to be honest, I didn't understand you much . The output was only needed to make sure that Equity inside the testing range does change
.The fact that the loop in OnCalculated works with respect to the range before the testing range starts, and then inside the testing rangeeach call of OnCalculated contains only one tick and a pass - is clear, but why the changing value
ofEquity is not displayed on the Indicator, although the changing values are written to the Indicator array?
Here is the code of the abridged version of OnCalculated:
int OnCalculate(const int rates_total,
                const int prev_calculated,
                const datetime& time[],
                const double& open[],
                const double& high[],
                const double& low[],
                const double& close[],
                const long& tick_volume[],
                const long& volume[],
                const int& spread[]){
   Print("prev_calculated=",prev_calculated,"   rates_total=",rates_total);
   Print("Equity - OnCalculate: AccountInfoDouble(ACCOUNT_EQUITY)=", AccountInfoDouble(ACCOUNT_EQUITY));
   for (int i = prev_calculated; i <= rates_total-1; ++i){
      Values[i] = AccountInfoDouble(ACCOUNT_EQUITY);
   }
   return rates_total;
}
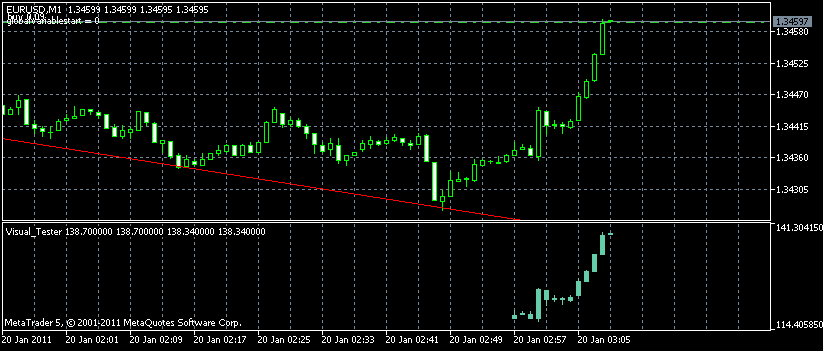
Here are the results at the end of the testing period where we can see that Equity that we write to the array of indicator values changes and differs from the initial balance equal to 10000:
2011.01.20 13:32:07 Core 1 OnTester result 0And here is the chart of balance with assigned values for the testing period
2011.01.20 13:32:07 Core 1 2011.01.14 23:59:59 order performed sell 0.15 at 1.33829 [#13 sell 0.15 EURUSD at 1.33829]
2011.01.20 13:32:07 Core 1 2011.01.14 23:59:59 deal performed [#13 sell 0.15 EURUSD at 1.33829]
2011.01.20 13:32:07 Core 1 2011.01.14 23:59:59 deal #13 sell 0.15 EURUSD at 1.33829 done (based on order #13)
2011.01.20 13:32:07 Core 1 2011.01.14 23:59:59 position closed due end of test at 1.33829 [buy 0.15 EURUSD 1.33593]
2011.01.20 13:32:07 Core 1 2011.01.14 22:00:00 Equity - OnCalculate: AccountInfoDouble(ACCOUNT_EQUITY)=9949.299999999999
2011.01.20 13:32:07 Core 1 2011.01.14 22:00:00 prev_calculated=6418 rates_total=6419
2011.01.20 13:32:07 Core 1 2011.01.14 21:00:00 CTrade::PositionOpen: instant buy 0.15 EURUSD at 1.33593 [done at 0.00000]
2011.01.20 13:32:07 Core 1 2011.01.14 21:00:00 order performed buy 0.15 at 1.33593 [#12 buy 0.15 EURUSD at 1.33593]
2011.01.20 13:32:07 Core 1 2011.01.14 21:00:00 deal performed [#12 buy 0.15 EURUSD at 1.33593]
2011.01.20 13:32:07 Core 1 2011.01.14 21:00:00 deal #12 buy 0.15 EURUSD at 1.33593 done (based on order #12)
2011.01.20 13:32:07 Core 1 2011.01.14 21:00:00 instant buy 0.15 EURUSD at 1.33593 (1.33577 / 1.33593 / 1.33577)
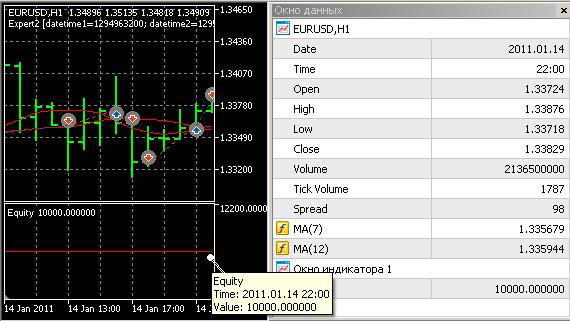
We check Equity value on the indicator chart as of 2011.01.14 22:00
According to the log
as of 2011.01.14
22
:00:00
it should be equal to 9949:... 2011.01.14 22:00:00 Equity - OnCalculate: AccountInfoDouble(ACCOUNT_EQUITY)=9949.299999999999
And what do we see on the Indicator chart
?
- Free trading apps
- Over 8,000 signals for copying
- Economic news for exploring financial markets
You agree to website policy and terms of use
Hi all!
I've been struggling for a day with the issue of building the Equity oscillator under the chart to which it is attached (because the chart in the Tester lacks the main thing, namely the ease of comparison with market changes, which others have written about, by the way).
The problem, as I understand it, is two-sided.
On the one hand, the method for determining the Equity AccountInfoDouble(ACCOUNT_EQUITY) for each bar in the OnCalculate method of the oscillator refuses to work.
On the other hand, it is difficult to see whether the oscillator chart (or rather its data buffer) can be changed from the Expert Advisor's OnTick code where the AccountInfoDouble(ACCOUNT_EQUITY) method works.
Below is the code of the oscillator that, for all its simplicity, fails to produce results.
//+------------------------------------------------------------------+
//| Equity.mq5 |
//| Copyright 2010, MetaQuotes Software Corp. |
//| http://www.mql5.com |
//+------------------------------------------------------------------+
#property copyright "Copyright 2010, MetaQuotes Software Corp."
#property link "http://www.mql5.com"
#property version "1.00"
#property indicator_separate_window
#property indicator_buffers 1
#property indicator_plots 1
//--- plot Label1
#property indicator_label1 "Label1"
#property indicator_type1 DRAW_LINE
#property indicator_color1 Red
#property indicator_style1 STYLE_SOLID
#property indicator_width1 1
//--- indicator buffers
double Values[];
//+------------------------------------------------------------------+
//| Custom indicator initialization function |
//+------------------------------------------------------------------+
int OnInit(){
//--- indicator buffers mapping
SetIndexBuffer(0,Values,INDICATOR_DATA);
PlotIndexSetInteger(0, PLOT_DRAW_BEGIN, 100);
PlotIndexSetDouble(0, PLOT_EMPTY_VALUE, EMPTY_VALUE);
ArraySetAsSeries(Values, false);
return(0);
}
//+------------------------------------------------------------------+
//| Custom indicator iteration function |
//+------------------------------------------------------------------+
int OnCalculate(const int rates_total,
const int prev_calculated,
const datetime& time[],
const double& open[],
const double& high[],
const double& low[],
const double& close[],
const long& tick_volume[],
const long& volume[],
const int& spread[]){
int toCount = (int)MathMin(rates_total, rates_total - prev_calculated + 1);
for (int i = toCount - 2; i >= 0; --i){
Values[i] = AccountInfoDouble(ACCOUNT_EQUITY);
}
return rates_total;
}
Intuitively I understand that the issue must be solved in a simple way but I cannot figure out how.
Maybe somebody has some ideas in this respect?