SUM Symbol Switcher MT5
- Indicatori
- Versione: 1.0

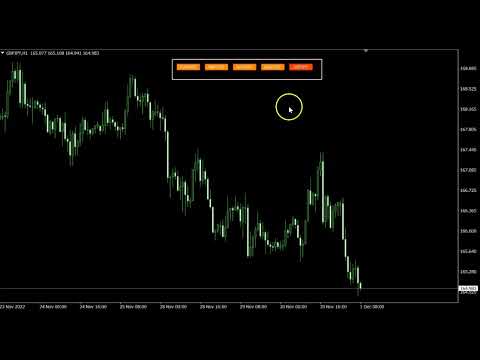
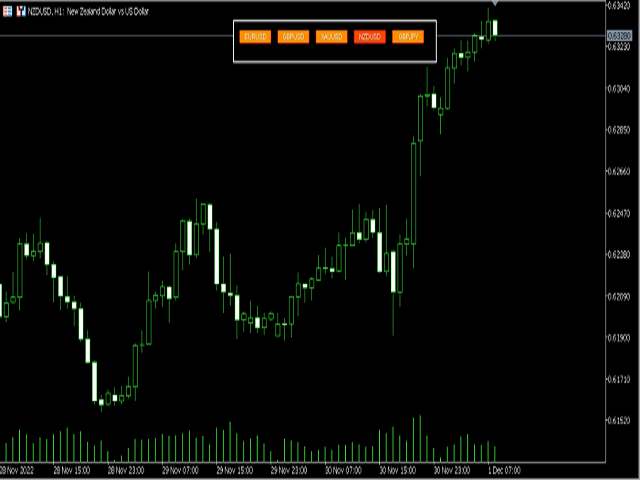
Indicator for fast navigation through financial instruments.
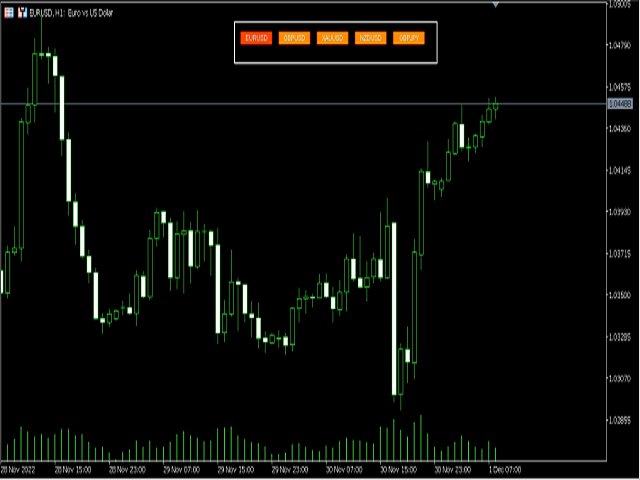
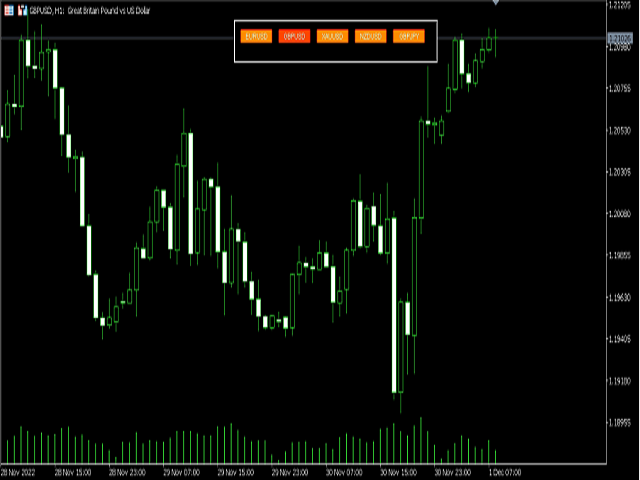
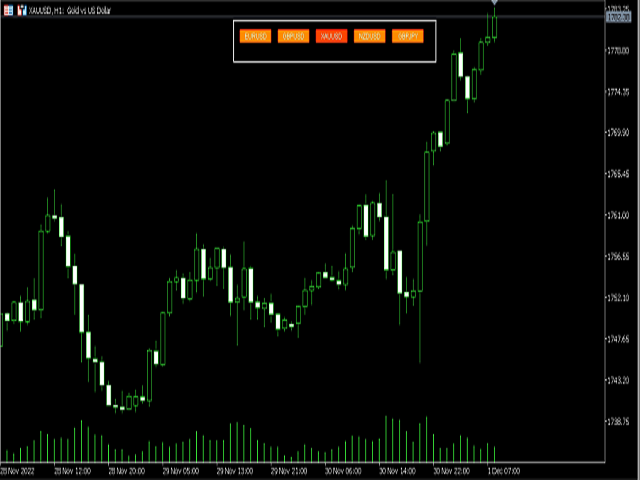
When you click on the button, you go to the chart of the financial instrument, the name of which was written on the button.
In other words, the indicator opens or unfolds an existing chart window.
For each chart, you can customize the name of the financial instrument, text color and background color; in total, you can customize symbols buttons that you trade often.
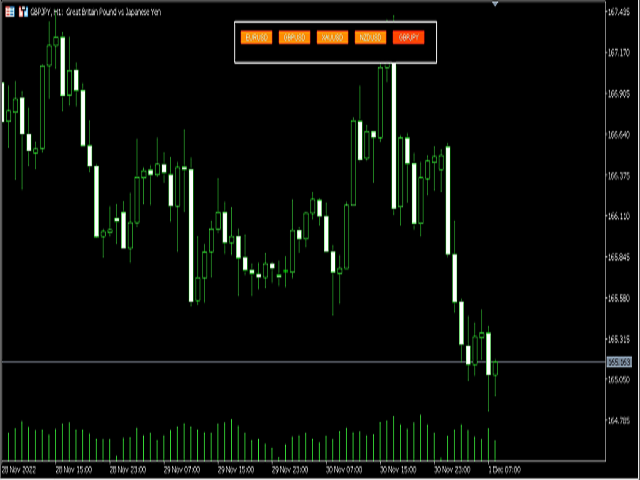
The indicator can be installed on any charts for which you need to switch.
But you need to add symbols in the market watch list
Internally, it support hot key as "W", "S", "A", "D", and you can use hot key to switch symbols
Note : if "OpenNewChart" is true, hot key function will be disabled.
Hotkey supported
- W - Key up
- S - Key down
- A - Key backward
- D - Key forward
Description of settings
- SymbolList - input the symbols that you trade often, internally, it supports prefix/suffix, so when you input the symbol name, you can ignore to input suffix/prefix
- TextColor - inactive button text color
- PanelColor - panel color
- PanelBorderColor - panel boarder color
- PanelBorderWidth - panel boarder line width
- ButtonInactiveColor - inactive button background color
- ButtonPressedColor - pressed button background color
- ButtonPressedTextColor - pressed button text color
- ButtonFontSize - button text font size
- ButtonFont - font
- ButtonBorderColor - button boarder color
- PanelWidth - button panel width
- PanelHeight - button panel heigh
- PanelStart_X - whole panel x position
- PanelStart_Y - whole panel y position
- MaxNumColumns - numbers of display symbol columns
- MaxNumRows - numbers of display symbol rows
- OpenNewChart - if true, click the button, it will open new chart, if false it will switch symbol at current chart