TradeStats MT5
- Indicatori
- Versione: 1.2
- Aggiornato: 1 febbraio 2022
- Attivazioni: 20

Indicator that shows you at any time the current number of closed deals as well as profit and loss totals of the closed deals of the account that you're logged into for a configurable period.
To do this, it is best to load Deals and "Complete history" in the account history in the terminal and then enter the desired period in the indicator (e.g. 2022.01.01-2023.01.01 would be for calendar year 2022).
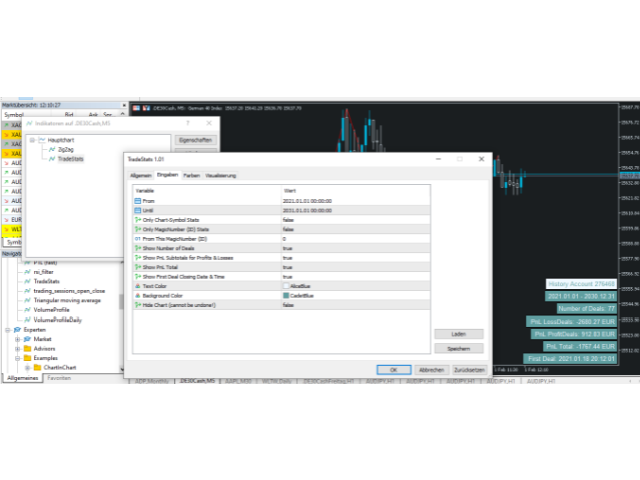
Input options:
- Period (Attention: corresponding data must be loaded into the account history of the terminal).
- Option to only show stats of Chartsymbol
- Option to only show stats of certain ID (MagicNumber)
- Display deal count
- Display P&L total
- Display P&L for profit and loss deals separately (e.g. for loss offset limitation in Germany)
- Display of the date and time of the first closed deal of the period, to cross-check that enough data is loaded in the account history.
Controlling risk and limiting losses has always been key to any trader's success. In order to control losses, we need to know them first. Therefore, it is important to always keep an eye on what is the current sum of all profit and loss deals. I have therefore built this indicator for MT4 that automatically calculates this at the account level.