Vwap MT5

reference:

"High Frequency Trading, A Pratical Guide to Algorithmic Strategies and Trading Systems (Aldridge, Irene)"


Characteristics
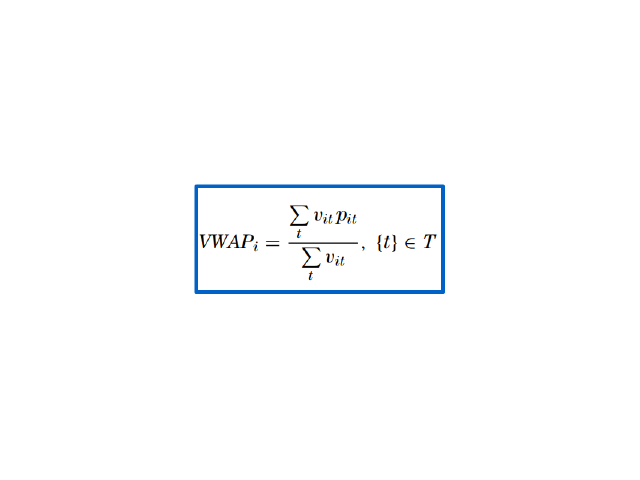
  • The calculation of VWAP is in accordance with the literature.
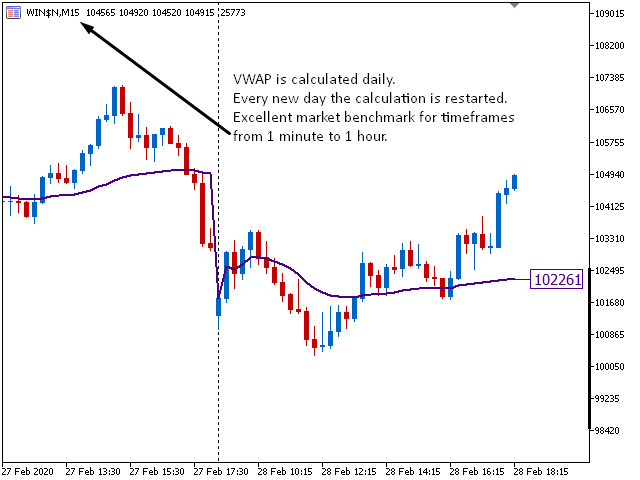
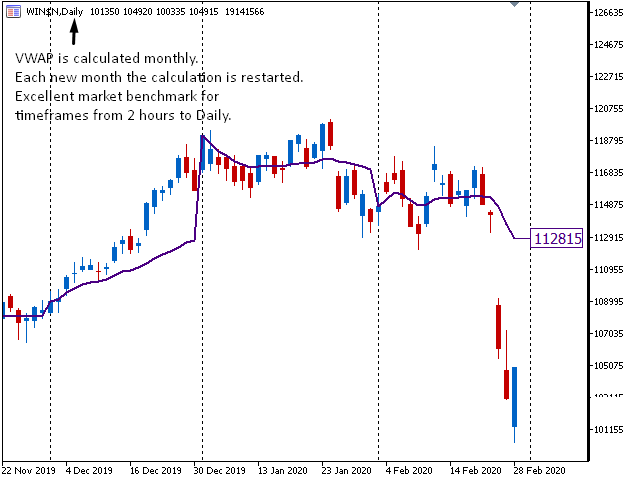
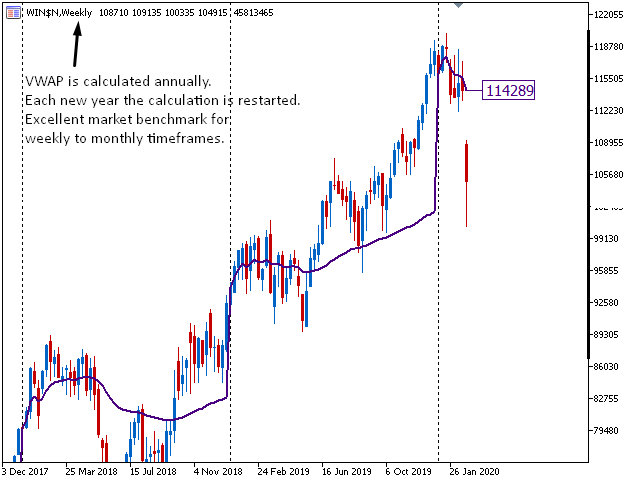
  • 4 types of VWAPs, daily, monthly, yearly, moving. Note: Daily is the most popular form, the calculation is performed from the beginning to the end of each trading session (Market benchmark). In the moving, the calculation is carried out from n periods past to the current period, as with the famous moving averages, however weighted by volume.
  • Possibility to choose between 2 types of volume calculation, real volume or tick volume.
  • A label is displayed with the VWAP price calculation, which is allowed to change the size and style the border.
  • Possibility to change the width and stylize the VWAP's historic line.

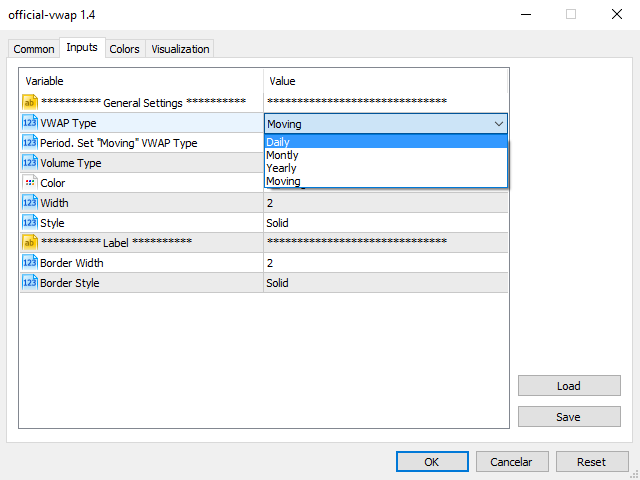
Input Parameters tab
  • VWAP Type - VWAP type, daily, monthly, yearly or moving.
  • Period - Period to be considered in the moving VWAP calculation.
  • Volume Type - Type of volume. By real volume or tick volume.
  • Color - Line color.
  • Width - Line width.
  • Style - Line style.
  • Border Width - Size of the digits and the label's border.
  • Border Style - Label border style.
Prodotti consigliati
Wapv Price and volume
Eduardo Da Costa Custodio Santos
L'indicatore di prezzo e volume WAPV per MT5 fa parte del set di strumenti (Wyckoff Academy Wave Market) e (Wyckoff Academy Price and Volume). L'indicatore di prezzo e volume WAPV per MT5 è stato creato per semplificare la visualizzazione del movimento del volume sul grafico in modo intuitivo. Con esso puoi osservare i momenti di picco del volume e i momenti in cui il mercato non ha interesse professionale Identifica i momenti in cui il mercato si muove per inerzia e non per movimento di "denaro
Weis Wave Result MT5
Sant Clear Ali Costa
Features 3 types of waves: bullish, bearish and unknown. The unknown tower comes when prices move in opposite the direction of the current tower. Label that shows the percentage remaining for the next tower. Allows you set the type of volume that will be accumulated in the towers, either real or tick volumes. Thus, the indicator works in any market, for example: stocks, futures, forex, commodities, etc. Allows you to set the required score for the tower exchange. Allows you to set the font size
WAPV Weis Wave Chart MT5
Eduardo Da Costa Custodio Santos
Il grafico Weis Wave per MT5 è un indicatore di prezzo e volume. La lettura del prezzo e del volume è stata ampiamente diffusa tramite Richard Demille Wyckoff sulla base delle tre leggi da lui create: offerta e domanda, causa ed effetto e sforzo contro risultato. Già nel 1900 R.Wyckoff utilizzava la carta delle onde nelle sue analisi. Molti anni dopo, intorno al 1990, David Weis ha automatizzato il diagramma delle onde di R. Wyckoff e oggi vi portiamo l'evoluzione del diagramma delle onde di Dav
Weis Wave Scouter
Jean Carlos Martins Roso
Scopri la potenza dell'analisi avanzata del volume con Weis Wave Scouter, un indicatore rivoluzionario per MetaTrader 5 che combina i principi comprovati del metodo Wyckoff e dell'analisi VSA (Volume Spread Analysis). Progettato per trader che cercano precisione e profondità nelle loro operazioni, questo indicatore offre una lettura tattica del mercato attraverso l'analisi delle onde di volume cumulativo, aiutando a individuare punti chiave di inversione e continuazione di tendenza. Weis Wave Sc
Heikin Ashi candlesticks are a powerful tool for traders, offering a clear and smooth visualization of market trends. Unlike traditional candlesticks, they filter out market noise, providing a cleaner view of the market's direction and strength, which helps traders make more informed decisions. The Hull Heikin Ashi Smoothed indicator from Minions Labs takes this a step further by integrating the Hull Moving Average for enhanced smoothing and precision. This indicator not only simplifies trend id
Mine Farm
Maryna Kauzova
Mine Farm is one of the most classic and time-tested scalping strategies based on the breakdown of strong price levels. Mine Farm is the author's modification of the system for determining entry and exit points into the market... Mine Farm - is the combination of great potential with reliability and safety. Why Mine Farm?! - each order has a short dynamic Stop Loss - the advisor does not use any risky methods (averaging, martingale, grid, locking, etc.) - the advisor tries to get the most
Il WaveTrend Oscillator MT5 è un potente indicatore di trading progettato per migliorare la tua analisi di mercato identificando cambiamenti di momentum e potenziali inversioni di tendenza. Ideale per trader di tutti i livelli, questo strumento offre preziose informazioni su condizioni di ipercomprato e ipervenduto in vari mercati, tra cui forex, criptovalute e materie prime. Con la sua capacità di generare segnali di acquisto e vendita accurati, il WaveTrend Oscillator MT5 consente ai trader di
Time and Sales Tick
Pablo Filipe Soares De Almeida
Time & Sales Tick Indicator è un indicatore per MetaTrader 5 che mostra i dati dei tick in tempo reale. Visualizza prezzo, volume dei tick e orario direttamente sul grafico. Funzionalità Mostra i dati dei tick, inclusi prezzo, volume e tempo, in un pannello sul grafico. Raggruppa i tick in intervalli definiti dall’utente, con colori distinti (verde per rialzo, rosso per ribasso). Il pannello può essere posizionato in qualsiasi angolo del grafico.
CvdDeltaVolumes
Parasbhai N Patel
Delta + CVD & CVD Candles Order-flow indicator combining Delta (Ask–Bid), Cumulative Volume Delta (CVD), and a unique CVD-based synthetic candle system. Shows buy/sell pressure, volume aggressiveness, and momentum shifts with optional Delta histogram, CVD line, and CVD+Delta combined candles. Useful for scalping, intraday trading, divergence detection, and understanding buyer/seller dominance. Overview The Delta + CVD & CVD Candles Indicator combines multiple order-flow tools into one clean
Gm Vwap Point
Antonio Augusto Barreto De Melo
VWAP is an intraday calculation used primarily by algorithms and institutional traders to assess where a stock is trading in relation to its weighted average volume for the day. Day traders also use VWAP to assess market direction and filter out trading signals. This indicator is used to analyze and calculate the Vwap from a certain point on the graph, which is widely used to analyze the beginning of a movement of the price relationship with the volume. - Multi Vwaps on the same chart, placed
This indicator allows you to enjoy the two most popular products for analyzing request volumes and market deals at a favorable price: Actual Depth of Market Chart Actual Tick Footprint Volume Chart This product combines the power of both indicators and is provided as a single file. The functionality of Actual COMBO Depth of Market AND Tick Volume Chart is fully identical to the original indicators. You will enjoy the power of these two products combined into the single super-indicator! Below is
TRI Visualizer
Yoshimi Mon 三 Ura
TRI Visualizer MT5 – Thermodynamic Market Analysis Overview The TRI (Thermal Range Indicator) Visualizer Enhanced is a rare market analysis indicator that goes beyond conventional technical analysis, applying principles of thermodynamics from physics. It interprets market price fluctuations as “thermodynamic energy,” enabling the highly accurate detection of subtle market changes that are often overlooked. Innovative Mechanisms 1. Dual Calculation Engines Classic TRI Mode Formula: |Close
VWAP Daily
Anton Polkovnikov
Weighted average price indicator or VWAP. The well-known standard VWAP with the beginning of the day is added with the function of selecting the periodization. It can be calculated both every day and on other periods. Also the indicator allows to exclude the volume from the calculation, which will allow using it on the cryptocurrencies and forex. There is an alert for a VWAP price crossing. There are 1 and 2 standard deviation. Settings: Volume: turning volume on and off in the calculation mecha
Swing Point Volume
Thalles Nascimento De Carvalho
Swing Point Volume, the indicator that signals weakness and strength at the tops and bottoms. This indicador can be for used the Wyckoff Method. Information provided; - Swing on customized ticks. - Volume and points in each balance sheet. - Percentage of Displacement. - Sound alert option on top and bottom breaks. - Volume in ticks and Real Volume. - Volume HL (extreme) or (opening and closing) - Customized volume shapes.
Caicai L&S Yield Histogram Important Notice: This indicator is an integral tool of the automated EA Caicai Long and Short Pair Trading . This indicator visually displays the percentage deviation (Yield %) of a pair's current spread relative to its own historical mean. It is an excellent tool for quickly visualizing the gross financial potential of a market distortion in Long & Short operations. Main Features: Percentage Visualization: Understand the size of the distortion in palpable percentage
Fractals
Mikhail Nazarenko
The Fractals indicator displays on the chart only fractals with the specified parameters in the indicator settings. This allows you to more accurately record a trend reversal, excluding false reversals. According to the classical definition of a fractal, it is a candlestick - an extremum on the chart, which was not crossed by the price of 2 candles before and 2 candles after the appearance of a fractal candle. This indicator provides the ability to adjust the number of candles before and after t
HiLo Activator Plus
Rodrigo Galeote
5 (1)
HiLo Activator is one of the most used indicators to determine trend. Find it here with the ability to customize period and colors. This indicator also plots up and down arrows when there is a change on the trend, indicating very strong entry and exit points. HiLo fits well to different types of periods for day trading. You can easily understand when it is time to buy or sell. It works pretty good also for other periods like daily and monthly signalizing long-term trends. The use of the indicato
The Market Structure Analyzer is a powerful tool designed for traders who follow market structure and smart money concepts. This comprehensive indicator provides a suite of features to assist in identifying key market levels, potential entry points, and areas of liquidity. Here's what it offers: 1. Swing High/Low Detection : Accurately identifies and marks swing highs and lows, providing a clear view of market structure. 2. Dynamic Supply and Demand Zones: Draws precise supply and demand zone
Professional Opening Range Breakout (ORB) indicator designed for precision session trading with automatic time handling, breakout alerts, and advanced target levels. This indicator automatically identifies the Opening Range for any configurable session, plots the High, Low, and Midpoint levels, and extends them across the trading day. Built-in breakout detection and alerts, range measurements, and extension targets provide traders with clear structure and actionable levels. Ideal for traders usi
No Demand No Supply MT5
Trade The Volume Waves Single Member P.C.
No Demand No Supply   This indicator identifies   No Demand –No Supply candles to your chart and plots volume bars colored according to the signal. It can be applied to all timeframes or to a specific one only. It can also be used as regular volume indicator  with exceptional future of WEIGHTED VOLUME. Furthermore is has an alert notification, sound and email when a signals occurs. The indicator does not repaint but the alert will come on two candles back due to the definition of No Demand No Su
Mini Chart Indicators
Flavio Javier Jarabeck
The Metatrader 5 has a hidden jewel called Chart Object, mostly unknown to the common users and hidden in a sub-menu within the platform. Called Mini Chart, this object is a miniature instance of a big/normal chart that could be added/attached to any normal chart, this way the Mini Chart will be bound to the main Chart in a very minimalist way saving a precious amount of real state on your screen. If you don't know the Mini Chart, give it a try - see the video and screenshots below. This is a gr
Volume Profile VFX
Thanutchaya Phatsathit
Volume Profile VFX:  Why Choose Volume Profile VFX?  Volume Profile VFX is engineered for traders who demand precision, reliability, and a decisive edge in modern markets — and every future Dynamic Visual Effects (VFX) update is included free for the lifetime of your license.                                     Feature Volume Profile VFX Volume Logic Advanced Data Validation Engine. Verified data accuracy, overriding common broker feed inconsistencies. Data Integrity Non-Repainting & Non-Lagg
1.       Overview The Volume Pressure Histogram (VPH) is a custom indicator for MetaTrader 5 (MT5) that measures buying and selling pressure based on tick or real volume. It highlights extreme buying/selling moments and provides a smoothed signal line for trend detection. 2.       Indicator Components ·          Volume Pressure Histogram (Colored): o    Green: Extreme buying pressure o    Lime: Buying pressure o    Red: Extreme selling pressure o    Yellow: Selling pressure ·          Signal Li
True Weis Wave
Atila Goncalves Firmino
A version based on David Waves' description in his book 'Trade About to Happen' of his adaptation of the Wyckoff wave chart. The indicator directionally accumulates volume, adding to each brick or candle close, with color indication for up and down. it can be used it with tick or real volume, it also changes color when the accumulated value of the previous wave is exceeded, being the trade signal. Yellow color is used for doji candlestick, it will continue with accumulation without zero the sum
La maggior parte degli indicatori sull'oro ti mostra dove il movimento era. Aurum Apex ti mostra dove sta andando — prima che la maggioranza entri. Non è un'affermazione. È l'architettura. Cos'è Aurum Apex? Aurum Apex è un indicatore di scalping XAUUSD senza ridisegno per MetaTrader 5 , costruito esclusivamente attorno a un solo strumento — l'Oro — e progettato per identificare il momentum di breakout nel suo punto di origine, prima che l'espansione del prezzo raggiunga la piena velocità. Non ri
MACD Line and Histogram
Everton Henrique Romera Matumoto
The MACD Line and Histogram is an enhanced version of the classic Moving Average Convergence Divergence (MACD) indicator. While the traditional MACD consists of two lines—the MACD (Main) line and the Signal line —the extended version introduces a Histogram that visually represents the difference between these two lines. ​  Inputs Fast MA method  (Simple, Exponential, Smothed or Linear weighted) Fast MA period   Slow MA method  (Simple, Exponential, Smothed or Linear weighted) Slow MA period  
VWAP Bands
Rafael Caetano Pinto
This indicator uses VWAP and projects this VWAP into up to 3 levels, shifted by a percentage of the chart's symbol. How to configure: Choose the symbol and desired graphic time Set the start time of the symbol (in bovespa, WIN and WDO start at 9 o'clock). This time is used as the cutoff reference for VWAP. Check which VWAP period fits the chart better: Ideally, a period when VWAP is not too distant from the chart Set percentage levels: Ideally, you should set levels based on history, so that le
Indicator developed by the Brazilian and analyst Odir Aguiar (Didi), consists of "Moving Averages", famously known as "Didi needles", where it allows the viewing of reversal points. The concept is very simple, when you enter 3 Moving Averages on display, a period equal to 3, one equal to 8 and the other equal to 20, then the formation of the indicator that works in axis or line center equal to 0 (zero) appears. ). Moving averages must intersect when approaching line 0. The scanner monitors 10
Automatic Support and Resistance Osw MT5 This Indicator graphs lines at the possible support and resistance points of the selected asset. it works in multiple temporalities. allows you to configure: Color of the lines. Width of the lines. Type of lines. When the indicator begins its operation, it analyzes the supports and resistances of higher levels for the temporality in which it is working.
RENKO PRICE ACTION ATR is an "Expert Advisor" developed through the construction of the Renko Chart where each BRICK has the size calculated through the ATR of the period selected by the user. Renko charts are designed to filter out minor price movements, thus making it easier for traders to focus on important trends. Due to its efficiency in detecting price trends, it is also possible to clearly identify supports and resistances as well as top and bottom divergences, thus making better use of t
Gli utenti di questo prodotto hanno anche acquistato
Divergence Bomber
Ihor Otkydach
4.9 (86)
Ogni acquirente dell’indicatore riceverà inoltre gratuitamente: L’utilità esclusiva “Bomber Utility”, che gestisce automaticamente ogni operazione, imposta i livelli di Stop Loss e Take Profit e chiude le posizioni secondo le regole della strategia I file di configurazione (set file) per adattare l’indicatore a diversi asset I set file per configurare il Bomber Utility in tre modalità: “Rischio Minimo”, “Rischio Bilanciato” e “Strategia di Attesa” Una guida video passo-passo per installare, conf
Entry In The Zone and SMC Multi Timeframe is a real-time 2-in-1 market analysis tool that combines market structure analysis and a No Repaint BUY / SELL signal system into a single indicator, built on Smart Money Concepts (SMC) — a widely adopted framework used by professional traders to understand market structure. This indicator helps you see the market more clearly, make decisions based on structure rather than guesswork, and focus on high-probability zones where price is more likely to react
Azimuth Pro
Ottaviano De Cicco
5 (6)
Azimuth Pro V2: Synthetic Fractal Structure and Confirmed Entries for MT5 Overview Azimuth Pro is a multi-level swing structure indicator by Merkava Labs . Four nested swing layers, swing-anchored VWAP, ABC pattern detection, three-timeframe structural filtering, and closed-bar confirmed entries — one chart, one workflow from micro-swings to macro-cycles. This is not a blind signal product. It is a structure-first workflow for traders who care about location, context, and timing. V2 Launch Offe
Quantum TrendPulse
Bogdan Ion Puscasu
5 (23)
Ecco   Quantum TrendPulse   , lo strumento di trading definitivo che combina la potenza di   SuperTrend   ,   RSI   e   Stocastico   in un unico indicatore completo per massimizzare il tuo potenziale di trading. Progettato per i trader che cercano precisione ed efficienza, questo indicatore ti aiuta a identificare con sicurezza le tendenze di mercato, i cambiamenti di momentum e i punti di entrata e uscita ottimali. Caratteristiche principali: Integrazione SuperTrend:   segui facilmente l'andame
Gann Made Easy è un sistema di trading Forex professionale e facile da usare che si basa sui migliori principi del trading utilizzando la teoria di mr. WD Gann. L'indicatore fornisce segnali ACQUISTA e VENDI accurati, inclusi i livelli di Stop Loss e Take Profit. Puoi fare trading anche in movimento utilizzando le notifiche PUSH. CONTATTAMI DOPO L'ACQUISTO PER RICEVERE GRATUITAMENTE LE ISTRUZIONI DI TRADING E OTTIMI INDICATORI EXTRA! Probabilmente hai già sentito parlare molte volte dei metodi d
OmniSync Projection
Antonio-alin Teculescu
5 (1)
Chronos Fractal Engine is an innovative price projection indicator for MetaTrader 5, designed to transform your technical analysis by intelligently identifying and projecting historical price patterns. Built upon an advanced correlation algorithm and the fractal principles of the market, this powerful tool visualizes potential future price movements, giving you a unique edge in your trading decisions. What is Chronos Fractal Engine? At its core, the Chronos Fractal Engine employs a sophisticat
Se acquisti questo indicatore, riceverai il mio Trade Manager Professionale + EA  GRATUITAMENTE. Innanzitutto è importante sottolineare che questo sistema di trading è un indicatore Non-Repainting, Non-Redrawing e Non-Lagging, il che lo rende ideale sia per il trading manuale che per quello automatico. Corso online, manuale e download di preset. Il "Sistema di Trading Smart Trend MT5" è una soluzione completa pensata sia per i trader principianti che per quelli esperti. Combina oltre 10 indicat
Presentazione       Quantum Breakout PRO   , l'innovativo indicatore MQL5 che sta trasformando il modo in cui scambi le zone di breakout! Sviluppato da un team di trader esperti con un'esperienza di trading di oltre 13 anni,       Quantum Breakout PRO       è progettato per spingere il tuo viaggio di trading a nuovi livelli con la sua strategia innovativa e dinamica della zona di breakout. Quantum Breakout Indicator ti fornirà frecce di segnalazione sulle zone di breakout con 5 zone target di
Grabber System MT5
Ihor Otkydach
4.83 (23)
Ti presento un eccellente indicatore tecnico: Grabber, che funziona come una strategia di trading "tutto incluso", pronta all’uso. In un solo codice sono integrati strumenti potenti per l’analisi tecnica del mercato, segnali di trading (frecce), funzioni di allerta e notifiche push. Ogni acquirente di questo indicatore riceve anche gratuitamente: L’utility Grabber: per la gestione automatica degli ordini aperti Video tutorial passo dopo passo: per imparare a installare, configurare e utilizzare
FX Trend MT5 NG
Daniel Stein
5 (4)
FX Trend NG: La Nuova Generazione di Intelligenza di Trend Multi-Mercato Panoramica FX Trend NG è uno strumento professionale di analisi del trend multi-timeframe e monitoraggio dei mercati. Ti consente di comprendere la struttura completa del mercato in pochi secondi. Invece di passare tra numerosi grafici, puoi identificare immediatamente quali strumenti sono in trend, dove il momentum sta diminuendo e dove esiste un forte allineamento tra i timeframe. Offerta di Lancio – Ottieni FX Trend NG
Scopri quale strategia funziona davvero sul tuo simbolo - prima di rischiare denaro reale. Power Bar rileva le barre di prezzo estreme su qualsiasi simbolo e qualsiasi timeframe, poi esegue istantaneamente il backtest di 3 diverse strategie di trading per confrontare tassi di vincita, fattori di profitto e P&L fianco a fianco. Tutto in un unico pannello interattivo. Niente supposizioni. Niente curve-fitting. Solo dati. Cosa rende Power Bar unico? La maggior parte degli indicatori fornisce un se
CGE Trading Suite
Carl Gustav Johan Ekstrom
5 (2)
Institutional-Grade Analytics for MT5 C GE Trading Suite delivers the analytical edge typically reserved for professional trading desks. The platform integrates a full suite of analytical tools into one seamless workflow: dynamic grid mapping, liquidity behavior analysis, ECM, trend lines, MIDAS, trade cycles, and directional channel projections. Together, these provide a unified view of market structure and momentum. Directional clarity is further enhanced by the capital flow index, which meas
Atomic Analyst MT5
Issam Kassas
3.94 (31)
Innanzitutto, vale la pena sottolineare che questo indicatore di trading non è repaint, non è ridisegno e non presenta ritardi, il che lo rende ideale sia per il trading manuale che per quello automatico. Manuale utente: impostazioni, input e strategia. L'Analista Atomico è un indicatore di azione del prezzo PA che utilizza la forza e il momentum del prezzo per trovare un miglior vantaggio sul mercato. Dotato di filtri avanzati che aiutano a rimuovere rumori e segnali falsi, e aumentare il pote
Trend Screener Pro MT5
STE S.S.COMPANY
4.85 (104)
Indicatore di tendenza, soluzione unica rivoluzionaria per il trading di tendenze e il filtraggio con tutte le importanti funzionalità di tendenza integrate in un unico strumento! È un indicatore multi-timeframe e multi-valuta al 100% non ridipingibile che può essere utilizzato su tutti i simboli/strumenti: forex, materie prime, criptovalute, indici e azioni. Trend Screener è un indicatore di tendenza che segue un indicatore efficiente che fornisce segnali di tendenza a freccia con punti nel gra
FX Power MT5 NG
Daniel Stein
5 (31)
FX Power: Analizza la Forza delle Valute per Decisioni di Trading Più Intelligenti Panoramica FX Power è lo strumento essenziale per comprendere la reale forza delle principali valute e dell'oro in qualsiasi condizione di mercato. Identificando le valute forti da comprare e quelle deboli da vendere, FX Power semplifica le decisioni di trading e rivela opportunità ad alta probabilità. Che tu segua le tendenze o anticipi inversioni utilizzando valori estremi di Delta, questo strumento si adatta
Btmm state engine pro
Garry James Goodchild
5 (4)
BTMM State Engine Pro is a MetaTrader 5 indicator for traders who use the Beat The Market Maker approach: Asian session context, kill zone timing, level progression, peak formation detection, and a multi-pair scanner from a single chart. It combines cycle state logic with a built-in scanner dashboard so you do not need the same tool on many charts at once. What it does Draws the Asian session range; session times can follow broker server offset or be set in inputs. Tracks level progression (L
Berma Bands
Muhammad Elbermawi
5 (8)
L'indicatore Berma Bands (BBs) è uno strumento prezioso per i trader che cercano di identificare e capitalizzare i trend di mercato. Analizzando la relazione tra il prezzo e le BBs, i trader possono discernere se un mercato è in una fase di trend o di range. Visita il [ Berma Home Blog ] per saperne di più. Le Berma Bands sono composte da tre linee distinte: la Upper Berma Band, la Middle Berma Band e la Lower Berma Band. Queste linee sono tracciate attorno al prezzo, creando una rappresentazion
Meridian Pro
Ottaviano De Cicco
5 (1)
Meridian Pro: Professional Multi-Timeframe Trend Matrix for MT5 Overview Meridian Pro is a multi-timeframe trend matrix by Merkava Labs that compresses directional state, strength, momentum condition and matrix agreement into one compact panel. One adaptive engine, applied consistently from M1 to W1. No per-symbol tuning. No indicator stacking. One structured readout across every asset and every timeframe. Launch Offer — Get Meridian Pro for USD 99 (introductory). Regular price: USD 149. 1. Why
Bill Williams Advanced
Siarhei Vashchylka
5 (11)
Bill Williams Advanced is designed for automatic chart analysis using Bill Williams' "Profitunity" system. The indicator analyzes four timeframes at once. Manual (Be sure to read before purchasing) Advantages 1. Analyzes the chart using Bill Williams' "Profitunity" system. Signals are displayed in a table in the corner of the screen and on the price chart. 2. Finds all known AO and AC signals, as well as zone signals. Equipped with a trend filter based on the Alligator. 3. Finds "Divergence Bar
Auto Optimized Parabolic RSI: Motore di Momentum 3D Avanzato La maggior parte degli indicatori per trader privati fallisce perché si affida a parametri statici che smettono di funzionare nel momento in cui la volatilità del mercato cambia. Auto Optimized Parabolic RSI risolve il problema dell'"obsolescenza dell'indicatore" ricalcolando continuamente il proprio vantaggio matematico, portando un adattamento quantitativo di livello istituzionale direttamente sul tuo terminale MT5. Il Vantaggio Prin
ARICoins
Temirlan Kdyrkhan
ARICoin is a powerful trading companion designed to generate high-probability entry signals with dynamic TP/SL/DP levels based on volatility. Built-in performance tracking shows win/loss stats, PP1/PP2 hits, and success rates all updated live. Key Features: Buy/Sell signals with adaptive volatility bands Real-time TP/SL/DP levels based on ATR Built-in MA Filter with optional ATR/StdDev volatility Performance stats panel (Success, Profit/Loss, PP1/PP2) Alerts via popup, sound, push, or email Cust
SignalTech MT5 is a trading system for EURUSD, USDCHF, USDJPY, AUDUSD, NZDUSD, EURJPY, AUDJPY, NZDJPY, CADJPY H2 and H3 Timeframe.  It can generate signals with Buy/Sell Arrows and Pop-Up/Sound Alerts. Each signal has clear Entry and Stop Loss levels, which should be automatically flagged on the chart, as well as potential Targets 1, 2, and 3. The Entry and TP levels are fixed after the trade is taken. The exit level is dynamic. If there are signs of a potential short-term trend reversal, the
Meravith Scanner
Ivan Stefanov
5 (1)
MERAVITH SCANNER è un indicatore professionale per i mercati finanziari su MetaTrader 5, che integra più strumenti di analisi in un unico sistema. Esegue tutti i calcoli automaticamente utilizzando una metodologia proprietaria basata sul prezzo medio ponderato per il volume (VWAP), eliminando completamente l’interpretazione soggettiva. L’indicatore funziona su tutte le classi di asset (Forex, Azioni, Indici, Commodities, Criptovalute) e su tutti i timeframe, da M1 a Mensile. Il principio fondame
Blahtech Supply Demand MT5
Blahtech Limited
4.54 (13)
Was: $299  Now: $99  Supply Demand uses previous price action to identify potential imbalances between buyers and sellers. The key is to identify the better odds zones, not just the untouched ones. Blahtech Supply Demand indicator delivers functionality previously unavailable on any trading platform. This 4-in-1 indicator not only highlights the higher probability zones using a multi-criteria strength engine, but also combines it with multi-timeframe trend analysis, previously confirmed swings a
La Master Edition è uno strumento analitico di livello professionale progettato per visualizzare la struttura del mercato attraverso l'obiettivo del volume e del flusso di denaro. A differenza degli indicatori di volume standard, questo strumento visualizza un Profilo di Volume Giornaliero direttamente sul tuo grafico, permettendoti di vedere esattamente dove si è verificata la scoperta dei prezzi e dove è posizionato il "denaro intelligente". Questa Master Edition è progettata per chiarezza e v
RelicusRoad Pro: Sistema Operativo Quantitativo di Mercato 70% DI SCONTO ACCESSO A VITA (TEMPO LIMITATO) - UNISCITI A 2.000+ TRADER Perché la maggior parte dei trader fallisce anche con indicatori "perfetti"? Perché operano su Singoli Concetti isolati. Un segnale senza contesto è una scommessa. Per vincere serve CONFLUENZA . RelicusRoad Pro non è un semplice indicatore. È un Ecosistema Quantitativo completo . Mappa la "Fair Value Road", distinguendo tra rumore e rotture strutturali. Smetti di in
Innanzitutto, vale la pena sottolineare che questo Strumento di Trading è un Indicatore Non-Ridipingente, Non-Ridisegnante e Non-Laggante, il che lo rende ideale per il trading professionale. Corso online, manuale utente e demo. L'Indicatore Smart Price Action Concepts è uno strumento molto potente sia per i nuovi che per i trader esperti. Racchiude più di 20 utili indicatori in uno solo, combinando idee di trading avanzate come l'Analisi del Trader del Circolo Interno e le Strategie di Tradin
Gartley Hunter Multi
Siarhei Vashchylka
5 (11)
Gartley Hunter Multi - An indicator for searching for harmonic patterns simultaneously on dozens of trading instruments and on all possible timeframes. Manual (Be sure to read before purchasing) | Version for MT4 Advantages 1. Patterns: Gartley, Butterfly, Shark, Crab. Bat, Alternate Bat, Deep Crab, Cypher 2. Simultaneous search for patterns on dozens of trading instruments and on all possible timeframes 3. Search for patterns of all possible sizes. From the smallest to the largest 4. All fou
Automated Trendlines MT5
Georgios Kalomoiropoulos
Le linee di tendenza sono lo strumento più essenziale di analisi tecnica nel forex trading. Sfortunatamente, la maggior parte dei trader non li disegna correttamente. L'indicatore automatizzato delle linee di tendenza è uno strumento professionale per i trader seri che ti aiuta a visualizzare il movimento di tendenza dei mercati. Esistono due tipi di linee di tendenza, linee di tendenza rialziste e linee di tendenza ribassiste. Nella tendenza rialzista, la linea di tendenza Forex viene tracci
Questo cruscotto scopre e visualizza le zone di   domanda   e   offerta   sul grafico, sia in modalità scalping che a lungo termine, a seconda della vostra strategia di trading per i simboli selezionati. Inoltre, la modalità scanner del cruscotto vi aiuta a controllare tutti i simboli desiderati in un colpo d'occhio e a non perdere nessuna posizione adatta /   versione MT4 Indicatore gratuito:   Basic Supply Demand Caratteristiche Consente di visualizzare le opportunità di trading su più  
Altri dall’autore
Official Weis Wave MT5
Sant Clear Ali Costa
4 (1)
References: "A Modern Adaptation of the Wyckoff Method" "The Secret Science of Price and Volume" "Trades About to Happen" To know more, search on the internet: "The Wyckoff Method", "Weis Wave" and "Volume Spread Analysis"; Features 3 types of waves: bullish, bearish and unknown. The unknown wave comes when prices move in opposite the direction of the current wave. Label that shows the percentage remaining for the next wave. Allows you set the type of volume that will be accumulated in the wave
Weis Wave Result MT5
Sant Clear Ali Costa
Features 3 types of waves: bullish, bearish and unknown. The unknown tower comes when prices move in opposite the direction of the current tower. Label that shows the percentage remaining for the next tower. Allows you set the type of volume that will be accumulated in the towers, either real or tick volumes. Thus, the indicator works in any market, for example: stocks, futures, forex, commodities, etc. Allows you to set the required score for the tower exchange. Allows you to set the font size
Weis Wave Box MT5
Sant Clear Ali Costa
Features 3 types of boxes: bullish, bass and unknown. The unknown box arises when prices move in the opposite direction of the current box. Allows you to set the required points for the box change. Lets you set both the box border types and colors or background color. Label that shows the box reversal points. Lets you set the size, color, corner position, and vertical label margin. Input Parameters Tab Reversal Points. Limit in points in the opposite direction to change boxes. Bulls Box Color -
Movable VWAP Pro MT5
Sant Clear Ali Costa
Features Start point of VWAP movable. 7 types of VWAP calculation methods: close, open, high, low, average price, typical price and weighted close. 2 types of volume calculation: ticks or real volume. Thus, the indicator works in any market, for example: stocks, futures, forex, commodities, etc. Color, line style, and line width of the customizable VWAP. Label that show the current VWAP price. VWAP breakout alert that can be enabled or disabled. 2 types of methods to trigger the breakout alert:
Market Profile Pro MT5
Sant Clear Ali Costa
4 (1)
Features Value area lines (POC, VAH and VAL) of the present and the past separately customizable, making it easier for the trader to read on the most important levels. Value areas and volume profile work in any time period and in any market such as: stocks, futures, forex. commodities, etc. Customizable volume profiles color in single color or gradient. The gradient offers the view of how the volume behaved over time. Customizable performance setup. Allowed to set the number of sessions in whic
EMarket AI
Sant Clear Ali Costa
The wait is over, the AI for Traders has arrived! The Elite Market AI is an Expert Advisor powered by one of the most advanced generative AI models available today. It processes the price and indicator data displayed on the screen, providing traders with valuable insights into the current market situation. This analysis can be crucial for making informed buy or sell decisions, assisting in trading strategy, and enhancing the accuracy of operations. Configurations Country Code Description: Def
Filtro:
Nessuna recensione
Rispondi alla recensione