DH Equity Analyzer
- Utilità
-
David Hinz
 Profit = Risk
- Versione: 1.44
- Attivazioni: 10
Analyze the equity curve, the real drawdown and the key figures from your trade history and display them as a chart, for every symbol, every magic number and every comment.
Analysis of the trade history
The DH Equity Analyzer analyzes all trades from the account history and breaks them down individually. Everything can be filtered precisely by symbol, magic number and the comments that your strategies store in the order. Select a magic number, a symbol or a comment, and the dashboard shows the equity curve, the drawdown and the key figures for exactly this part of your trading.
Real drawdown from the candle history
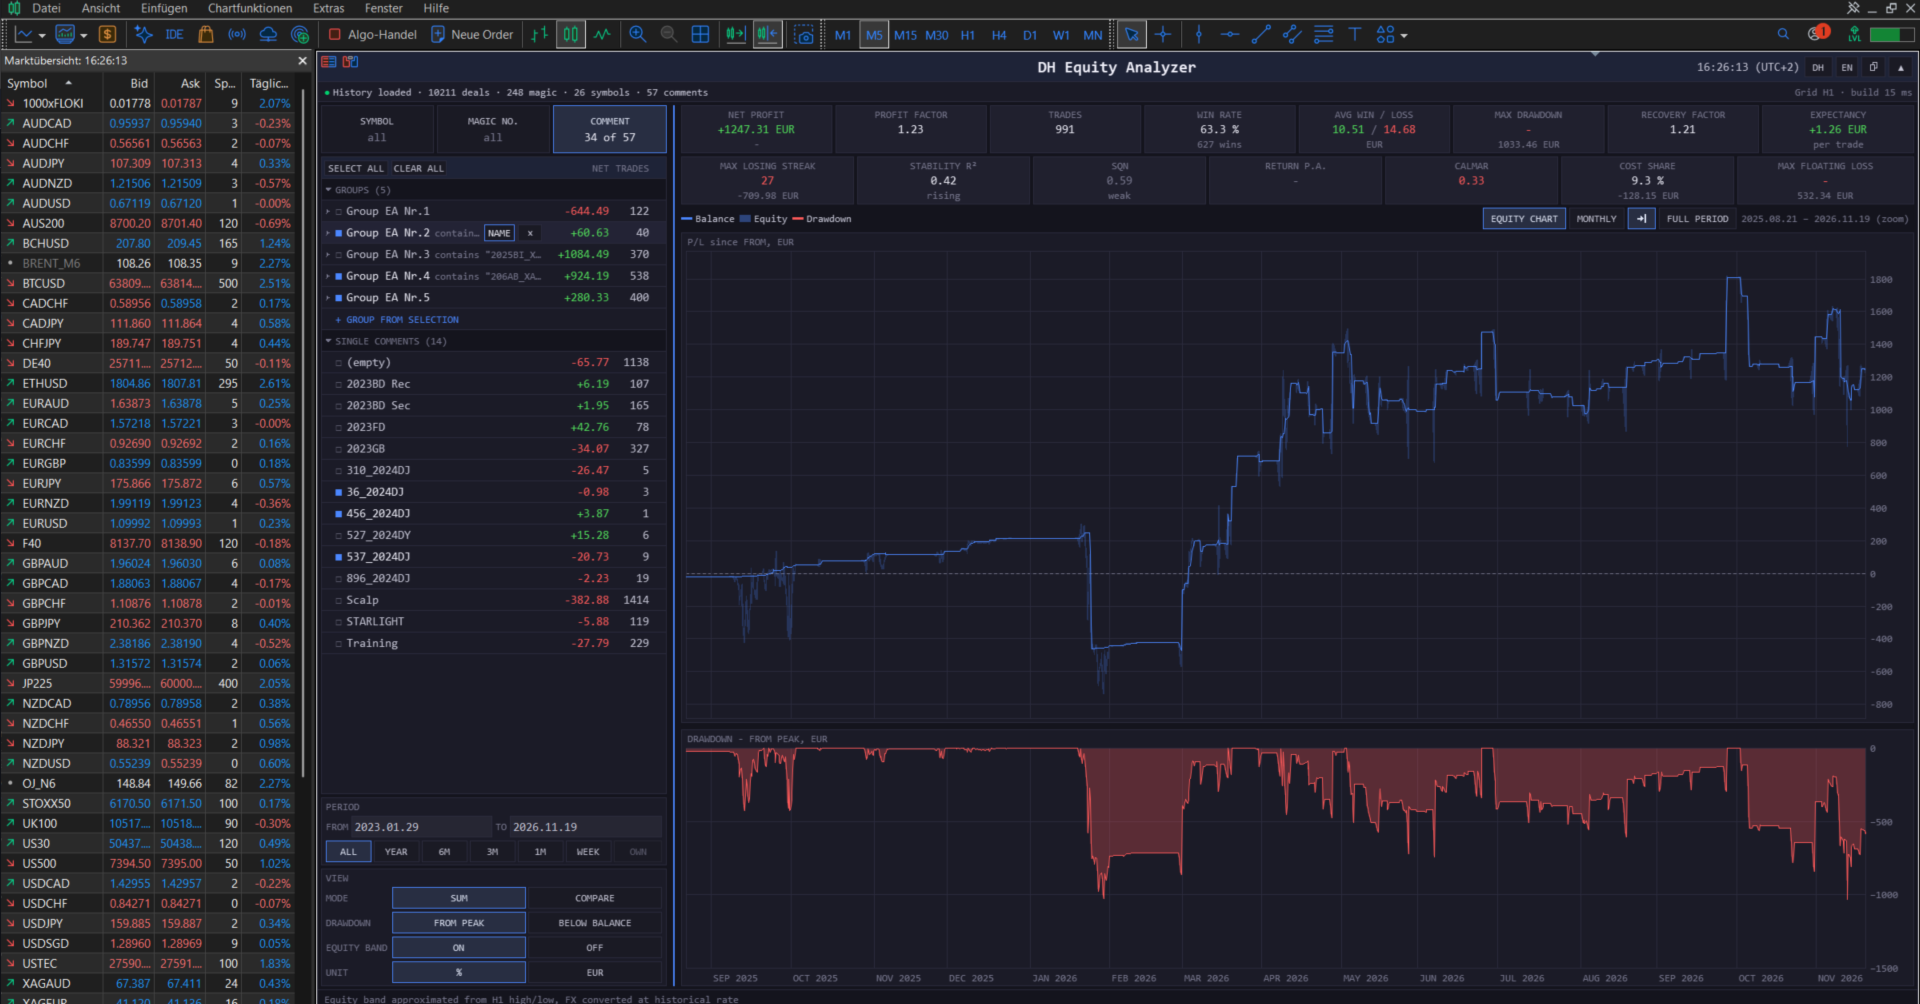
Closed trades show the result, not the risk on the way there. The real drawdown comes from open positions, and it is recorded in the candles. For every candle of the period, the DH Equity Analyzer determines the positions that were open at that time, values them at the high and the low of the candle in the account currency and adds them up. This gives an equity band around the balance line and a drawdown curve for the whole trade history. You see how high the loss of a strategy was before it closed in profit; for grid and martingale systems, this is the decisive number. The band is calculated from candle highs and lows, not from ticks.
Selection
Three tabs, Symbols, Magic numbers and Comments, list everything that occurs in the history. Within a tab, you select one or several rows, and their trades are evaluated together. Across the tabs, the selection is narrowed down: with EURUSD selected in the Symbol tab and one magic number selected in the Magic tab, you see the trades of this Expert Advisor on EURUSD. Each row shows its net result and the number of trades for the chosen period, so you can see at a glance where the profit or the loss in that time comes from.
Magic numbers and comments can be given readable names, for example the name of the Expert Advisor. Many Expert Advisors run several strategies under one magic number and distinguish them by the trade comment. Such comments can be combined into a group with its own name. The group then counts as one strategy: select it, and all its comments are evaluated together; expand it, and you compare the strategies within. By means of a text pattern, a group also takes in future comments automatically.
The period comes from quick buttons (week, month, 3 months, 6 months, year, whole history) or from two dates.
Dashboard
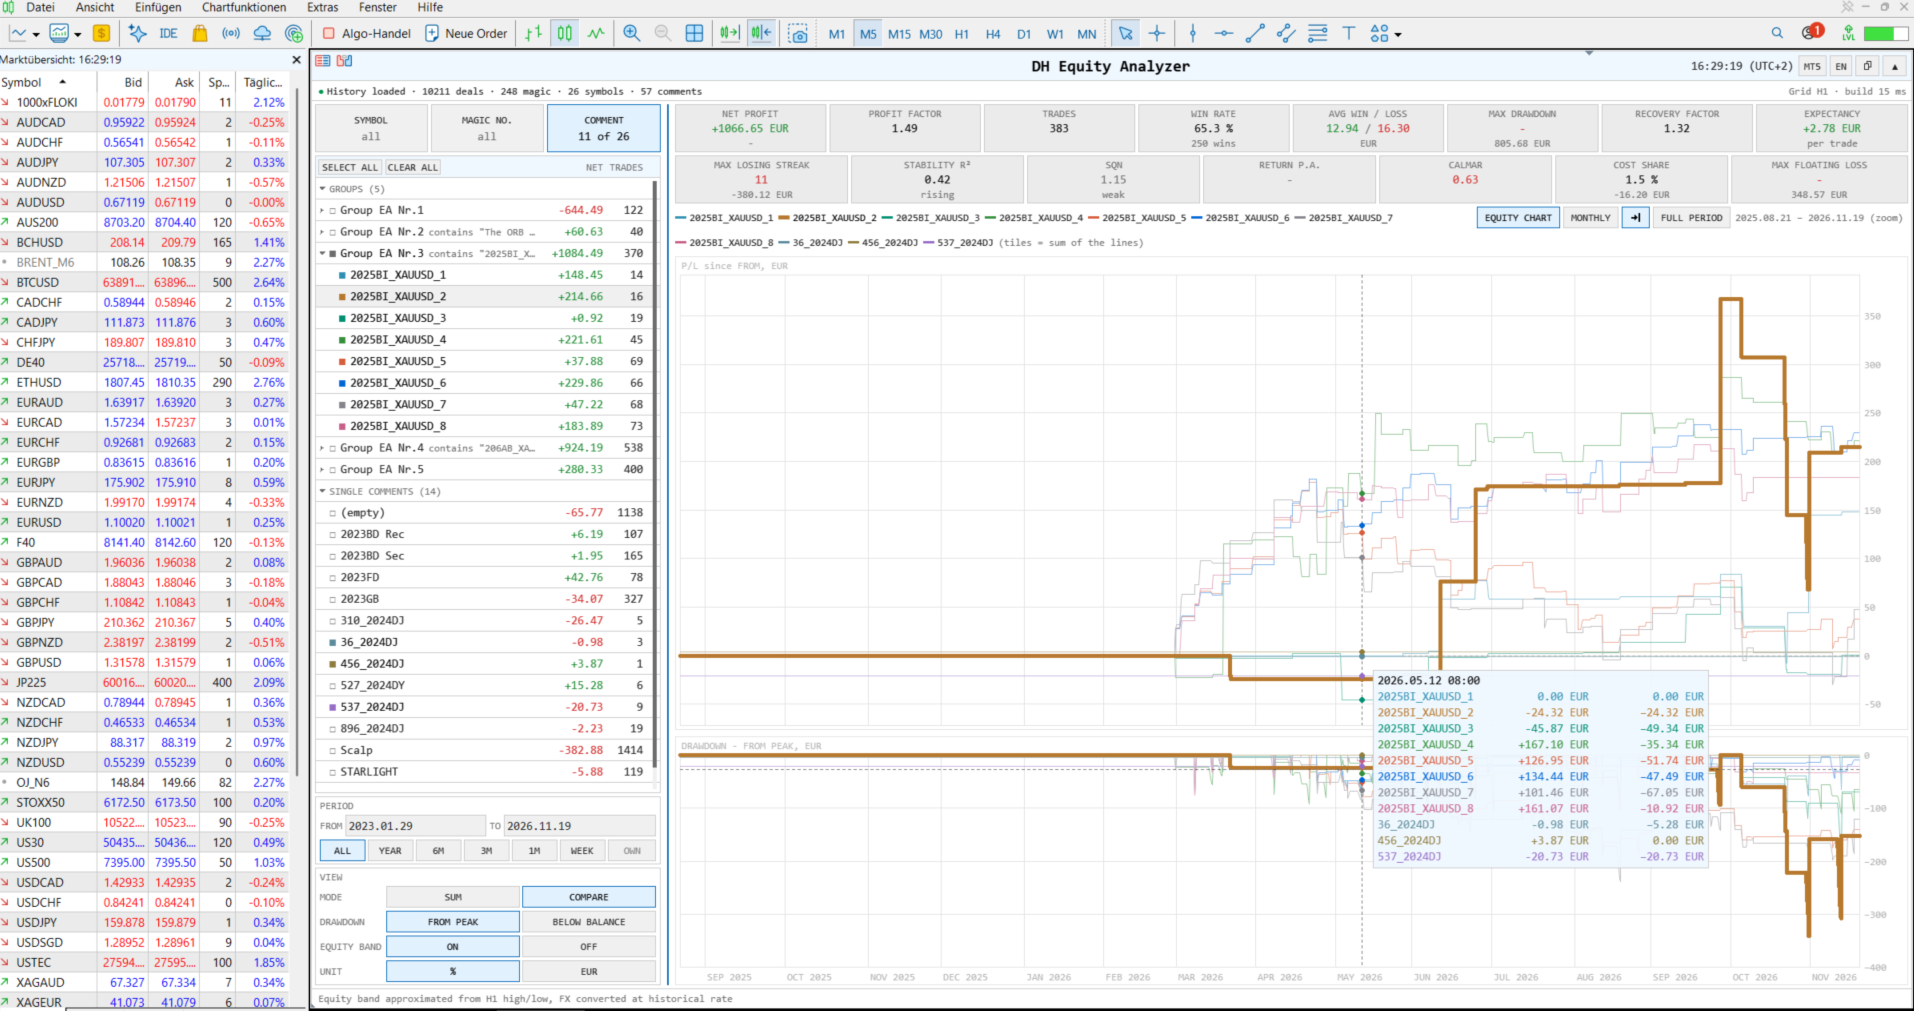
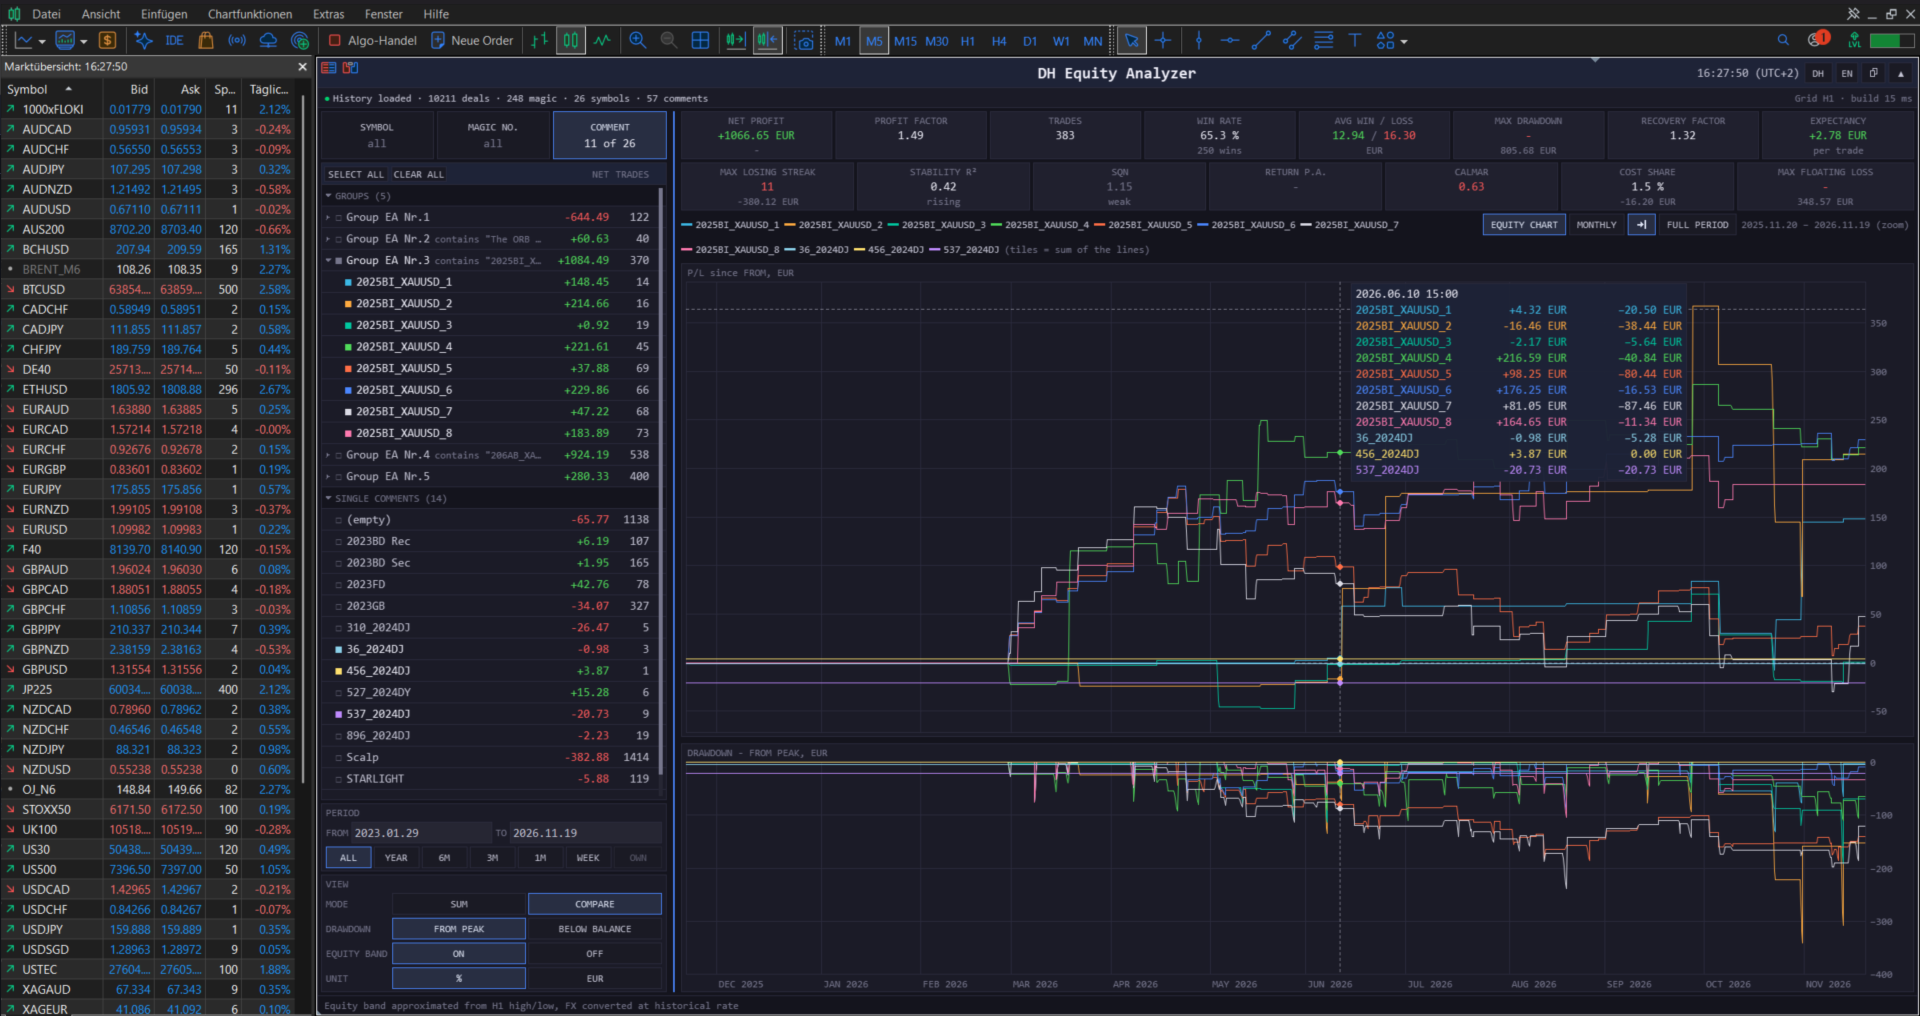
The chart shows the balance line of your selection and around it the equity band from the candle history. Below, a second chart shows the drawdown, either from the previous peak or as the floating loss below balance. Both charts can be displayed in percent of the starting capital or in account currency. Moving the mouse over the curve shows date, balance, equity range and drawdown at this point; the mouse wheel zooms, dragging scrolls.
In compare mode, up to twelve selections of the active tab are drawn as separate curves in their own colors, for example all Expert Advisors of the account side by side. The monthly table shows the result of each month and year.
Above the chart, tiles show the key figures of the selection in the period: net profit, profit factor, number of trades, win rate, average win and loss, max drawdown, recovery factor, expectancy per trade, longest losing streak, stability of the balance curve, SQN, return per year, Calmar ratio, cost share of commission and swap, and the largest floating loss. Each tile can be hidden.
The dashboard is available in English and German, in its own colors or in those of the terminal; it can be moved, resized and collapsed to a header bar.
Enjoy your analysis!