Mihenk Signal Scanner Pro
- Indicatori
-
Oguzhan Senturk
 Algorithmic Trading Systems Developer
I develop automated trading systems and risk-control tools for MetaTrader 5. I do not see a trading system as a strategy alone. Research, order execution, position management, account protection and the user interface all need to work as one coherent system. - Versione: 1.0
How does your entry idea perform on your chosen market and timeframe? Mihenk is a free MetaTrader 5 indicator that brings signal testing, chart analysis and multi-symbol scanning into one panel. Adapt predefined entry rules to your strategy, compare their historical behaviour and follow your chosen signal live.
Choose, adjust and test your entry idea
Signal test offers 19 configurable entry rules in four groups: indicators, candlestick patterns, breakout and trend, and liquidity sweeps. Use RSI turn to evaluate a return from an overbought or oversold zone, Moving average cross for a moving-average crossover, or Engulfing candle for an engulfing pattern. Compare other approaches, including Pullback in a trend and Liquidity sweep, on the same chart.
Select a rule and change its periods and thresholds with the + and - buttons. Choose the buy/sell direction, EMA200 trend filter and number of bars to measure after the signal. Mihenk describes your selection in a clear sentence and automatically updates the measurement when settings change. For example, adjust an RSI threshold to see how the sample count and historical result change.
In Details, read the sample count, average price movement after spread and the commission you enter, and its position relative to 1,000 random comparison series drawn from the same chart history. Intraday measurements match similar time-of-day windows. The score is not a win rate: 90/100 means the measured historical average is higher than approximately 90 percent of the random series. Assess rules using historical measurements as well as their visual appearance.
Follow your chosen signal live
Enable On: arrows + alert under LIVE WATCH. Buy/sell arrows remain on the chart when you switch tabs, and your enabled notification channels alert you when a new signal bar closes. Use the rule you evaluated historically for your daily monitoring on the same chart.
Read price movement in context with LastLeg
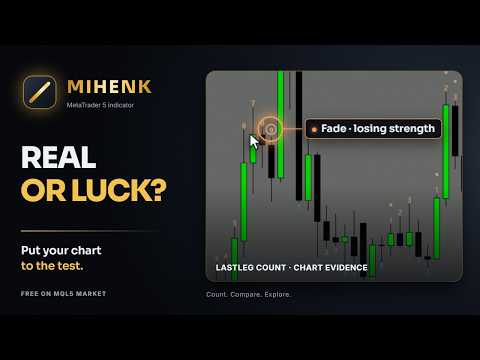
LastLeg helps you see the stage of a move and how it maintains its strength. It compares each close with the close four bars earlier; 9 forms when the condition in the same direction holds for nine consecutive bars. Push and Fade distinguish maintained strength from weakening in the final part of the move. Drain counts closes that meet a condition relative to the high/low two bars earlier; this count need not be consecutive and reaches 13 when an additional completion condition is met.
The leg clock and progress bar help you follow the process. Stretch, Pace and Rarity show extension, pace and rarity relative to previous legs. Origin and Invalidation levels provide structural references; Echo marks the start of an opposite-direction move after a new 9 that follows 13. Read the historical comparison alongside this information to assess the move in greater context.
Scan markets from one panel
Use Scanner to scan up to 60 symbols from Market Watch or your own list, choosing a timeframe from M15, H1, H4 and D1. Compare LastLeg events and how recently they occurred to decide which chart to inspect. Click a row to open the corresponding chart and focus your analysis without opening symbols one by one.
Evaluate your stop and target plan on the chart
In Trade test, choose the buy/sell direction and drag the hypothetical stop and target lines. View reward/risk, stop distance and costs as a share of risk. Examine which level historical entries reached first using distances scaled to comparable volatility; when both levels are touched within the same bar, the measurement conservatively counts the stop. Compare your planned distances with historical price behaviour.
Get started
Add Mihenk to a chart, select a rule in Signal test and inspect the Details results, then enable LIVE WATCH. The ? button opens an illustrated 11-page guide; hover over chart markers to read short explanations. Confirmed counts and rule signals are based on closed bars.
English, Turkish, German, Spanish, Portuguese, Russian and Chinese are supported. The appearance adapts to light/dark charts, and panel sounds are optional. Mihenk is free. For questions, send a private message through MQL5.
Mihenk is an analysis and decision-support tool, not investment advice. Historical measurements do not guarantee future results. Trading decisions and risk management remain the user’s responsibility.