CurrencyStrength 8 Currencies RSI Ranking MT5

  • Indicateurs
  • Naoto Shimoda
    Naoto Shimoda
    • MetaTrader 4/5 Indicator & EA Developer à  FX.Hamrat
    • Japon
    • 766
    FX.Hamrat - MetaTrader 4/5 indicator and Expert Advisor developer based in Japan.
    Over 10 years of trading experience (discretionary and systematic), and 90+ MT4/MT5 programs built so far - including 30+ custom-made projects for individual traders.
  • Version: 5.3
  • Activations: 10

Which currency is strong right now — in one panel.

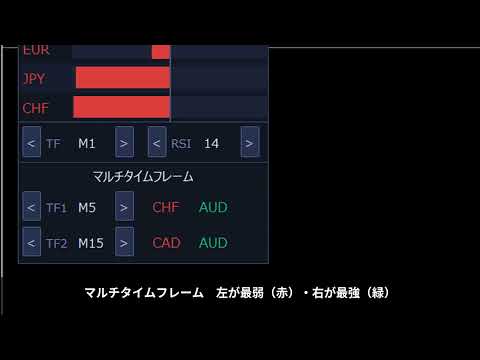
CurrencyStrength takes the RSI of the 28 pairs of USD, EUR, JPY, GBP, AUD, CHF, CAD and NZD, turns it into a score from −100 to +100 for each currency, and shows them as bars, strongest first.

Features

  • Strength ranking: strong currencies in green, weak ones in red, scored from −100 to +100.
  • Automatic symbol detection: the pairs are found from each symbol's base and profit currency, so suffixes and prefixes (EURUSD#, EURUSD.pro, m.EURUSD, EURUSDmicro ...) need no settings. When a pair exists twice, the one named like the chart symbol is used.
  • Panel buttons: change the timeframe (M1 to MN) and the RSI period on the panel.
  • Multi-timeframe: up to two extra timeframes, each showing its strongest and weakest currency.
  • Agreement frame: when all timeframes agree, the strongest gets a gold frame and the weakest a red one.
  • Notifications: alert, e-mail and push when the strongest or weakest changes, or when all timeframes agree (the same kind at most once per 300 seconds, adjustable).
  • Movable panel: drag the title to move it, click it to fold. Position and panel settings are remembered per chart.
  • Your own currency list: 2 to 12 currencies, including gold, silver and crypto — add XAU, XAG, BTC, ETH (or GOLD, SILVER at some brokers). With only one pair (usually vs USD) the value is marked as reference.
  • Same value any time: the EMA smoothing is calculated over past bars, so the values do not depend on when you attached the indicator.
  • Light: recalculates only when a new bar opens (every second when "current bar" is selected), and redraws only what changed.

How it is calculated

RSI (0–100) → (RSI − 50) / 50, added to the base currency and subtracted from the quote currency, averaged per currency, smoothed with an EMA, then scaled so that the strongest currency is +100 and the weakest −100. By default the last closed bar is used.

Inputs (main)

  • RSI period, smoothing (EMA), bar used, timeframe, extra timeframes 1 and 2, currency list
  • Notifications on/off, kinds (change / agreement), alert, e-mail, push, interval
  • Colors, transparent background, font size, panel position

In the Strategy Tester

The ranking and the panel work when the tester has the history of the other pairs. Notifications are written to the log only.

This indicator shows the relative strength of currencies. It does not trade, does not give investment advice and does not promise any results.
Produits recommandés
Market Sentry
Joas Da Silva Veiga
Market Analysis, Market Structure, Price Action, Trend Analysis, Bullish, Bearish, Range Market, Directional Bias, Market Dashboard, Trading Dashboard, Trend Detection, Market Scanner, Market Context, Breakout Analysis, Consolidation Analysis, Trend Filter, Technical Analysis, Real Time Analysis This indicator analyzes price behavior in real time and classifies market conditions into Bullish , Bearish , Range , and Neutral scenarios. Price is continuously evaluated relative to a dynamic referen
Aperçu Forex Strength Matrix HeatMap est un indicateur de carte thermique de la force des devises en temps réel qui calcule le pourcentage de variation entre 8 devises majeures (EUR, GBP, AUD, NZD, USD, JPY, CAD, CHF) par paires, et affiche visuellement leur force relative sur le graphique via un panneau matriciel 8×8. Consultez l'état de 28 paires de devises en temps réel en un coup d'œil. Le rouge indique une tendance haussière, le bleu indique une tendance baissière, et l'intensité de la coul
GDS Renko Entry Helper - Free Renko Price Interaction Indicator for MetaTrader 5 GDS Renko Entry Helper is a free Renko price interaction indicator for MetaTrader 5. It helps traders highlight important areas where price reacts, slows down, returns to a zone or changes behavior around support and resistance. The tool is designed for manual Renko analysis. It does not generate buy or sell signals and does not tell the trader when to enter the market. Its purpose is to help focus attention on area
EurUsd PRO
German Pablo Gori
EUR/USD PRO — Institutional Composite Indicator A professional-grade indicator optimized specifically for EUR/USD, integrating institutional analysis concepts into a single tool. This system combines DXY MTF analysis, session-based VWAP, ADR/ATR metrics, market structure (BOS/CHOCH), SMC (FVG/OB), cross-asset correlations, and a confluence panel with a floating signal. It features a Neumorphic UI with movable panels, pip-calculated spread display, and structured logging. Designed for universal
True Visual Trend
Mariusz Piotr Rodacki
This indicator is not only for trading but also for learning , thanks to it, you can learn to identify trend, support and resistance. The video below shows an example of opening a position on gold only buy.  You've probably heard about trend theory, where higher highs and higher lows indicate an uptrend, and lower highs and lower lows indicate a downtrend. This indicator determines this trend. You just need to enter the minimum distance between bars.  Additionally : -Sound alert on trend chan
Fibrillar
Vitalii Zakharuk
It is very easy to use the Fibrillar indicator, since the simplest is to look at the chart and act according to the indications of the colored arrows. The algorithm takes into account the measurement of prices, and this method also focuses on measuring each of the price drops (H / C, H / O, LC, LO) - which gives more detailed information, but also more averaged. When calculating this indicator, logarithmic gains are first calculated at the closing price, which allows you to filter out the tren
Breakout Boxes with Volume Pressure This indicator automates the identification of key consolidation zones (Supply and Demand) based on Market Pivots and Volatility (ATR). Unlike standard support/resistance tools, this indicator provides a unique   Volume Pressure Analysis   inside every box, giving you insight into the battle between Buyers and Sellers before a breakout occurs. Key Features Automated Supply & Demand Zones:   Automatically detects significant Pivot Highs and Lows to draw dyna
Indicateur Crypto_Forex « Pendu et Marteau Inversé » pour MT5, sans repeint ni délai. - L'indicateur « Pendu et Marteau Inversé » est un indicateur très puissant pour le trading Price Action. - Il détecte les figures haussières de Marteau Inversé et baissières de Pendu sur le graphique : - Marteau Inversé haussier : signal par flèche bleue (voir images). - Pendu baissier : signal par flèche rouge (voir images). - Alertes PC et notifications mobiles. - Quatre styles de flèches de signal différen
Visual Volume Trend Analyzer Indicator
AL MOOSAWI ABDULLAH JAFFER BAQER
Visual Volume Trend Analyzer: Decode the Market's True Momentum Unlock the power of volume-price analysis with the Visual Volume Trend Analyzer, a sophisticated yet intuitive indicator designed to give you a clear edge in any market. While price charts show you what is happening, this tool reveals the force behind the moves. By meticulously analyzing the relationship between price changes and volume, the Visual Volume Trend Analyzer filters out market noise and pinpoints high-probability entry
The "MR Volume Profile 5" indicator is a charting tool that displays trading volume at different price levels rather than time intervals. A key concept in volume profile is the point of control (POC)—the price level with the highest volume traded during the session or time range. While tools like VWAP or OBV provide volume trends, the "MR Volume Profile 5" indicator offers granular detail about where the most market activity occurs at specific price levels. This makes it a more precise tool for
Pro Period Separators
Zhi Wen Software Development
Pro Period Separators For MetaTrader 5 The built-in period separators feature doesn’t allow users to specify the time period, so you can use this indicator to create advanced period separators, you can add daily, weekly, monthly, yearly separators on any time frame. Default Inputs DAILY SEPARATOR SETTINGS show daily separators  = Yes hour of the separators   = 04 minute of the separators   = 00 color of the separators   = Silver width of the separators   = 1 style of the separators   = STYLE_DOT
Currency Strength Meter is the easiest way to identify strong and weak currencies. This indicator shows the relative strength of 8 major currencies + Gold: AUD, CAD, CHF, EUR, GBP, JPY, NZD, USD, XAU. Gold symbol can be changed to other symbols like XAG, XAU etc. By default the strength value is normalised to the range from 0 to 100 for RSI algorithm: The value above 60 means strong currency; The value below 40 means weak currency; This indicator needs the history data of all 28 major currency
Spearman Rank with Alerts
Romer Javier Franco Lozada
Spearman Rank MTF – Momentum Oscillator with Trend Intelligence The Spearman Rank MTF is a powerful oscillator designed to measure trend strength and direction using a statistical approach based on Spearman's Rank Correlation . This indicator excels at detecting trend changes, key reversals, and overbought/oversold conditions with precision and clear visual cues. Key Benefits Multi-Timeframe (MTF) support – analyze higher timeframes without leaving your current chart. Dual smoothing modes –
DeMarker (DeM) indicator is another member of the Oscillator family of technical indicators. Traders use the index to determine overbought and oversold conditions, assess risk levels, and time when price exhaustion is imminent. This indicator shows DeMarker data from 9 currency pairs of your choice for all 9 timeframes. If a digital value of DeM is less or equal to DnLevel = 0.3 (or whatever number you decided to put), Green square appears. This is potentially an oversold condition and may be a
Break Even Momentums
Lutgardo Ernesto Flores Villalobos
The Break Even Momentum (BEM) indicator continuously measures the strength of buyers and sellers . When these forces become noticeably balanced and reach a momentary equilibrium, the indicator displays a signal. The signal may indicate the beginning or end of a trend, a super trend, the generation of subtle support or resistance, or points of  mean reversion . This strategy can be used for entry or exit trades. Furthermore, it allows for the identification of potential profit targets, whether
3-Level ZZ Semafor + Multi-Asset Dashboard — the only ZigZag indicator with a built-in scanner that tells you not just where a reversal is forming, but which pairs to trade right now. Stop switching between charts. Stop missing setups. The dashboard scans up to 8 symbols across 9 timeframes simultaneously and scores each one from -18 to +18 so you know in seconds where the strongest opportunities are — before you open a single chart. What makes this different Most ZigZag indicators show you one

Speed money
Aleksey Semenov
Speed ​​indicator. Determines the speed of price movement. An indispensable tool for scalpers. Thanks to its high-speed qualities, we now have the opportunity to assess the current situation in the market and manage to enter a deal at the exact time. This indicator can be used absolutely on any timeframe, on any trading instrument and on absolutely any securities market. They can determine the rate of price movement for a specific period. Its settings also include an additional filter that dete
VOLUME PROFILE SAF-XII Analyse Market Profile Professionnelle pour MT5 (L'indicateur idéal pour le trading de type Grid) QU'EST-CE QUE LE VOLUME PROFILE ? Le Volume Profile est un outil institutionnel qui affiche l'activité de trading à des niveaux de prix spécifiques, contrairement aux indicateurs de volume classiques qui montrent le volume en fonction du temps. Il révèle OÙ les transactions ont eu lieu, aidant ainsi à identifier : ZONES DE VALEUR (VAH/VAL) – Niveaux de prix où la majorité des
Color Candle Indicator. The indicator implements a breakout system using the channel. When price exits the gray channel, the candlestick color changes to the color corresponding to trend direction. Blue for growth, yellow color for fall. Bright colors denote coincidence of trend direction and direction of a candlestick. Dark colors correspond to the situation when the direction of a candlestick is opposite to trend.
Volume Profile Multiple — Profils de Volume Multiples avec Buffers pour le Trading Algorithmique Fatigué de redessiner le Volume Profile bloc par bloc, en devant tout recalculer à chaque changement de timeframe ? Volume Profile Multiple trace automatiquement plusieurs profils de volume consécutifs sur le graphique, révélant où l'intérêt institutionnel s'est réellement concentré dans chaque section du marché — et pas seulement sur la dernière plage visible. Ce que l'indicateur fait pour vous L'in
Visual Neptune Storm Surge indicator
AL MOOSAWI ABDULLAH JAFFER BAQER
Visual Neptune Storm Surge: Ride the Tides of Market Momentum Unleash the power of the ocean's force on your charts with the Visual Neptune Storm Surge indicator. Designed for traders who demand precision and clarity, this tool captures the raw energy of market volatility and translates it into clear, actionable trading signals. Stop guessing the trend and start trading with the confidence of a tidal wave at your back. For just $30, you can equip your trading arsenal with a sophisticated, yet i
Pips on Candles shows the number of pips involved in each candle on the chart. It is possible to set 3 different ranges for counting on each single candle via the RangeType parameter: With "HighLow" you count the pips present between the minimum and the maximum. The number is shown under each candlestick on the chart. With "OpenClose" you count the pips present between the opening and closing price of the candle. The number is shown under each candlestick on the chart. With "HighDistAndLowDist"
This indicator is a Multi-Timeframe Momentum & Volatility Suite . It is designed to act as a "Price Action Navigator," combining internal candle strength (momentum) with institutional volatility boundaries (ATR) to identify high-probability "Sniper" entries and exits. Instead of traditional moving averages that lag behind price, this indicator uses a Net Displacement Formula to show you where the smart money is pushing the market in real-time.
Overview: The US Dollar Index (DXY) is a key financial indicator that measures the strength of the US Dollar against a basket of six major world currencies. This index is crucial for traders and investors as it provides a comprehensive view of the overall market sentiment towards the US Dollar and its relative performance. All Products   |   Contact Composition: The DXY's composition is as follows: Euro (EUR): 57.6% Japanese Yen (JPY): 13.6% British Pound (GBP): 11.9% Canadian Dollar (CAD): 9.1%
FREE
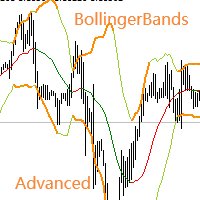
Necessary for traders: tools and indicators Waves automatically calculate indicators, channel trend trading Perfect trend-wave automatic calculation channel calculation , MT4 Perfect trend-wave automatic calculation channel calculation , MT5 Local Trading copying Easy And Fast Copy , MT4 Easy And Fast Copy , MT5 Local Trading copying For DEMO Easy And Fast Copy , MT4 DEMO Easy And Fast Copy , MT5 DEMO Advanced Bollinger Bands: 1. The Bollinger rail will change color with the direction" 2. The
FREE
GDS Renko Pip ST Chart - Pip-Based Renko Chart Indicator for MetaTrader 5 GDS Renko Pip ST Chart is a pip-based Renko chart indicator for MetaTrader 5. It helps traders build and study cleaner Renko price movement using a practical fixed pip or point-based brick structure. This tool is designed as a Renko chart foundation for manual analysis. It does not predict the market, does not generate buy or sell signals and does not decide whether a trade should be opened. Renko EDGE EA Golden Delta | A
Canal of shizukesa
Vincent Albert Feugier
Canal de SHIZUKESA – La Maîtrise de la Volatilité par la Kijun Le Canal de SHIZUKESA (Sérénité) est un outil d'analyse technique conçu pour les traders qui utilisent l'Ichimoku ou les moyennes de consensus. Contrairement aux bandes de Bollinger qui sont erratiques, ce canal est mathématiquement rigide : il clone la structure exacte de la Kijun-Sen pour identifier les zones de prix objectives. Points Forts & Fonctionnalités Structure de Clone Parfaite : Les bandes ne sont pas basées sur un écart-
Useful tool that will notify you when it detects a possible movement by volume input. Fundamentally in Futures. Detects areas of NO OFFER / NO DEMAND. Compare the volume of the candle in progress with the previous ones. If the volume has been decreasing, when the current contracts, surpass the previous one, ALERT! - It can be loaded in the main graphic or windows. - For any temporality. - It warns you with a pop-up window, on which graph the alarm went off. - When the pattern is de
Price Magnet — Price Density and Attraction Levels Indicator Price Magnet is a professional analytical tool designed to identify key support and resistance levels based on statistical Price Density. The indicator analyzes a specified historical period and detects price levels where the market spent the most time. These zones act as “magnets,” attracting price action or forming a structural base for potential reversals. Unlike traditional Volume Profile tools, Price Magnet focuses on price-time d
Japanese Candlestick Indicator
Alexander Denisovich Jegorov
Simple Japanese candlestick indicator Contains 3 patterns: - bearish engulfing - bullish engulfing - doji Only contains these 3 because after rigorous testing and trading (data) these seem to be the most efficient. Also contains: - alerts if enabled  When japanese candlestick is detected it is colored with relevant color depending on bias, and also shows label next to it. Labels: - BEG = Bearish engulfing - BE = Bullish engulfing - DO = Doji
Les acheteurs de ce produit ont également acheté
SMART TREND TRADING SYSTEM — OFFRE SPÉCIALE Votre système de trading. Votre EA d’automatisation. Votre formation et votre accompagnement. Achetez Smart Trend Trading System pour MT5 à 99 USD et recevez Smart Universal Expert Advisor GRATUITEMENT pour automatiser ses signaux. STTS réunit la direction de la tendance, les signaux d’entrée et de sortie, les zones de retournement et les niveaux de prix importants directement sur votre graphique. Suivez le système manuellement ou connectez l’EA inclus
Trend Sniper X
Sarvarbek Abduvoxobov
4.9 (39)
Trend Sniper X est un indicateur de suivi de tendance multi-unités de temps pour MetaTrader 5 qui aide les traders à identifier la direction de la tendance et les points d'inversion potentiels avec clarté et précision. pour MT4: https://www.mql5.com/en/market/product/193245 Informations sur le prix : Le prix actuel est un prix promotionnel et est susceptible de changer lors des prochaines mises à jour et nouvelles fonctionnalités. Offre bonus : Pour obtenir GRATUITEMENT l'Auto-Trade Assistant E
ARIPoint
Temirlan Kdyrkhan
1 (4)
ARIPoint is a powerful trading companion designed to generate high-probability entry signals with dynamic TP/SL/DP levels based on volatility. Built-in performance tracking shows win/loss stats, PP1/PP2 hits, and success rates all updated live. Key Features: Buy/Sell signals with adaptive volatility bands Real-time TP/SL/DP levels based on ATR Built-in MA Filter with optional ATR/StdDev volatility Performance stats panel (Success, Profit/Loss, PP1/PP2) Alerts via popup, sound, push, or email Cu
Zoryk Gold
Reda El Koutbane
5 (15)
ZORYK — Système avancé de signaux XAUUSD pour MetaTrader 5 Vous connaissez certainement cette sensation. Vous passez du temps à analyser l’or. Vous attendez le bon point d’entrée. Vous ouvrez enfin la position, puis le prix commence immédiatement à évoluer contre vous. Vous fermez trop tôt, déplacez le Stop Loss ou hésitez pendant quelques secondes. Ensuite, le marché atteint exactement l’objectif que vous aviez initialement prévu, mais sans vous dans la position. Le problème n’était pas toujour
SuperScalp Pro
Van Minh Nguyen
4.66 (35)
SuperScalp Pro - Professional Multi-Layer Confluence Scalping System SuperScalp Pro est un indicateur avancé de scalping qui améliore le Supertrend classique grâce à plusieurs filtres intelligents de confirmation. Il aide à identifier des opportunités de Buy/Sell présentant une probabilité plus élevée, tout en réduisant considérablement les faux signaux. Des flèches Buy et Sell claires apparaissent directement sur le graphique, tandis que les niveaux de Stop Loss et Take Profit basés sur l’ATR s
GoldenX Entry MT5
VividMind Digital Solutions
5 (16)
GoldenX Entry est un indicateur MT5 doté d’un algorithme adaptatif Smart Entry Trend, d’un système de scoring des signaux, d’un détecteur de régime de marché et d’un filtre de volatilité. Chaque signal inclut un niveau d’entrée calculé, trois niveaux de Take-Profit (TP1, TP2, TP3) ainsi qu’un niveau de Stop-Loss. Il est construit sur plusieurs couches analytiques conçues pour s’adapter à différentes conditions de marché, combinant un système analytique multicouche avec un optimiseur intégré et u
Gann Made Easy   est un système de trading Forex professionnel et facile à utiliser qui est basé sur les meilleurs principes de trading en utilisant la théorie de mr. WD Gann. L'indicateur fournit des signaux d'ACHAT et de VENTE précis, y compris les niveaux Stop Loss et Take Profit. Vous pouvez échanger même en déplacement en utilisant les notifications PUSH. VEUILLEZ ME CONTACTER APRÈS L'ACHAT POUR RECEVOIR GRATUITEMENT DES INSTRUCTIONS DE TRADING ET D'EXCELLENTS INDICATEURS SUPPLÉMENTAIRES! V
Neuro Poseidon MT5
Daria Rezueva
4.75 (52)
Neuro Poseidon is a new indicator by Daria Rezueva. It combines precise trading signals with adaptive TP/SL levels - creating best possible trades as a result! Message me and get  Neuro Poseidon Assistant  as a gift to automize your trading process! What makes it stand out? 1. Proven profitability on all assets and timeframes 2. Only confirmed BUY and SELL signals present on the chart 3. Adaptive TP & SL levels generated by the software for each trade 4. Easy to understand - suitable for al
SMC Intraday Formula
VividMind Digital Solutions
5 (26)
Commençons par être honnêtes. Aucun indicateur ne vous rendra rentable à lui seul. Si quelqu’un vous dit le contraire, il vous vend un rêve. Tout indicateur qui affiche des flèches parfaites d’achat/vente peut être rendu impeccable — il suffit de zoomer sur la bonne partie de l’historique et de capturer uniquement les trades gagnants. Nous ne faisons pas cela.  SMC Intraday Formula est un outil. Il lit la structure du marché pour vous, identifie les zones de prix à la probabilité la plus élevée
M1 Sniper MT5
Oleg Rodin
5 (7)
M1 SNIPER   est un système d'indicateurs de trading facile à utiliser. Il s'agit d'un indicateur à flèche conçu pour l'unité de temps M1. Cet indicateur peut être utilisé seul pour le scalping sur l'unité de temps M1 ou intégré à votre système de trading existant. Bien que conçu spécifiquement pour le trading sur l'unité de temps M1, ce système peut également être utilisé avec d'autres unités de temps. Initialement, j'avais conçu cette méthode pour le trading du XAUUSD et du BTCUSD. Cependant, j
La légende est de retour : Entry Points Pro 10. La relance de l'indicateur légendaire qui s'est maintenu 3 ans dans le Top-3 du MQL5 Market. Des centaines d'avis enthousiastes (589 sur les deux versions), des milliers de traders l'utilisent chaque jour, 31 000+ téléchargements de la démo   MT4+MT5 . J'ai lu chacun de vos avis publiés en cinq ans — et au lieu de promettre, j'ai intégré les réponses directement dans la version 10. Par un auteur présent sur les marchés depuis 1999, qui tient à l'ho
FiboSniper Pro
Van Minh Nguyen
5 (3)
FiboSniper Pro – Multi-Filter Fibonacci System with Auto SL/TP and Control Panel FiboSniper Pro est un indicateur technique qui combine des Fibonacci Envelopes dynamiques avec plusieurs filtres de confirmation afin de générer des signaux Buy et Sell sélectionnés. Les niveaux de Fibonacci sont calculés à partir de Moving Average et ATR, puis filtrés par ADX, EMA, RSI, ATR, Volume, Time et la structure des bougies. L’indicateur affiche directement sur le graphique les niveaux automatiques de Stop
Un nouveau Roi en ville - Indicateur + Gestion des ordres (TP1 + TP2 + TP3) + Envoi optionnel de signaux Telegram INCLUS (GRATUIT) (SYSTÈME COMPLET DE TRADING et DE SIGNAUX) Notre meilleur EA pour l’Or : Gold Slayer Cet indicateur inclut une stratégie avancée, un système de trading avec gestion des ordres personnalisable ainsi qu’un système de retour à la moyenne combinant des extensions d’enveloppes, soutenu par plusieurs filtres intelligents de confirmation comme le RSI afin de détecter des en
Auto Optimized SpeedAngle est un système de vectorisation du momentum de niveau institutionnel qui élimine l'ajustement de courbe ( curve-fitting ) grâce à une optimisation continue par avancement ( Walk-Forward Optimization , WFO). Plutôt que de s'appuyer sur des entrées statiques qui se dégradent lorsque les régimes de marché changent, l'indicateur recalibre dynamiquement ses paramètres en utilisant une validation hors échantillon ( Out-of-Sample , OOS), garantissant ainsi que les signaux affi
Unix Scalper
Issam Kassas
4 (4)
UNIX SCALPER — OFFRE SPÉCIALE Repérez la configuration. Consultez le plan. Choisissez comment intervenir. Achetez UNIX Scalper pour MT5 à 99 USD et recevez Smart Universal Expert Advisor GRATUITEMENT pour automatiser ses signaux. UNIX Scalper réunit l’analyse du marché, les décisions BUY/SELL/WAIT et les niveaux Entry, Stop Loss, TP1 et TP2 dans un panneau organisé. Suivez le plan de trading manuellement ou connectez l’EA inclus pour une exécution automatique selon vos paramètres. Le prix actuel
Welcome to ENTRY IN THE ZONE AND SMC MULTI TIMEFRAME / SPECIAL BENEFIT FOR OUR MQL5 CUSTOMERS  FREE ACCESS TO THE NEW TOOL —COMING SOON —   Learn More on Our Official Website : https://www.fableedge.net Entry In The Zone and SMC Multi Timeframe is a real-time market analysis tool based on Smart Money Concepts (SMC), designed to analyze market structure, price direction, and key trading zones. It supports both Single-Timeframe Analysis and Multi-Timeframe Analysis, providing a clearer view of the
Tokyo mt5 Indicator
Vasiliy Strukov
5 (2)
Le Tokyo Indicator offre une vue d'ensemble visuelle et claire de l'orientation de la tendance, des signaux de trading potentiels et des conditions du marché. Sa ligne de tendance en escalier, codée par couleur, distingue les phases haussières (en bleu) des phases baissières (en magenta). Des flèches directionnelles associées mettent en évidence les opportunités d'achat et de vente potentielles lors des changements de tendance. Un tableau de bord intégré regroupe le signal actuel, l'orientation
Atomic Analyst MT5
Issam Kassas
4.47 (60)
ATOMIC ANALYST — OFFRE SPÉCIALE Votre analyse de marché. Votre EA d’automatisation. Votre formation et votre accompagnement. Achetez Atomic Analyst pour MT5 à 99 USD et recevez Smart Universal Expert Advisor GRATUITEMENT pour automatiser ses signaux. Atomic Analyst réunit l’action des prix, la direction de la tendance, les signaux d’entrée et de sortie, le Stop Loss et plusieurs niveaux de Take Profit directement sur votre graphique. Tradez manuellement à l’aide de son analyse ou connectez l’EA
SMART PRICE ACTION CONCEPTS — OFFRE SPÉCIALE Observez la structure. Identifiez les zones. Construisez votre plan de trading. Achetez Smart Price Action Concepts pour MT5 à 49 USD et recevez Smart Universal Expert Advisor GRATUITEMENT. Réunissez Smart Money Concepts (SMC), analyse de style ICT et action des prix sur un graphique organisé. Identifiez la structure du marché, les blocs d’ordres, les niveaux de référence de liquidité et les déséquilibres, puis choisissez les éléments à afficher avec
Power Candles MT5
Daniel Stein
4.58 (12)
Power Candles V3 - Indicateur de force à optimisation automatique Power Candles V3 transforme la force des devises et des instruments en un plan de trading exploitable sur chaque graphique auquel il est associé. Au lieu de se contenter de colorer les bougies, il effectue une optimisation automatique en temps réel en arrière-plan et vous fournit les meilleurs niveaux de Stop Loss, Take Profit et seuils de signal pour le symbole que vous avez sous les yeux. Un simple clic suffit pour l'adopter en
FX Trend MT5 NG
Daniel Stein
5 (6)
FX Trend NG : La Nouvelle Génération d’Intelligence de Tendance Multi-Marchés Vue d’ensemble FX Trend NG est un outil professionnel d’analyse de tendance multi-timeframe et de surveillance des marchés. Il vous permet de comprendre la structure complète du marché en quelques secondes. Au lieu de naviguer entre de nombreux graphiques, vous identifiez immédiatement quels instruments sont en tendance, où le momentum s’affaiblit et où plusieurs unités de temps sont alignées. Offre de Lancement – Ob
Adaptive Price Action Engine Achetez un indicateur, obtenez l'EA gratuitement Analyse auto-optimisée des tendances et des figures de chandeliers Multi-Timeframe Les marchés évoluent constamment, et tous les modèles de Price Action n’ont pas la même valeur dans toutes les conditions de marché. Adaptive Price Action Engine a été conçu pour s’adapter aux changements du marché en combinant structure de tendance, analyse Multi-Timeframe, figures de chandeliers et optimisation statistique au sein d’un
FX Power MT5 NG
Daniel Stein
5 (33)
FX Power : Analysez la force des devises pour des décisions de trading plus intelligentes Aperçu FX Power est l'outil essentiel pour comprendre la force réelle des principales devises et de l'or, quelles que soient les conditions du marché. En identifiant les devises fortes à acheter et les faibles à vendre, FX Power simplifie vos décisions de trading et révèle des opportunités à forte probabilité. Que vous suiviez les tendances ou anticipiez les retournements à l'aide de valeurs extrêmes de D
Market Structure Order Block Dashboard MT5 est un indicateur MT5 conçu pour les traders qui veulent lire la structure de marché et les principales zones de réaction du prix directement sur le graphique. Il combine BOS, ChoCH, Order Blocks, Fair Value Gaps (FVG), Liquidité, Kill Zones, Volume Profile, et un dashboard compact pour une analyse rapide. Cet indicateur s'adresse aux traders qui utilisent la structure de marché, les concepts ICT et Smart Money comme cadre de décision. Il peut aider à r
Currency Strength Wizard   est un indicateur très puissant qui vous offre une solution tout-en-un pour un trading réussi. L'indicateur calcule la puissance de telle ou telle paire de devises en utilisant les données de toutes les devises sur plusieurs périodes. Ces données sont représentées sous la forme d'un indice de devise facile à utiliser et de lignes électriques de devise que vous pouvez utiliser pour voir la puissance de telle ou telle devise. Tout ce dont vous avez besoin est d'attacher
M1 Quantum MT5
Hamed Dehgani
4.2 (10)
Signaux de Trading en Direct avec M1 Quantum : Signal   (L’opération est exécutée automatiquement par le Quantum Trade Assistant , inclus gratuitement avec ce produit.) Dernières nouvelles : La version 1.64 a été publiée. Toutes les transactions disposent désormais d’un Stop Loss placé derrière les zones de support/résistance correspondantes. La fonction Smart Close a également été améliorée afin d’augmenter les performances de l’EA dans cette version. Depuis le 9 août, le signal en direct fonc
PZ Trend Trading MT5
PZ TRADING SLU
3.8 (5)
Capture every opportunity: your go-to indicator for profitable trend trading Trend Trading is an indicator designed to profit as much as possible from trends taking place in the market, by timing pullbacks and breakouts. It finds trading opportunities by analyzing what the price is doing during established trends. [ Installation Guide | Update Guide | Troubleshooting | FAQ | All Products ] Trade financial markets with confidence and efficiency Profit from established trends without getting whips
Scalper Vault   est un système de scalpage professionnel qui vous fournit tout ce dont vous avez besoin pour un scalpage réussi. Cet indicateur est un système de trading complet qui peut être utilisé par les traders de forex et d'options binaires. Le délai recommandé est M5. Le système vous fournit des signaux fléchés précis dans le sens de la tendance. Il vous fournit également des signaux supérieurs et inférieurs et des niveaux de marché Gann. Les indicateurs fournissent tous les types d'alert
Smc Pro ToolKit
Talal N Z Aljarusha
5 (13)
SMC PRO TOOLKIT — SMART MONEY ANALYSIS & STRUCTURED TRADE PLANNING SMC Pro ToolKit is a professional Smart Money Concepts analysis workspace for MetaTrader 5. It combines market structure, multi-timeframe analysis, institutional price zones, setup evaluation, confirmation tools, volume context, alerts, and risk planning inside one organized chart environment. One workspace. Multiple layers of confirmation. One structured trading plan. OPEN COMPLETE USER GUIDE MULTI-CONDITION SETUP ENGINE At
Divergence Bomber
Ihor Otkydach
4.89 (94)
Chaque acheteur de cet indicateur reçoit également gratuitement : L’outil exclusif « Bomber Utility », qui accompagne automatiquement chaque opération de trading, fixe les niveaux de Stop Loss et de Take Profit, et clôture les positions selon les règles de la stratégie Des fichiers de configuration (set files) pour adapter l’indicateur à différents actifs Des set files pour configurer le Bomber Utility selon différents modes : « Risque Minimum », « Risque Équilibré » et « Stratégie d’Attente »
Plus de l'auteur
See the Dow Theory direction of six timeframes in one panel. DowgatorPro2 judges the current trend direction (up or down) automatically by Dow Theory, using closed bars only. It carries over the features of the earlier e-DowgatorPro and puts first that even a beginner can read the direction without confusion. The direction of six timeframes (M1 to D1) is shown on the panel in color. Features Check direction mismatch: see on the panel whether your chart's timeframe agrees with the higher timefram
The levels of higher timeframes, on the chart you are watching. LineTraderPro2 finds swing highs and lows with Dow Theory rules and draws horizontal lines at the levels the market watches, for any of 20 timeframes from M1 to W1. Each line is labeled with its timeframe (H1, D1 and so on) and the date of the swing, so you can see at a glance which timeframe a level belongs to without switching charts. What you see on the chart Horizontal lines: the swing highs above the price and the swing lows be
See the market's fear level on the chart you trade. VixChecker shows the VIX (the volatility index often called the fear index) in a sub-window as one bar per day, colored by level: normal (blue), caution (yellow, 20 or above by default) and fear (red, 30 or above). The current value, the change from the previous close and the time of the value are shown in a small panel, and the value can also be shown on the main chart. Where the VIX values come from (please read before buying) The indicator d
Round numbers on your chart, and a notice when the price gets close. RoundNumberAlert draws horizontal lines at round numbers (150.000, 150.500 ...) and watches them for you. When the price enters the touch range, only that line blinks and you get one notification. Major round numbers stand out in gold, and a small panel shows how many pips are left to the next round number above and below. Features Round-number lines: the step starts at 10 pips (for example 50 pips: 150.000, 150.500 ...). Major
Entry signals as finger marks: yellow for trend-following, pink for counter-trend. SignRAMB combines RSI, ATR, MACD, a moving average, Dow theory and the candles, and marks the places where the price may turn up or down, based on past chart patterns. A finger pointing up is a buy, pointing down is a sell. Signals are decided on closed bars and never repaint. Signals are not always right. Use them as one indicator, together with your own reading of the chart. They are meant for the move right aft
Which currency is strong right now — in one panel. CurrencyStrength takes the RSI of the 28 pairs of USD, EUR, JPY, GBP, AUD, CHF, CAD and NZD, turns it into a score from −100 to +100 for each currency, and shows them as bars, strongest first. Features Strength ranking: strong currencies in green, weak ones in red, scored from −100 to +100. Automatic symbol detection: the pairs are found from each symbol's base and profit currency, so suffixes and prefixes (EURUSD#, EURUSD.pro, m.EURUSD, EURUSDm
See the Dow Theory direction of six timeframes in one panel. DowgatorPro2 judges the current trend direction (up or down) automatically by Dow Theory, using closed bars only. It carries over the features of the earlier e-DowgatorPro and puts first that even a beginner can read the direction without confusion. The direction of six timeframes (M1 to D1) is shown on the panel in color. Features Check direction mismatch: see on the panel whether your chart's timeframe agrees with the higher timefram
The levels of higher timeframes, on the chart you are watching. LineTraderPro2 finds swing highs and lows with Dow Theory rules and draws horizontal lines at the levels the market watches, for any of 20 timeframes from M1 to W1. Each line is labeled with its timeframe (H1, D1 and so on) and the date of the swing, so you can see at a glance which timeframe a level belongs to without switching charts. What you see on the chart Horizontal lines: the swing highs above the price and the swing lows be
Know exactly how long until the next release, and what came out. EconomicStopper shows the time to each economic release as a countdown, lists the upcoming events with their importance, and shows the actual value and the surprise against the forecast after the release. Everything is in one panel on the chart. It reads the economic calendar built into MetaTrader 5, so it needs no DLL and no web requests. How it behaves over time More than 5 minutes before: the timer counts down every second and t
See the market's fear level on the chart you trade. VixChecker shows the VIX (the volatility index often called the fear index) in a sub-window as one bar per day, colored by level: normal (blue), caution (yellow, 20 or above by default) and fear (red, 30 or above). The current value, the change from the previous close and the time of the value are shown in a small panel, and the value can also be shown on the main chart. Where the VIX values come from (please read before buying) The indicator d
Round numbers on your chart, and a notice when the price gets close. RoundNumberAlert draws horizontal lines at round numbers (150.000, 150.500 ...) and watches them for you. When the price enters the touch range, only that line blinks and you get one notification. Major round numbers stand out in gold, and a small panel shows how many pips are left to the next round number above and below. Features Round-number lines: the step starts at 10 pips (for example 50 pips: 150.000, 150.500 ...). Major
Entry signals as finger marks: yellow for trend-following, pink for counter-trend. SignRAMB combines RSI, ATR, MACD, a moving average, Dow theory and the candles, and marks the places where the price may turn up or down, based on past chart patterns. A finger pointing up is a buy, pointing down is a sell. Signals are decided on closed bars and never repaint. Signals are not always right. Use them as one indicator, together with your own reading of the chart. They are meant for the move right aft
Filtrer:
Aucun avis
Répondre à l'avis