Gold moving averages flow b

【Gold MA Flow No.2 · Gold M3 · Live-Verified Edition】

One parameter set that fits every account — from small capital to full size.

Why choose it?

One parameter set, full-cycle backtesting: proven through COVID, the Russia-Ukraine conflict, Fed rate hikes and gold's historic bull run — not a "pretty curve" cherry-picked from the easy times.
The results speak for themselves: starting from just $200, the 2019–2026 seven-and-a-half-year backtest returned $4618.74 net profit with a Recovery Factor of 18.75 — a growth of roughly 20× on the account. And it all comes from the logic below.
Multi-period MA flow + 5-layer trend confirmation: a whole family of moving averages shows you where the money flows — ride trends with conviction, bank steady small wins and keep exposure light when the market chops.
Dynamic position sizing + 5-tier take-profit + trailing stop: profits are locked in by stages, and the stronger the move, the better your floating profit is protected; counter-trend averaging lowers cost and keeps dry powder for the reversal.
Bank-grade verification: backtested on the strictest every-tick real-time-point model, then cross-validated across four modes — Open Prices Only / 1-Minute OHLC / Every Tick / Real Ticks — with consistent results. No future functions, no look-ahead bias: what the backtest shows is what live trading gets.
Ready to trade out of the box: fully automated risk and position management — install and run, not a half-finished test build.
Works with every account type — however small your capital

Worried this EA is only built for big accounts? Don't be. Standard, micro and even cent accounts are all supported, with identical strategy logic — it simply matches itself to your account type.

How to use (3 steps)

Drop the EA into MT5's Experts folder;
Open a M3 chart of GOLDm# (micro gold) or GOLD# / XAUUSD (standard gold) and drag the EA onto it;
Start with a deposit of $20–2,000 (or adjust to your own level). Observe on a demo account first, then go live with small capital.
After-sales & going further

Need more optimized configurations after purchase? Contact the author and get them free of charge — keep several setups ready for different market conditions.
Or run the MT5 Strategy Tester yourself — the next "golden setup" might be the one you discover.
Launch offer: 30% off — full price returns after 10 licenses are sold.

Past backtest performance does not guarantee future results. Trading involves risk — size your positions responsibly.
Altri dall’autore
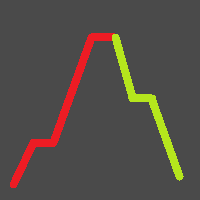
根据高开低收价格确定反转点位,画出的极点折线。 The pole polyline is drawn according to the high opening and low closing price to determine the reversal point. 参数(Args): 1.周期数(Period)。参与界限计算的K柱数量。 2.界限(Divide)。计算方式包括:         t1,顺高低价 (Buy min H,Sell max L)           t2,逆高低价 (Buy min L,Sell max H)           t3,收盘价 (Buy min C,Sell max C)           t4,开盘价 (Buy min O,Sell max O)           t5,高开低收价的一半 (HOLC/2)           t6,高开低收价的一半+1 (HOLC/2+1)           t7,高开低收价的一半+2 (HOLC/2+2) 3.跨越界限使用的价格(Price)。包括收盘价(C)和高低价(HL) 4.偏移(Of
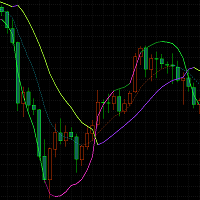
A cross - track indicator that visually shows the current bullish/bearish trend of the market through the midline (mid track), main line (upper track), and sub-lines (lower track). Intersections or upper rail turns can be used as buying and selling positions. Parameter description: period:10 price: WEIGHTED //HIGH //LOW //OPEN //CLOSE //MEDIAN //TYPICAL //AVERAGE //WEIGHTED method:Linear weighted //Simple //Exponential //Smoothed // Linear weighted main offset:1.5 sub offset:1 base:2 counts add
K线极点轨道UD 【input 参数】 InpMyMagic: 幻数 InpShowPanel: 是否展示面板 InpOneLot: 开单量1份[最大99.99](=0最小手,>0固定手,<0>=-1净亏比,<-1净余最小亏比) InpAllLot: 总净单量,100%(=0最小手,>0固定手,<0>=-1净亏比,<-1净余最小亏比) InpLotMaxMoney: 开单量计算的最大金额(=0不管,>0超过该值即限制为该值,<0超过整数值即限制为小数倍数) InpLot1Dot1Money: 开单1手变化1点时金额变化值。(<=0自动计算(美元),>0指定) InpDotBig: 大间隔点值(>=0点值,<1三位数点差均,<0整均比) InpDotSml: 小间隔点值(>=0点值,<1三位数点差均,<0整均比) ==========   UD   ========== InpUDType: 类型(=0不开,=1常规,=4偏极,=6平台,=8慢跟,=10超前,=12跟随) InpMinWidth: 上下轨宽度最小值(>=0点值,<1三位数点差均,<0整均比) InpHTurnThr
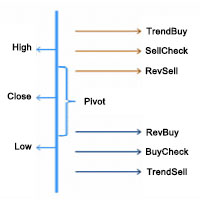
In the Forex trading system, the Pivot Points trading method is a classic trading strategy. Pivot Points is a very simple resistance support system. Based on yesterday’s highest, lowest and closing prices, seven price points are calculated, including one pivot point, three resistance levels and three support levels. The resistance line and the support line are one of the tools that are often used in technical analysis, and the role of the support line and the pressure line can be mutually trans
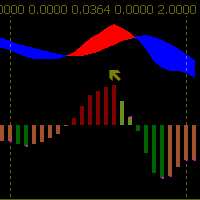
Type(1EMA,2DEMA,3TEMA) FastPeriod SlowPeriod SignalPeriod PriceApplied ( HIGH(H) LOW(L) OPEN(O) CLOSE(C) MEDIAN(HL) TYPICAL(HLC) WEIGHTED(HLCC) ) Deviate Up Deviate Down Deviate Bar What Is Moving Average Convergence/Divergence (MACD)? Moving average convergence/divergence (MACD, or MAC-D) is a   trend-following   momentum   indicator that shows the relationship between two   exponential moving averages (EMAs)   of a   security’s   price. The MACD line is calculated by subtracting the 26-peri
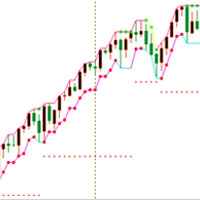
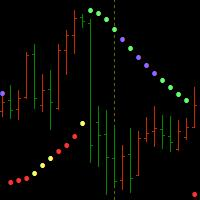
The parabolic SAR indicator, developed by J. Welles Wilder Jr., is used by traders to determine trend direction and potential reversals in price. The technical indicator uses a trailing stop and reverse method called "SAR," or stop and reverse, to identify suitable exit and entry points.  The parabolic SAR indicator appears on a chart as a series of dots, either above or below an asset's price, depending on the direction the price is moving. A dot is placed below the price when it is trending u
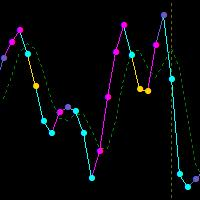
What Is the Relative Vigor Index? The Relative Vigor Index (RVI) is a   momentum indicator   used in technical analysis that measures the strength of a trend by comparing a security's closing price to its trading range while smoothing the results using a   simple moving average   (SMA). The RVI's usefulness is based on the observed tendency for prices to close higher than they open during uptrends, and to close lower than they open in downtrends. KEY TAKEAWAYS The Relative Vigor Index (RVI) is a
【Gold MA Flow No.2 · Gold M5 · Live-Verified Edition】 One parameter set that fits every account — from small capital to full size. Why choose it? One parameter set, full-cycle backtesting : proven through COVID, the Russia-Ukraine conflict, Fed rate hikes and gold's historic bull run — not a "pretty curve" cherry-picked from the easy times. Multi-period MA flow + 5-layer trend confirmation : a whole family of moving averages shows you where the money flows — ride trends with conviction, bank ste
MA Flow No.2 See the Flow of Bulls & Bears at a Glance, and Keep the Rhythm of the Market in Your Hands Tired of staring at dozens of moving averages until your eyes blur? Unsure when to enter, or where to place your stop? MA Flow No.2 upgrades the humble moving average into a complete trend-trading system. No more scattered lines on your chart — instead, a living "river of bulls and bears". Up to 100 moving averages roll together in real time. On every single bar, you can see at a glance w
Filtro:
Nessuna recensione
Rispondi alla recensione