Market Structure Evaluator MTF Advanced

Advanced Market Structure Evaluator MTF Advanced 

Advanced Smart Money Concepts & Volume Profile Suite for MetaTrader 5

Stop Guessing Whether a Breakout Is Real

Market Structure Evaluator Advanced automatically detects Breaks of Structure (BOS) and Changes of Character (CHOCH) across multiple timeframes while combining them with Volume Profile (POC, VAH, VAL) to identify where market structure and volume align.

Designed for both discretionary and algorithmic traders, it provides a complete framework for identifying trend continuation, reversals, key value areas, and potential trade exits, all within a single indicator.


Key Features

Feature Question Answered
Sequential BOS/CHOCH Detection "Is price breaking structure or changing character?"
Multi-Timeframe Dashboard "Are other lower/higher timeframes aligned with my trade?"
Volume Profile (POC/VAH/VAL) "Where is fair value and where are key support/resistance zones?"
VAH/VAL Exit Signals "When should I consider taking profits?"
EA-Accessible Buffers "How can I automate my trading strategy?"
MTF Performance Toggle "How can I reduce CPU usage when multi-timeframe analysis isn't needed?"
Volume Profile Modes "Should Volume Profile follow trading sessions or a rolling lookback?"


What Makes It Different?

Many Smart Money indicators simply compare the latest swing highs and lows. Market Structure Evaluator MTF Advanced processes price action sequentially, maintaining market structure state bar-by-bar before confirming BOS or CHOCH.

Combined with integrated Volume Profile analysis, it provides additional context that standalone market structure indicators cannot offer, helping traders distinguish between trend continuation, potential reversals, and moves back toward fair value.


Why Choose Market Structure Evaluator MTF Advanced?

Sequential Market Structure Engine

Unlike indicators that compare only the latest swing points, the evaluator tracks active swing highs and lows sequentially as new bars form, providing consistent and logical BOS and CHOCH detection.

Non-Repainting Confirmed Signals

Signals are confirmed only after a valid swing has formed. As with all fractal-based methods, swing confirmation requires the configured right-side fractal bars. Once confirmed, BOS and CHOCH signals remain fixed on the chart and do not repaint.

Market Structure + Volume Profile Confluence

Combine Smart Money Concepts with Volume Profile to identify where market structure aligns with the:

  • Point of Control (POC)
  • Value Area High (VAH)
  • Value Area Low (VAL)

This additional context helps identify stronger trading opportunities and potential reversal zones.

Flexible Volume Profile Modes

Choose the approach that best suits your trading style.

Mode Benefit
Session Profile Anchors Volume Profile to each trading session for session-based analysis.
Rolling Profile Uses a configurable fixed lookback period for continuous market analysis.

Highly Configurable

Adapt the indicator to your own trading style with:

  • Adjustable left and right fractal periods
  • Candle Close or Wick Break confirmation
  • Custom colours, labels and line styles
  • Historical signal plotting
  • Flexible dashboard configuration
  • Multiple alert options

Performance Optimised

Monitor only the information you need.

Disable Multi-Timeframe analysis or individual dashboard columns to skip unnecessary calculations and improve chart performance.

Built for Automation

Dedicated indicator buffers provide direct access to market structure, entry, and exit signals, making integration with Expert Advisors straightforward using CopyBuffer().


How It Works

The indicator evaluates market structure sequentially, maintaining active swing highs and lows using configurable fractal detection.

When price breaks a confirmed swing level, it determines whether the move represents:

  • Break of Structure (BOS) = continuation of the prevailing trend.
  • Change of Character (CHOCH) = potential transition into a new trend.

Signals are plotted directly on the chart using structure lines, labels, arrows, and dashboard status while simultaneously being made available through dedicated EA buffers.


Volume Profile Integration

Volume Profile identifies where the market has accepted value and where price is trading at value extremes.

By combining market structure with:

  • POC (Point of Control) — the highest-volume traded price.
  • VAH (Value Area High) — the upper boundary of the value area.
  • VAL (Value Area Low) — the lower boundary of the value area.

the indicator helps traders evaluate whether price is breaking from value, rejecting value extremes, or rotating back toward fair value (POC).


Example Strategy: Breakout vs Mean Reversion

The Setup

  • Price approaches Value Area High (VAH) from below.
  • A bullish BOS develops near VAH.

Scenario A - Potential Fakeout

  • Bullish BOS forms into or slightly above VAH.
  • Buying participation weakens.
  • Price struggles to remain above Value Area High.

Interpretation

The breakout lacks conviction and may fail. (Try combining with our On Balance Volume MTF Plus, Central Pivot Range Plus or Cumulative Volume Delta MAX Plus indicators for extra confirmation)

Action

Avoid chasing the breakout and wait for additional confirmation before entering.


Scenario B - Mean Reversion Opportunity

  • Bullish BOS develops while price moves back toward the Point of Control (POC) from below Value Area Low.
  • Volume supports the move.

Interpretation

Market structure aligns with Volume Profile, often providing stronger confluence for mean reversion trades.

Action

Consider opportunities targeting a move back toward the Point of Control.

Note: This example is provided for educational purposes only and is not a trade recommendation.


EA-Ready Architecture

For automated strategies, the primary entry signals are available immediately through dedicated indicator buffers.

Buffer Signal Typical EA Use
Buffer 0 Bullish BOS/CHOCH Enter Long
Buffer 1 Bearish BOS/CHOCH Enter Short
Buffer 6 VAH Touch Exit Long
Buffer 7 VAL Touch Exit Short

Signals can be accessed directly from an Expert Advisor using CopyBuffer(). A complete MQL5 integration example is included in the user documentation.


Included

  • Comprehensive user guide
  • Practical strategy examples
  • Historical signal plotting
  • Multi-Timeframe dashboard
  • Dashboard customisation
  • Configurable fractal sensitivity
  • Candle Close or Wick Break confirmation
  • Custom colours and styles
  • Multi-channel alerts (Pop-up, Push Notification, Email and Sound)
  • Extended strategy guide available upon request after purchase

Markets: Forex, Indices, Commodities, Stocks and Cryptocurrency CFDs

Timeframes: All (M15–H4 recommended)

Copyright © 2026, Ebrah

E-mail: Ebrah.Ssali@Nnanda.com


Prodotti consigliati
Heiken_Ashi_Bars - Visualizzatore di Tendenze Avanzato per MT5 Panoramica Heiken_Ashi_Bars è un indicatore personalizzato potente e visivamente intuitivo progettato per filtrare il rumore del mercato ed evidenziare la vera tendenza di fondo. I grafici a candele tradizionali possono spesso essere erratici. Calcolando la media dei dati sui prezzi, questo indicatore uniforma l'azione dei prezzi, rendendo molto più semplice individuare continuazioni di tendenze, inversioni e zone di ingresso redditi
CosmiCLab SMC FIBO CosmiCLab SMC FIBO is a professional trading indicator designed for traders who use Smart Money Concepts (SMC), market structure analysis and Fibonacci retracement levels. The indicator automatically detects market swings and builds Fibonacci levels based on the latest impulse movement. It also identifies market structure changes such as BOS (Break of Structure) and CHOCH (Change of Character), helping traders understand the current market direction. CosmiCLab SMC FIBO also pr
Wapv Price and volume
Eduardo Da Costa Custodio Santos
L'indicatore di prezzo e volume WAPV per MT5 fa parte del set di strumenti (Wyckoff Academy Wave Market) e (Wyckoff Academy Price and Volume). L'indicatore di prezzo e volume WAPV per MT5 è stato creato per semplificare la visualizzazione del movimento del volume sul grafico in modo intuitivo. Con esso puoi osservare i momenti di picco del volume e i momenti in cui il mercato non ha interesse professionale Identifica i momenti in cui il mercato si muove per inerzia e non per movimento di "denaro
Price Magnet — Price Density and Attraction Levels Indicator Price Magnet is a professional analytical tool designed to identify key support and resistance levels based on statistical Price Density. The indicator analyzes a specified historical period and detects price levels where the market spent the most time. These zones act as “magnets,” attracting price action or forming a structural base for potential reversals. Unlike traditional Volume Profile tools, Price Magnet focuses on price-time d
CCI Fixed Dual
Edoardo Centorame
Cos è il CCI FIXED DUAL Il CCI FIXED DUAL è un Trend Direction Filter professionale, progettato per identificare con precisione: la direzione dominante del mercato la qualità strutturale del movimento la coerenza tra trend principale e fasi di accelerazione Non è un indicatore di ingresso diretto. Non è un oscillatore classico. È uno strumento di contesto, pensato per aiutare il trader a decidere quando operare e quando NON operare, riducendo drasticamente il rumore e gli errori di interpretazio
Supply demand arrows
Smaylle Rafael Coelho Mariano
The   "Supply Demand Arrows"   indicator for MetaTrader 5 (MT5) is a powerful trading tool designed to help traders identify critical supply and demand zones in the market. By visually marking these zones with arrows, the indicator enhances trading precision and decision-making. Key Features Identification of Supply and Demand Zones : The indicator effectively highlights key supply and demand zones on the price chart, allowing traders to see where significant buying or selling pressure exists. T
FREE
JT360 DNA Mini PnL Pointer V1.04 Public Compatto. Chiaro. Sempre sott’occhio. JT360 DNA Mini PnL Pointer è un indicatore leggero per MetaTrader 5 che mostra il profitto o la perdita flottante aggregata di tutte le posizioni aperte sul simbolo del grafico corrente. La sua visualizzazione compatta sul grafico combina il PnL basato sul rischio, espresso in R, una sottile mini-barra e una matrice di colori personalizzabile. I colori distintivi JT360, turchese e magenta, evidenziano i valori estremi
FREE
Weis Wave Scouter
Jean Carlos Martins Roso
Scopri la potenza dell'analisi avanzata del volume con Weis Wave Scouter, un indicatore rivoluzionario per MetaTrader 5 che combina i principi comprovati del metodo Wyckoff e dell'analisi VSA (Volume Spread Analysis). Progettato per trader che cercano precisione e profondità nelle loro operazioni, questo indicatore offre una lettura tattica del mercato attraverso l'analisi delle onde di volume cumulativo, aiutando a individuare punti chiave di inversione e continuazione di tendenza. Weis Wave Sc
Order Book, known also as Market Book, market depth, Level 2, - is a dynamically updated table with current volumes of orders to buy and to sell specific financial instument at price levels near Bid and Ask. MetaTrader 5 provides the means for receiving market book from your broker, but in real time only, without access to its history. The indicator OrderBook Cumulative Indicator accumulates market book data online and visualizes them on the chart. In addition, the indicator can show the market
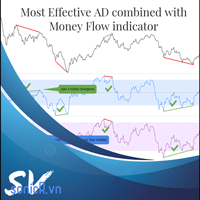
The Accumulation / Distribution is an indicator which was essentially designed to measure underlying supply and demand. It accomplishes this by trying to determine whether traders are actually accumulating (buying) or distributing (selling). This indicator should be more accurate than other default MT5 AD indicator for measuring buy/sell pressure by volume, identifying trend change through divergence and calculating Accumulation/Distribution (A/D) level. Application: - Buy/sell pressure: above
HAS RSI Signal — Indicatore di Tendenza Professionale con Calcolo SL/TP HAS RSI Signal è un potente strumento di trading che combina classici intramontabili con moderni algoritmi di filtraggio del rumore. L'indicatore analizza il mercato attraverso le candele Heiken Ashi Smoothed (HAS) e l'oscillatore RSI , fornendo al trader segnali di ingresso chiari durante le inversioni di tendenza o l'uscita dalle zone di ipercomprato/ipervenduto. Vantaggi Principali: Doppio Filtraggio: L'uso di Heiken Ashi
Indicatore Crypto_Forex "WPR con 2 Medie Mobili" per MT5, senza ridisegno. - WPR è uno dei migliori oscillatori per lo scalping. - L'indicatore "WPR e 2 Medie Mobili" consente di visualizzare le medie mobili veloci e lente dell'oscillatore WPR. - L'indicatore offre l'opportunità di visualizzare le correzioni di prezzo molto presto. - È molto facile impostare questo indicatore tramite parametri e può essere utilizzato su qualsiasi timeframe. - È possibile visualizzare le condizioni di ingresso
"Impulses and Corrections 5" is created to help traders navigate the market situation. The indicator shows multi-time frame upward and downward "Impulses" of price movements. These impulses are the basis for determining the "Base" , which is composed of zones of corrections of price movements, as well as "Potential" zones for possible scenarios of price movement. Up and down impulses are determined based on a modified formula of Bill Williams' "Fractals" indicator. The last impulse is always "U
The   Trendlines Oscillator   helps traders identify trends and momentum based on the normalized distances between the current price and the most recently detected bullish and bearish trend lines. The indicator features bullish and bearish momentum, a signal line with crossings, and multiple smoothing options. USAGE The   Trendlines Oscillator   works by systematically: Identifying pivot highs and lows. Connecting pivots to form bullish (support) and bearish (resistance) trendlines. Measuring
PZ Support Resistance MT5
PZ TRADING SLU
3.71 (7)
Unlock key market insights with automated support and resistance lines Tired of plotting support and resistance lines? This is a multi-timeframe indicator that detects and plots supports and resistance lines in the chart with the same precision as a human eye would. As price levels are tested over time and its importance increases, the lines become thicker and darker, making price leves easy to glance and evaluate. [ Installation Guide | Update Guide | Troubleshooting | FAQ | All Products  ] Boo
TRI Visualizer
Yoshimi Mon 三 Ura
TRI Visualizer MT5 – Thermodynamic Market Analysis Overview The TRI (Thermal Range Indicator) Visualizer Enhanced is a rare market analysis indicator that goes beyond conventional technical analysis, applying principles of thermodynamics from physics. It interprets market price fluctuations as “thermodynamic energy,” enabling the highly accurate detection of subtle market changes that are often overlooked. Innovative Mechanisms 1. Dual Calculation Engines Classic TRI Mode Formula: |Close
Auto-levels trading robot: key levels & risk manager Short Description: Automatically plots dynamic weekly support and resistance zones with real-time risk tracking. Full Description: Elevate your chart analysis with a dynamic tool designed to map the market structure effortlessly. This indicator automatically calculates and plots critical support and resistance levels based on weekly price action, updating every new week to align seamlessly with current market dynamics. By projecting precise pe
MarketPredict Pro – Analisi di mercato avanzata a più livelli   Come funziona MarketPredict Pro combina sei livelli analitici indipendenti per generare previsioni altamente accurate sulla prossima candela.   Analisi a 6 livelli Buyers/Sellers Pressure   – misura la forza di compratori e venditori Trend Strength   – calcolo del trend tramite SMA a 20 periodi Volatility   – modello di volatilità simile all’ATR (14 periodi) Market Pressure   – pressione cumulativa delle ultime 5 candele
Precision Arrows
Nervada Emeule Adams
Precision Arrows – Segnali di ingresso precisi con TP e SL integrati Precision Arrows è un indicatore di trading avanzato progettato per trader che cercano precisione, chiarezza e affidabilità . Identifica segnali di acquisto e vendita ad alta probabilità e genera automaticamente i livelli di Take Profit (TP) e Stop Loss (SL) , consentendo operazioni disciplinate e costanti su Forex, Indici, Criptovalute e Indici Sintetici . L’indicatore combina rilevamento preciso dei segnali, filtraggio intell
IC Flat Pro The True Math
Aruncharan Ganapathy Sivakumar
IC FLAT PRO – THE TRUE MATH   Early Adopter Pricing Secure IC FLAT PRO – THE TRUE MATH at the current launch price. Once the first 10 purchases  have been sold, the price will increase by USD 300 . Institutional-Grade Market Structure Analysis for MetaTrader 5 IC FLAT PRO – THE TRUE MATH is a premium institutional-grade market structure indicator developed for serious traders who demand precision, consistency, and high-quality trade opportunities. Built using advanced mathematical algorithms
NQX Smooth Trend Flip Weekly Bias è un indicatore di segnali per MetaTrader 5: segnali di inversione del trend smussato (segnala solo nella direzione del bias settimanale). Logica NQX proprietaria che rileva un cambio di colore delle candele smussate dopo un movimento. Segnala solo nella direzione del bias settimanale. Disegna l'ingresso suggerito, uno stop corto e target ampi (3:1, 5:1, 10:1, fino a 20:1 in swing); decidi tu. Cosa disegna sul grafico - Una freccia sulla candela di segnale chius
Time and Sales Tick
Pablo Filipe Soares De Almeida
Time & Sales Tick Indicator è un indicatore per MetaTrader 5 che mostra i dati dei tick in tempo reale. Visualizza prezzo, volume dei tick e orario direttamente sul grafico. Funzionalità Mostra i dati dei tick, inclusi prezzo, volume e tempo, in un pannello sul grafico. Raggruppa i tick in intervalli definiti dall’utente, con colori distinti (verde per rialzo, rosso per ribasso). Il pannello può essere posizionato in qualsiasi angolo del grafico.
Royal Aurum Confluence è un indicatore per MetaTrader 5 pensato per i trader che vogliono smettere di indovinare dove entrare, dove uscire e fin dove può arrivare un movimento dell’oro. Prezzo di lancio: $49 . Il prezzo aumenterà di $10 ogni 20 acquisti fino a raggiungere il prezzo finale di $199 . Prossimo prezzo: $59 . Royal Aurum Companion è incluso senza costi aggiuntivi. È uno strumento complementare per l’esecuzione manuale delle operazioni e la gestione delle posizioni, progettato per fun
Il WaveTrend Oscillator MT5 è un potente indicatore di trading progettato per migliorare la tua analisi di mercato identificando cambiamenti di momentum e potenziali inversioni di tendenza. Ideale per trader di tutti i livelli, questo strumento offre preziose informazioni su condizioni di ipercomprato e ipervenduto in vari mercati, tra cui forex, criptovalute e materie prime. Con la sua capacità di generare segnali di acquisto e vendita accurati, il WaveTrend Oscillator MT5 consente ai trader di
RBreaker
Zhong Long Wu
RBreaker Gold Indicators is a short-term intraday trading strategy for gold futures that combines trend following and intraday reversal approaches. It not only captures profits during trending markets but also enables timely profit-taking and counter-trend trading during market reversals. This strategy has been ranked among the top ten most profitable trading strategies by the American magazine   Futures Truth   for 15 consecutive years. It boasts a long lifecycle and remains widely used and st
MA Flow No.2 See the Flow of Bulls & Bears at a Glance, and Keep the Rhythm of the Market in Your Hands Tired of staring at dozens of moving averages until your eyes blur? Unsure when to enter, or where to place your stop? MA Flow No.2 upgrades the humble moving average into a complete trend-trading system. No more scattered lines on your chart — instead, a living "river of bulls and bears". Up to 100 moving averages roll together in real time. On every single bar, you can see at a glance w
PipFinite Trend PRO MT5
Karlo Wilson Vendiola
4.84 (562)
Breakthrough Solution For Trend Trading And Filtering With All Important Features Built Inside One Tool! Trend PRO's smart algorithm detects the trend, filters out market noise and gives entry signals with exit levels. The new features with enhanced rules for statistical calculation improved the overall performance of this indicator. Important Information Revealed Maximize the potential of Trend Pro, please visit www.mql5.com/en/blogs/post/713938 The Powerful Expert Advisor Version Automatin
Cumulative Volume Delta MA-X MTF (con Gradient Momentum) Questo indicatore esegue un'analisi multi-timeframe del Delta del Volume Cumulativo (CVD) per MetaTrader 5. Calcola la differenza netta tra la pressione di acquisto e di vendita analizzando i dati del volume reale o dei tick, fornendo una rappresentazione visiva del sentiment del flusso degli ordini. Logica e Caratteristiche dell'Indicatore L'indicatore utilizza un approccio matematico per l'analisi del volume: Origine dei Dati: Supporta
BBMA with EMA50
Teeraporn Satitman
This indicator consist of Standard BBMA Standard signal Sign on chart added EMA50 Behavior Tracking: The chart background changes color based on the EMA50 (default is black) and shifts to white when a breakout of the Bollinger Bands occurs. Three Engulfing Color Change: Automatically adjusts colors to help you easily determine market zones. default yellow/white High-Low Line Sign: Highlights the potential trading range and key price levels for better visual  MHV
FREE
YazanPro Pattern Scanner
Yazan Adnan Ramadan Ibrahim
Panoramica YazanPro Pattern Scanner è un indicatore per MetaTrader 5 pensato per i trader che lavorano con i pattern grafici su molti mercati. Controlla fino a 150 simboli su un massimo di 9 timeframe alla ricerca di pattern grafici classici e di 40 pattern di candele, e riunisce tutto in una tabella con la fase raggiunta da ogni pattern. Invece di aprire un grafico dopo l'altro, vedi dove un pattern si è appena completato, ha rotto, è in retest o è confermato, e un clic apre quel grafico con il
Gli utenti di questo prodotto hanno anche acquistato
Entry Points Pro vi mostra dove entrare, dove mettere lo stop e con quale lotto operare — prima di piazzare l'ordine. PREZZO Ora 199 USD: 8 copie a questo prezzo, poi 249 USD. Il prezzo finale è di 349 USD. Guadagno facendo trading sui mercati e lo dimostro, quindi non ho bisogno di vendere questo indicatore a tutti. È uno strumento per trader che ragionano con la propria testa, non un pulsante magico. Nessuna rottura, nessun trade. Una freccia grigia è un segnale annullato: il prezzo non ha ro
Gann Made Easy è un sistema di trading Forex professionale e facile da usare che si basa sui migliori principi del trading utilizzando la teoria di mr. WD Gann. L'indicatore fornisce segnali ACQUISTA e VENDI accurati, inclusi i livelli di Stop Loss e Take Profit. Puoi fare trading anche in movimento utilizzando le notifiche PUSH. CONTATTAMI DOPO L'ACQUISTO PER RICEVERE GRATUITAMENTE LE ISTRUZIONI DI TRADING E OTTIMI INDICATORI EXTRA! Probabilmente hai già sentito parlare molte volte dei metodi d
Ultra Indicator
Ihor Otkydach
5 (1)
ULTRA è un indicatore tecnico che funziona secondo un approccio “tutto in uno”: analizza autonomamente il mercato, genera segnali di trading, visualizza i livelli per l’impostazione degli ordini stop-loss e suggerisce quando chiudere le operazioni per realizzare profitti o ridurre al minimo le perdite. In altre parole, non importa se non sai come analizzare il mercato, determinare i livelli — dove impostare lo stop-loss — o se hai difficoltà con la gestione del capitale. ULTRA farà tutto questo
Boba Analysis Suite
Trade Ready Solutions LLC
5 (2)
Boba Analysis Suite Boba Analysis Suite è un indicatore di analisi per MetaTrader 5. Riunisce la struttura del mercato, le zone di prezzo rilevanti e il contesto generale del mercato in un’unica visualizzazione del grafico. Sviluppato sulla base dell’esperienza pratica come trader e formatore di trading, supporta un processo di analisi strutturato: valutare la direzione del mercato, individuare livelli importanti e analizzare congiuntamente più intervalli temporali. Analisi nel contesto del merc
M1 Sniper MT5
Oleg Rodin
5 (7)
M1 SNIPER   è un sistema di indicatori di trading facile da usare. Si tratta di un indicatore a freccia progettato per l'intervallo temporale M1. L'indicatore può essere utilizzato come sistema autonomo per lo scalping sull'intervallo temporale M1 e come parte del tuo sistema di trading esistente. Sebbene questo sistema di trading sia stato progettato specificamente per il trading sull'intervallo temporale M1, può comunque essere utilizzato anche con altri intervalli temporali. Inizialmente ho p
Apex Patterns PRO Acquista l'indicatore - Ottieni GRATUITAMENTE l'Expert Advisor basato su di esso. Intelligenza auto-ottimizzante per pattern grafici e breakout Gli scanner di pattern tradizionali si basano su input fissi, registrando spesso prestazioni inferiori quando la volatilità e le strutture del mercato cambiano. Apex Patterns PRO è progettato per adattarsi alle mutevoli condizioni di mercato combinando il riconoscimento dei pattern grafici strutturali, il filtraggio del momentum e l'au
SQN Max indicator for MT5 by ITC
Renaud Herve Francois Candel
Sqn Max Indicator Sqn Max is an exclusive indicator to trade the market with high effectiveness. The indicator is based on price action, volatility and trend. This indicator is as simple as possible but not too simple. The indicator can generate alerts to ease the trading process. You don't have to stay all day in front of your screen. The indicator can be used with any class of assets and with any time frame. It is possible to achieve better results trading our list of selected assets. We achi
Divergence Bomber
Ihor Otkydach
4.89 (94)
Ogni acquirente dell’indicatore riceverà inoltre gratuitamente: L’utilità esclusiva “Bomber Utility”, che gestisce automaticamente ogni operazione, imposta i livelli di Stop Loss e Take Profit e chiude le posizioni secondo le regole della strategia I file di configurazione (set file) per adattare l’indicatore a diversi asset I set file per configurare il Bomber Utility in tre modalità: “Rischio Minimo”, “Rischio Bilanciato” e “Strategia di Attesa” Una guida video passo-passo per installare, con
Currency Strength Wizard   è un indicatore molto potente che ti fornisce una soluzione all-in-one per un trading di successo. L'indicatore calcola la potenza di questa o quella coppia forex utilizzando i dati di tutte le valute su più intervalli di tempo. Questi dati sono rappresentati in una forma di indice di valuta facile da usare e linee elettriche di valuta che puoi utilizzare per vedere il potere di questa o quella valuta. Tutto ciò di cui hai bisogno è collegare l'indicatore al grafico ch
Indicatore multi-valuta di forza e momentum MT5 Dynamic Forex28 Navigator è l'evoluzione dei nostri indicatori popolari da lunga data, che riunisce la potenza di cinque in uno: Advanced Currency Strength28 Indicator (700 recensioni) Advanced Currency IMPULSE with ALERT (530 recensioni) Currency Strength EXOTICS GOLD Impulse with Alert CS28 Combo Signals (bonus attuale) Non serve acquistare quattro indicatori e impilarli sui grafici. Tutto è riunito in un solo indicatore potente: la forza delle 2
Azimuth Pro
Ottaviano De Cicco
5 (7)
Azimuth Pro V2: Synthetic Fractal Structure and Confirmed Entries for MT5 Overview Azimuth Pro is a multi-level swing structure indicator by Merkava Labs . Four nested swing layers, swing-anchored VWAP, ABC pattern detection, three-timeframe structural filtering, and closed-bar confirmed entries — one chart, one workflow from micro-swings to macro-cycles. This is not a blind signal product. It is a structure-first workflow for traders who care about location, context, and timing. 1. What Change
ARICoins
Temirlan Kdyrkhan
ARICoin is a powerful trading companion designed to generate high-probability entry signals with dynamic TP/SL/DP levels based on volatility. Built-in performance tracking shows win/loss stats, PP1/PP2 hits, and success rates all updated live. Key Features: Buy/Sell signals with adaptive volatility bands Real-time TP/SL/DP levels based on ATR Built-in MA Filter with optional ATR/StdDev volatility Performance stats panel (Success, Profit/Loss, PP1/PP2) Alerts via popup, sound, push, or email Cust
PZ Swing Trading MT5
PZ TRADING SLU
5 (5)
Protect against whipsaws: revolutionize your swing trading approach Swing Trading is the first indicator designed to detect swings in the direction of the trend and possible reversal swings. It uses the baseline swing trading approach, widely described in trading literature. The indicator studies several price and time vectors to track the aggregate trend direction and detects situations in which the market is oversold or overbought and ready to correct. [ Installation Guide | Update Guide | Tro
Neuro Poseidon MT5
Daria Rezueva
4.68 (53)
Neuro Poseidon is a new indicator by Daria Rezueva. It combines precise trading signals with adaptive TP/SL levels - creating best possible trades as a result! Message me and get  Neuro Poseidon Assistant  as a gift to automize your trading process! What makes it stand out? 1. Proven profitability on all assets and timeframes 2. Only confirmed BUY and SELL signals present on the chart 3. Adaptive TP & SL levels generated by the software for each trade 4. Easy to understand - suitable for al
Advanced Supply Demand MT5
Bernhard Schweigert
4.53 (15)
La migliore soluzione per qualsiasi principiante o trader esperto! Questo indicatore è uno strumento di trading unico, di alta qualità e conveniente perché abbiamo incorporato una serie di funzionalità proprietarie e una nuova formula. Con questo aggiornamento, sarai in grado di mostrare fusi orari doppi. Non solo potrai mostrare una TF più alta, ma anche entrambe, la TF del grafico, PIÙ la TF più alta: SHOWING NESTED ZONES. Tutti i trader di domanda di offerta lo adoreranno. :) Informazioni imp
ScalpPoint
Temirlan Kdyrkhan
ScalpPoint is a powerful trading companion designed to generate high-probability entry signals with dynamic TP/SL/DP levels based on volatility. Built-in performance tracking shows win/loss stats, PP1/PP2 hits, and success rates — all updated live. Key Features: Buy/Sell signals with adaptive volatility bands Real-time TP/SL/DP levels based on ATR Built-in MA Filter with optional ATR/StdDev volatility Performance stats panel (Success, Profit/Loss, PP1/PP2) Alerts via popup, sound, push, or emai
Superhero
Ihor Otkydach
5 (3)
L'indicatore SUPERHERO è un sistema di trading multivaluta progettato secondo un approccio "all-inclusive". L'indicatore analizza autonomamente il mercato e fornisce segnali su quando aprire e chiudere le posizioni. Utilizza ordini Stop Loss e Take Profit. Il rapporto R:R è 1:1. Questo sistema è in grado di inviare notifiche push sul tuo smartphone, consentendoti di effettuare operazioni "in mobilità" senza dover rimanere incollato al PC. È perfetto per le società di trading proprietario. UN OMA
Bill Williams Advanced
Siarhei Vashchylka
5 (11)
Bill Williams Advanced is designed for automatic chart analysis using Bill Williams' "Profitunity" system. The indicator analyzes four timeframes at once. Manual (Be sure to read before purchasing) Advantages 1. Analyzes the chart using Bill Williams' "Profitunity" system. Signals are displayed in a table in the corner of the screen and on the price chart. 2. Finds all known AO and AC signals, as well as zone signals. Equipped with a trend filter based on the Alligator. 3. Finds "Divergence Bar
Naked Forex Kangaroo Tail Pro Indicator Kangaroo Tail Pro Indicator is a pattern recognition indicator for Forex, Stocks, Indices, Futures, Commodities and Cryptos. The Kangaroo Tail is a multi-bar pattern. The Kangaroo Tail pattern is very effective and is very simple to trade. The strategy that comes with the Kangaroo Tail is based on price action. The indicator does what it was designed for: displaying Kangaroo Tail patterns.     Don't expect to follow the up and down arrows and make mone
AriFocus
Temirlan Kdyrkhan
AriFocus - Non-Repainting Buy/Sell Signals AriFocus - one clear signal. AriFocus marks buy and sell signals directly on the chart and suggests a stop-loss level for each one. Every signal is confirmed on bar close and never repaints. - Buy/sell arrows, confirmed on bar close - Suggested stop-loss level for every signal - Trend band and candle coloring to show direction at a glance - 10 ready-made presets, or your own settings (14 calculation methods) - Pop-up, push and email alerts with entr
Boom Crash GainX PainX Spike Detector Overview Boom Crash GainX PainX Spike Detector is a professional analytical indicator for Deriv synthetic indices. It is designed to identify potential spike opportunities using multiple technical indicators, price movement analysis, and tick-based cycle monitoring. The indicator supports both market directions in one tool: Boom and GainX: BUY signals for potential upward spikes. Crash and PainX: SELL signals for potential downward spikes. The indicator auto
Volatility Master for MetaTrader is a real-time dashboard tool that scans up to  50 symbols  to identify high-volatility , trending markets instantly. With bullish/bearish signals, customizable alerts, and a user-friendly interface, it helps you avoid range-bound conditions and focus on high-probability trades. Clarity leads to confidence. Trade confidently and protect your capital effectively with this powerful dashboard. We don't offer free or bonus indicators in exchange of reviews from you.
Scalper Vault è un sistema di trading potente e completo, progettato per i trader che desiderano ottenere risultati costanti nel trading intraday. Questo indicatore ad alta precisione funge da sistema di trading autonomo, offrendo analisi di livello istituzionale sia per il mercato Forex che per le Opzioni Binarie. CONTATTAMI DOPO L'ACQUISTO PER RICEVERE I MIEI CONSIGLI DI TRADING E UN FANTASTICO BONUS! Eliminando le congetture e le complesse analisi manuali, Scalper Vault ti permette di concen
FX Sniper Orange Indicator FX Sniper Orange is an exclusive indicator to spot situations where market has gone too far and market could reverse soon after. The indicator displays arrows in your chart indicating probable future price action (see screenshot attached). FX Sniper Orange never repaints. Once candle is closed signal is confirmed and arrow will never disappear. Users of the indicator can setup alerts when new arrows are displayed in the chart. Inputs of the indicator are: Distanc
ARIPoint
Temirlan Kdyrkhan
1 (4)
ARIPoint is a powerful trading companion designed to generate high-probability entry signals with dynamic TP/SL/DP levels based on volatility. Built-in performance tracking shows win/loss stats, PP1/PP2 hits, and success rates all updated live. Key Features: Buy/Sell signals with adaptive volatility bands Real-time TP/SL/DP levels based on ATR Built-in MA Filter with optional ATR/StdDev volatility Performance stats panel (Success, Profit/Loss, PP1/PP2) Alerts via popup, sound, push, or email Cu
SkyHammer Signal Pro Indicatore professionale di segnali trend no-repaint con livelli Entry, SL e TP bloccati SkyHammer Signal Pro è un indicatore strutturato di trend e momentum, progettato per trader che desiderano segnali chiari, fissi e verificabili. Funziona al meglio su timeframe bassi, come M1 e M5 . L’indicatore non cerca di prevedere massimi o minimi del mercato. Attende invece una struttura di mercato confermata, una chiara direzione del trend, forza del momentum, volatilità sana e spa
Zain Gold Scalping
Ahmed Gamal Abdel Nasser Mohamed
Uno strumento completo di analisi della price action basato su una doppia logica di ingresso indipendente – ciascuna confermata da una banda di volatilità – e integrato da un set configurabile di nove filtri di conferma opzionali, che consentono di modulare con precisione il comportamento dei segnali, rendendoli più conservativi o più aggressivi. Strategia Fondamentale Due configurazioni di ingresso indipendenti, ciascuna delle quali si attiva solo quando il prezzo esce da una banda di volatil
SR Liquidity   è un indicatore di trading progettato per individuare le zone nascoste in cui si concentra la liquidità di mercato e dove il prezzo reagisce con maggiore intensità. Queste aree di liquidità agiscono come potenti livelli di supporto e resistenza, offrendo una mappa chiara dei punti in cui è più probabile che il mercato inverta la propria direzione. Invece di tracciare le classiche linee di supporto e resistenza, SR Liquidity analizza l'effettivo comportamento dei prezzi per individ
Ziva LSE System
Hassan Abdullah Hassan Al Balushi
ZIVA LSE System A Professional Liquidity & Structure Execution Framework Executive Overview ZIVA LSE System is a professionally engineered analytical framework designed to interpret market behavior through structural logic and liquidity dynamics. It is not positioned as a conventional indicator. Rather, it functions as a structured execution environment that organizes price action into a clear, disciplined decision-making model. The system is built to deliver consistency, clarity, and controlled
Btmm state engine pro
Garry James Goodchild
5 (4)
BTMM State Engine Pro by G-Labs — Beat The Market Maker indicator for MetaTrader 5. Asian session range, London and New York kill zones, level progression (L1/L2/L3), peak formation detection (PFH/PFL), entry signals, and a multi-pair scanner from one chart for BTMM and Trend Trading traders Stop scanning charts one pair at a time. The State Engine tracks the BTMM daily cycle automatically — Asian box, room boundaries, level blocks, peak formations, and filtered entries — while the scanner das
Altri dall’autore
VOLUME PROFILE SAF-XII Analisi Market Profile Professionale per MT5 (L'indicatore ideale per i trader che utilizzano strategie Grid) COS'È IL VOLUME PROFILE? Il Volume Profile è uno strumento istituzionale professionale che visualizza l'attività di trading a specifici livelli di prezzo, a differenza dei tradizionali indicatori di volume che mostrano il volume nel tempo. Rivela DOVE sono avvenuti gli scambi all'interno della finestra temporale scelta, aiutando a identificare: VALUE AREAS (VAH/VA
The Ultimate Ichimoku MTF Dashboard: Your All-In-One Trading Edge Transform Your Trading with One Powerful Indicator Imagine having a professional trading assistant that monitors multiple timeframes simultaneously, identifies high-probability entries, warns you of potential reversals, and provides clear risk management guidance-all in one clean, intuitive display. That's exactly what the Ichimoku MTF Dashboard delivers.     Why This Isn't Just Another In
MTF Connecting Fractals Multi-Timeframe Market Structure. One Glance. Real Decisions. MTF Connecting Fractals is not just another arrow-printing indicator. It’s a complete multi-timeframe market structure intelligence system designed to answer the most important trading questions in real time - clearly, visually, and without clutter. Built around fractals as objective structure anchors, this tool gives traders a decisive edge by combining price action, structural context, proximity risk, and
Critical Market Session Information with a Single Glance Stop juggling multiple tools and squinting at time zone converters. The SessionInfoDisplay Indicator is your new, indispensable trading co-pilot that puts real-time market intelligence directly on your chart.   What It Does: Your Essential Trading Dashboard   This intelligent indicator provides three critical pieces of information at a glance: 1. Real-Time Session Detection    - Automatically identifies which major financial session is act
FREE
Clr-Dynamic RSI v SMA Indicator : A Comprehensive Analysis of Features and Advantages The Clr-Dynamic RSI v SMA indicator represents a significant evolutionary leap in technical analysis tools, transforming the classic Relative Strength Index (RSI) from a potentially ambiguous oscillator into a sophisticated, multi-dimensional trading system. At its core, this indicator retains the mathematical foundation of the RSI, measuring the speed and change of price movements, but radically enhances its
MTF Candlestick Patterns Detector: Il Tuo Centro di Comando Definitivo per la Price Action Nel frenetico mondo del trading, perdere un singolo pattern di inversione può fare la differenza tra una settimana redditizia e un'opportunità mancata. Il MTF Candlestick Patterns Detector è un indicatore professionale per MQL5 progettato per scansionare, rilevare e aggregare simultaneamente oltre 24 leggendari pattern di candele su tutti i timeframe. Smetti di dare la caccia ai segnali e di tirare a indo
MTF VWAP Indicator - Quick Overview   This indicator shows you where institutional money is flowing across multiple timeframes using Volume Weighted Average Price (VWAP) to identify high-probability trading zones. New version has VWAP bands plotting capability if user enabled and display panel (whose background changes colour on confluence) can be toggled on/off.      What It Actually Does:     1. Tracks Smart Money Levels: - Shows Daily, Weekly, and Monthly VWAP lines where big players (banks,
Indicator Overview This is a sophisticated Multi-Timeframe (MTF) indicator that not only applies the classic Fisher Transform formula but integrates it into a comprehensive trading system featuring a real-time dashboard. The indicator excels at pinpointing reversals through advanced divergence detection and providing a clear, multi-timeframe view of market structure.     How It Works: Core Fisher Logic   1.   Normalization and Signal Generation         The indicator transforms price (using med
MTF WAD Simplified Indicator - Professional Trading Solution     Overview The MTF WAD Simplified is a sophisticated multi-timeframe volume-based indicator designed to track smart money flow across financial markets. By monitoring the Williams Accumulation/Distribution (WAD) across 8 different timeframes, this tool provides traders with unprecedented insight into institutional accumulation and distribution patterns.     Core Benefits for Traders     1. Smart Money Tracking - Detect Institutional
RSI v SMA MTF Indicator : Professional Trading Edge in One Tool   Summary The RSI v SMA MTF Indicator is a sophisticated, multi-timeframe momentum analysis tool that transforms the traditional RSI into a powerful, actionable trading system. By combining RSI slope analysis with SMA crossover signals, divergence detection, and real-time multi-timeframe confluence, this indicator provides traders with a more comprehensive view of market momentum across all relevant timeframes.     Core Utility an
Cumulative Volume Delta MA-X MTF (con Gradient Momentum) Questo indicatore esegue un'analisi multi-timeframe del Delta del Volume Cumulativo (CVD) per MetaTrader 5. Calcola la differenza netta tra la pressione di acquisto e di vendita analizzando i dati del volume reale o dei tick, fornendo una rappresentazione visiva del sentiment del flusso degli ordini. Logica e Caratteristiche dell'Indicatore L'indicatore utilizza un approccio matematico per l'analisi del volume: Origine dei Dati: Supporta
Cumulative Volume Delta (CVD) MA-X: Strumento Intelligente di Sentiment per l'Order Flow Sblocca i meccanismi nascosti del mercato con il Cumulative Volume Delta (CVD) MA-X . Mentre gli indicatori di volume standard ti dicono solo quanto è stato scambiato, il CVD MA-X ti dice CHI sta vincendo la battaglia tra compratori e venditori e QUANDO . Aggregando l'azione del prezzo a livello di tick e la distribuzione del volume, questo indicatore fornisce una mappa cristallina della convinzione e dell'
Multi-Timeframe Money Flow Index (MTF MFI) with Smart Divergence and Dashboard Unlock the flow of institutional money across every timeframe. Are you tired of guessing the trend only to be trapped by a sudden reversal? The Multi-Timeframe Money Flow Index (MTF MFI) is a professional-grade trading tool designed to provide a bird's-eye view of market liquidity and momentum. By aggregating volume-weighted data from W1 down to M1, this indicator eliminates noise and highlights high-probability tra
MTF Parabolic SAR Maximize your trading efficiency with the Multi-Timeframe Parabolic SAR Trend and Momentum Dashboard. Designed for serious traders who value clarity over clutter, this tool aggregates price action across six timeframes into a single, sleek visual interface.  By combining that reliable classic Parabolic SAR logic with advanced momentum scoring and risk assessment, this indicator transforms raw data into actionable trade signals.  The Strategic Edge: Why This Indicator? Most tra
Multi-Timeframe Heiken Ashi (Smoothed with Dashboard) Professional Market Structure Visualization with Weighted Confluence Scoring Transform your trading with crystal-clear multi-timeframe analysis. This indicator combines smoothed Heiken Ashi candles with an intelligent weighted scoring system to give you unprecedented clarity in any market condition. YOUR TRADING QUESTIONS – ANSWERED INSTANTLY: 1. What's the REAL trend direction? Dashboard Reveals:   Higher timeframe (MN1, W1, D1, H4) trend a
Hybrid BB-LRMA [Trend and Volatility Engine]   Master the markets with the Hybrid BB-LRMA, a professional-grade technical analysis tool that fuses the volatility-tracking power of Bollinger Bands (BB) with the hyper-responsive Linear Regression Moving Average (LRMA) to eliminate lag and pinpoint high-probability entries with arrow Signals   Why Hybrid BB-LRMA? Most moving averages are too slow, and Bollinger Bands alone can be noisy. The Hybrid BB-LRMA solves this by using a gradient-based LRMA
Hybrid FATL Fractal: Professional Digital-Signal Logic   Simplify the Complexity of Market Structure.   Unlock the power of digital signal processing combined with price action geometry. The Hybrid FATL Fractal is a professional-grade technical analysis tool designed to eliminate market noise and pinpoint high-probability institutional turning points. By merging the Fast Adaptive Trend Line (FATL) algorithm with Dynamic Fractal Breakout logic, this indicator provides a dual-layered filter that a
Fisher Transform MTF Pro v4.03 Professional Multi-Timeframe Trading Decision System Fisher Transform MTF Pro turns complex multi-timeframe data into clear, actionable trade decisions in seconds. It answers instantly:  What’s the trend?  Where’s the entry?  How strong is the setup?  What are the risks?  Should I buy, sell, or wait?  The Edge   Zero-Line Filter (Trend Protection) Prevents counter-trend trades by default:  No buys above zero  No sells below zero This forces alignment with th
Turtles Professional v2.0 The Legendary Turtle Strategy, Reimagined for the Modern Trader Turtles Pro transforms the iconic 1980s Turtle Trading System into a high-performance, multi-timeframe decision engine. It eliminates guesswork by providing institutional-grade analysis on trend structure, entry quality, and volatility all on a single chart. The Strategic Edge Turtles Professional uses a Smart Weighted Bias Engine to prioritize higher time frames, ensuring your trades align with the d
Hybrid Hull-LSMA : The Trend Meets Momentum Powerhouse Are you struggling with moving averages that are either too slow to react or too noisy to trust? The Hybrid Hull-LSMA is a solution, engineered to solve the "lag vs. noise" dilemma. By fusing the ultra-smooth Hull Moving Average (HMA) with the predictive Least Squares Moving Average (LSMA), this indicator delivers a high-definition view of market structure and entry timing. Why the Hybrid Hull-LSMA? Standard indicators follow the market; t
T3 MTF PureMaths: Indicatore Multi-Timeframe Tillson T3 Sistema di Trading di Confluenza Zero-Lag con Dashboard Interattiva Il vantaggio strategico dell'analisi multi-timeframe T3 MTF Pure Maths è una dashboard di trading di livello professionale che aggrega la struttura del mercato su 8 timeframe simultaneamente – dal mensile fino al grafico a 5 minuti – offrendo approfondimenti operativi istantanei senza dover cambiare grafico o eseguire calcoli mentali. Sviluppato con un' ottimizzazione mate
Divergent Fisher Transform MT5  Precision Momentum. Intelligent Filtering. EA-Ready Automation. The Divergent Fisher Transform for MT5 is a professional-grade momentum trading indicator designed to help traders answer the most important question in the market: “What should I do right now?” It transforms raw price into high-probability, structured trading decisions using a powerful combination of:  Fisher Transform momentum modeling  Zero-line structural filtering  Multi-level overbought/o
Divergent Stochastic Filter II Catch Reversals Early, Filter Noise, Trade with Confidence The Edge: Why This Stochastic is Different  Every trader knows the Stochastic oscillator. But knowing when to trust its signals, that's the real challenge. The Divergent Stochastic Filter II transforms this classic indicator into a precision reversal detection system by adding critical elements: divergence intelligence, signal filtering and exhaustion detection.  While standard Stochastic oscillators fire s
X-Hybrid Modular Z – Execution Intelligence Platform Trasforma qualsiasi indicatore in un sistema di trading completamente automatizzato X-Hybrid Modular Z è un motore di esecuzione modulare che converte qualsiasi indicatore personalizzato ben progettato in un sistema di trading automatico completo. Progettato per i trader che esigono un'esecuzione di livello professionale e un controllo rigoroso del rischio, colma il divario tra la generazione del segnale e la gestione del trade a livello isti
Cumulative Volume Delta (CVD) MA-X Plus: Il Framework Definitivo per l'Order Flow Sblocca le meccaniche nascoste del mercato con il CVD MA-X Plus . Mentre gli indicatori di volume standard ti dicono solo quanto è stato scambiato, il CVD MA-X Plus ti dice chi sta vincendo la battaglia, quando la sta vincendo e dove è ancorato lo "smart money". Aggregando l'azione del prezzo a livello di tick (impostabile su Real Volume per i mercati regolamentati come Azioni/Futures/Oro) e la distribuzione del vo
Hybrid FATL-LRMA : Digital Precision Meets Statistical Certainty The Ultimate Trend-Momentum Convergence System with clear action protocols. Why Hybrid FATL-LRMA? The Edge some Traders Miss Are you tired of lagging indicators that signal entries after the move has already happened? Frustrated by noisy oscillators that keep you in chop while trends pass you by? The Hybrid FATL-LRMA is a dual-engine trading system that bridges the gap between high-frequency digital signal processing and stat
ADX ClrDynamic Slope-Aware, Low-Lag Trend & Momentum Engine Tired of lagging indicators that signal a trend only after the move is over? Traditional ADX calculations are often too slow for modern market volatility. ADX ClrDynamic bridges this gap by combining customizable low-lag smoothing algorithms (EMA, SMA, Wilder, or Hull Acceleration) with slope-aware momentum logic, giving you a lean, high-precision decision engine for timing trend entries and exits. Key Trading Questions Answered What is
ADX ClrDynamicPro Plus III Multi-Timeframe Trend, Momentum & Divergence Command Center Tired of lagging indicators that signal a trend only after the move is over? ADX ClrDynamicPro Plus III is a complete decision engine for trend, momentum, and reversal traders. By combining customizable smoothing algorithms (EMA, SMA, Wilder, or optional Hull Acceleration) with multi-timeframe (HTF) confirmation, institutional divergence detection, and an embedded subwindow dashboard, this tool delivers clear,
SERA - Sigma-Enhanced Regression Analysis – The Non-Repaint, Early-Entry MTF Trading System The Problem with Most Regression Tools (And How We Solved It) Traditional regression indicators lie to you. They repaint, they lag, and distort actionable data. Their flaws cost you in false back-tests, late entries/exits and therefore missed profits. Avoid catching a falling knife or chasing a train with SERA, she eliminates ALL three problems. One-Click Trading Style Selection – Choose Conservative, R
La logica delle Bande Tricolore Ottimizzate dà priorità alla visibilità della price action mantenendo al contempo il rilevamento dello Squeeze (compressione). 1. Cambio di Filosofia: Fai Trading a Modo Tuo L'impostazione SignalMode ti consente di scegliere come l'indicatore interpreta i tocchi delle bande. Pensalo come alla tua personalità di trading: Quando il prezzo tocca la... Modalità BREAKOUT (Trend Trader) Modalità BOUNCE (Cacciatore di Reversion) Modalità AUTO (Versatile) Banda Superiore
Filtro:
Nessuna recensione
Rispondi alla recensione