Cyclic Trend

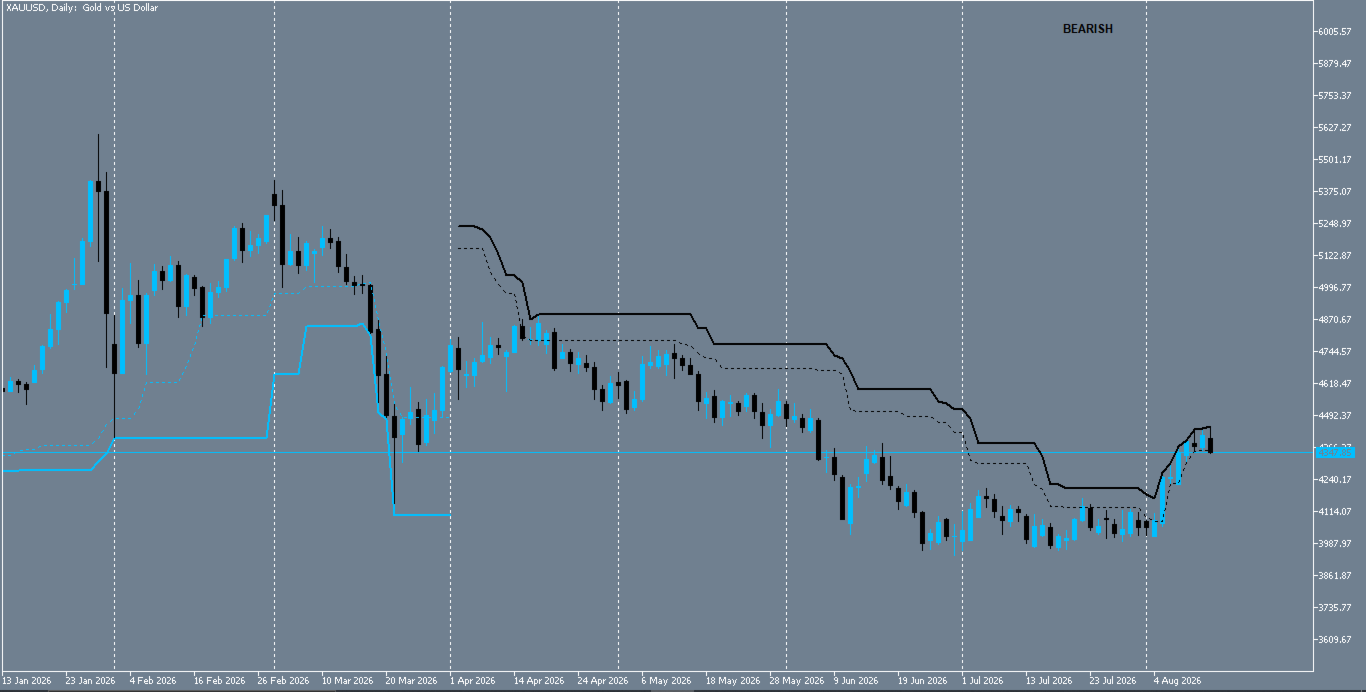
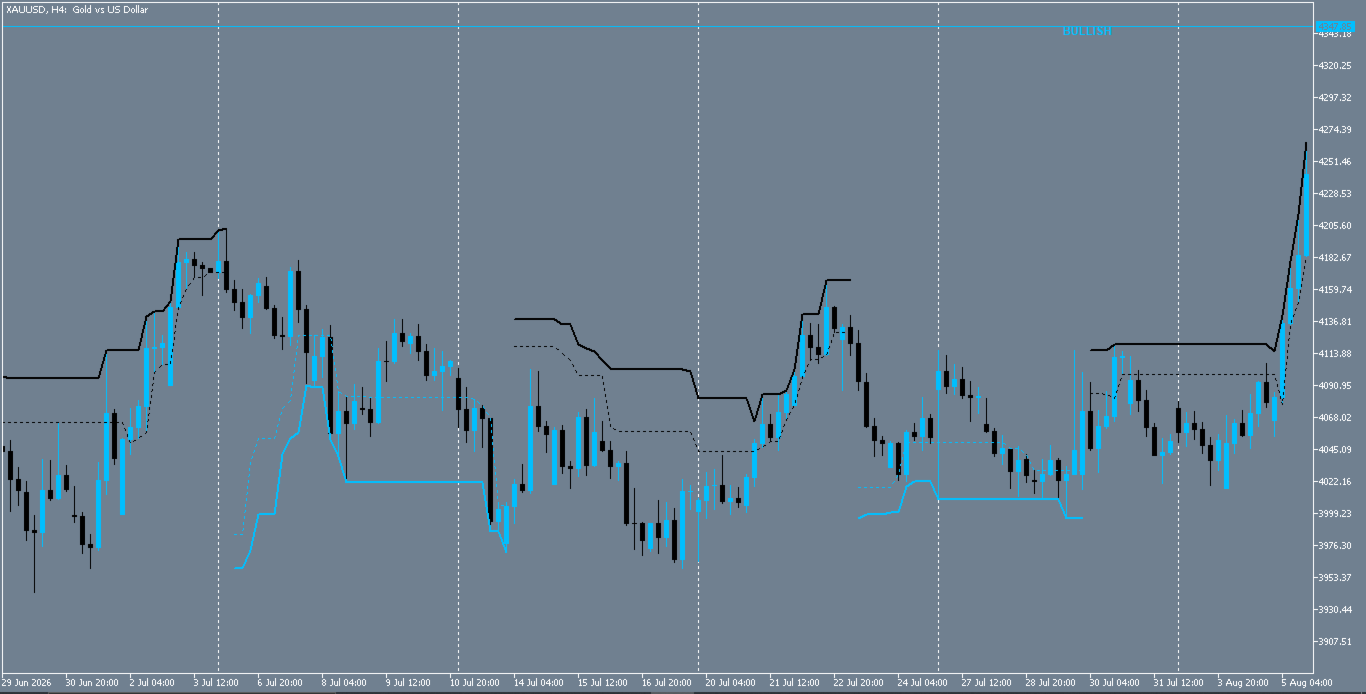
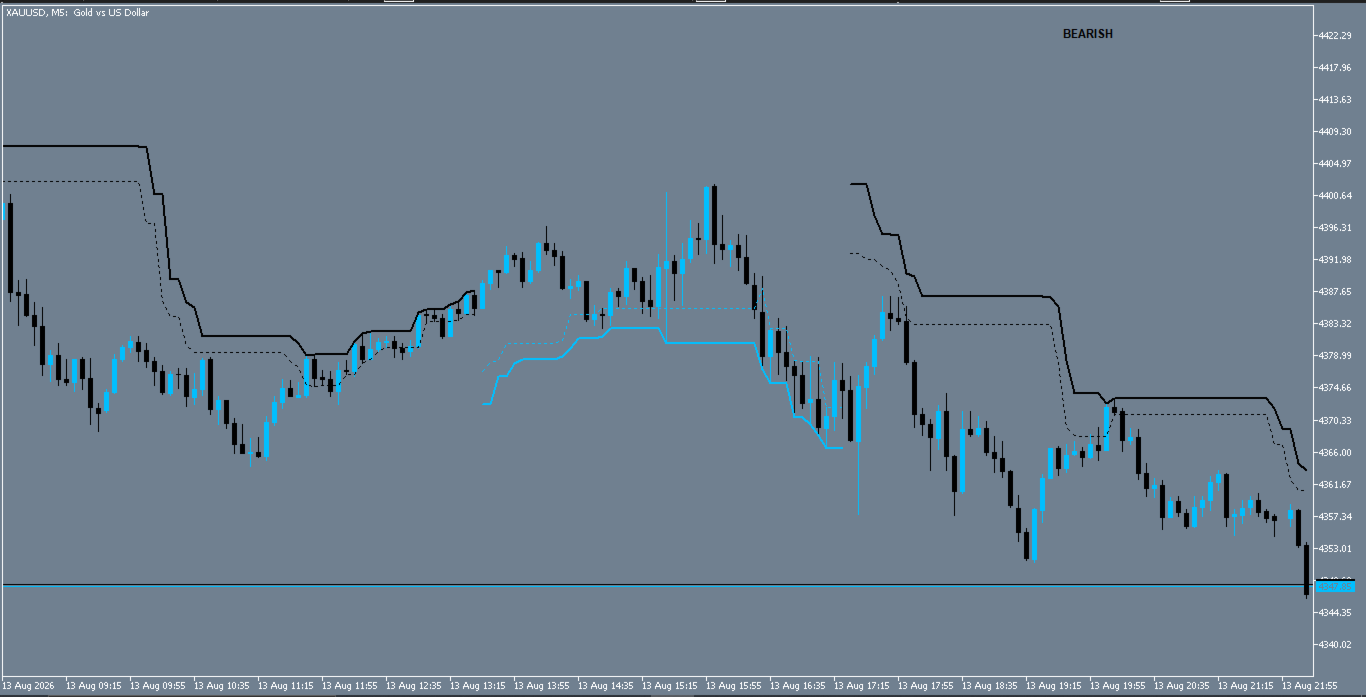
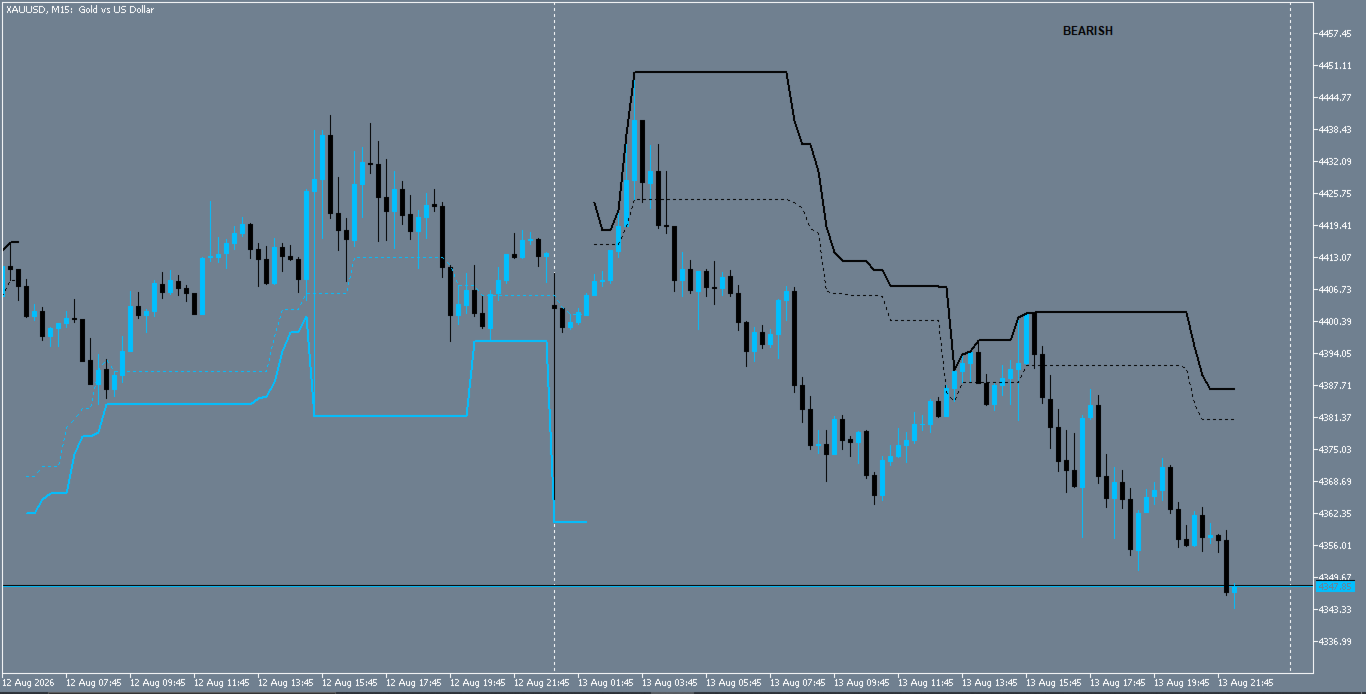
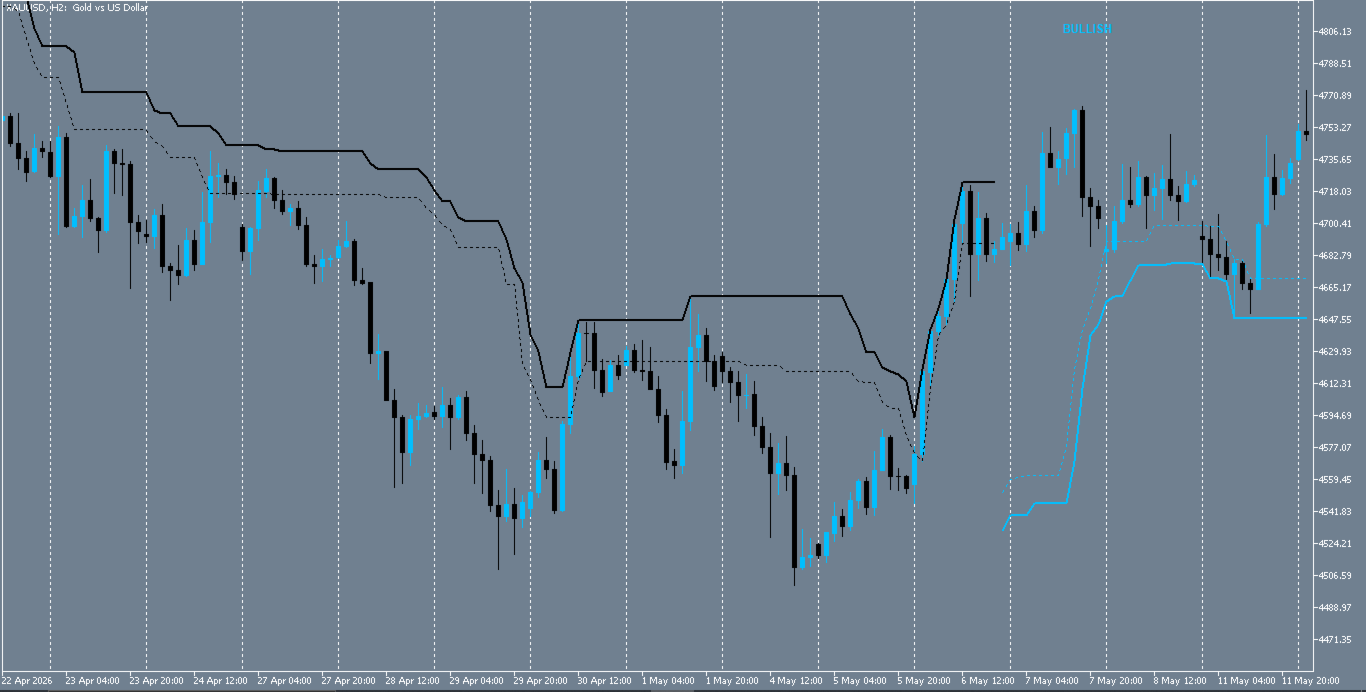
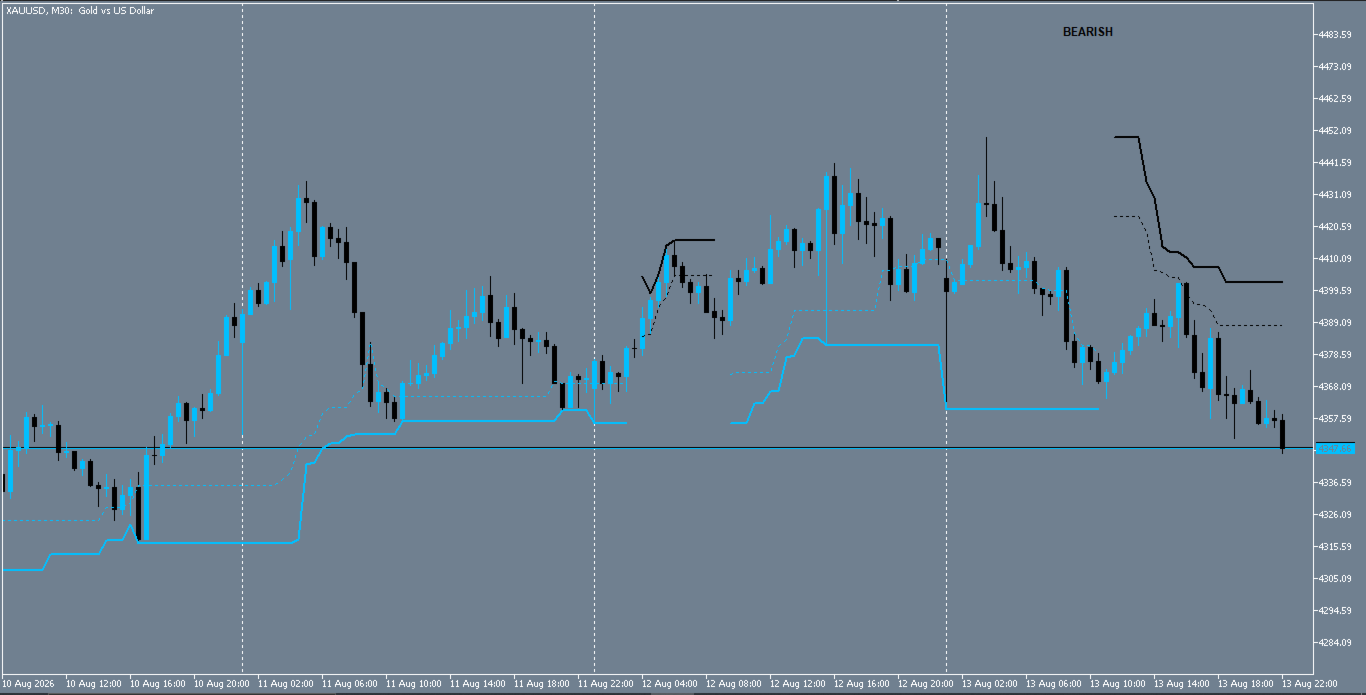
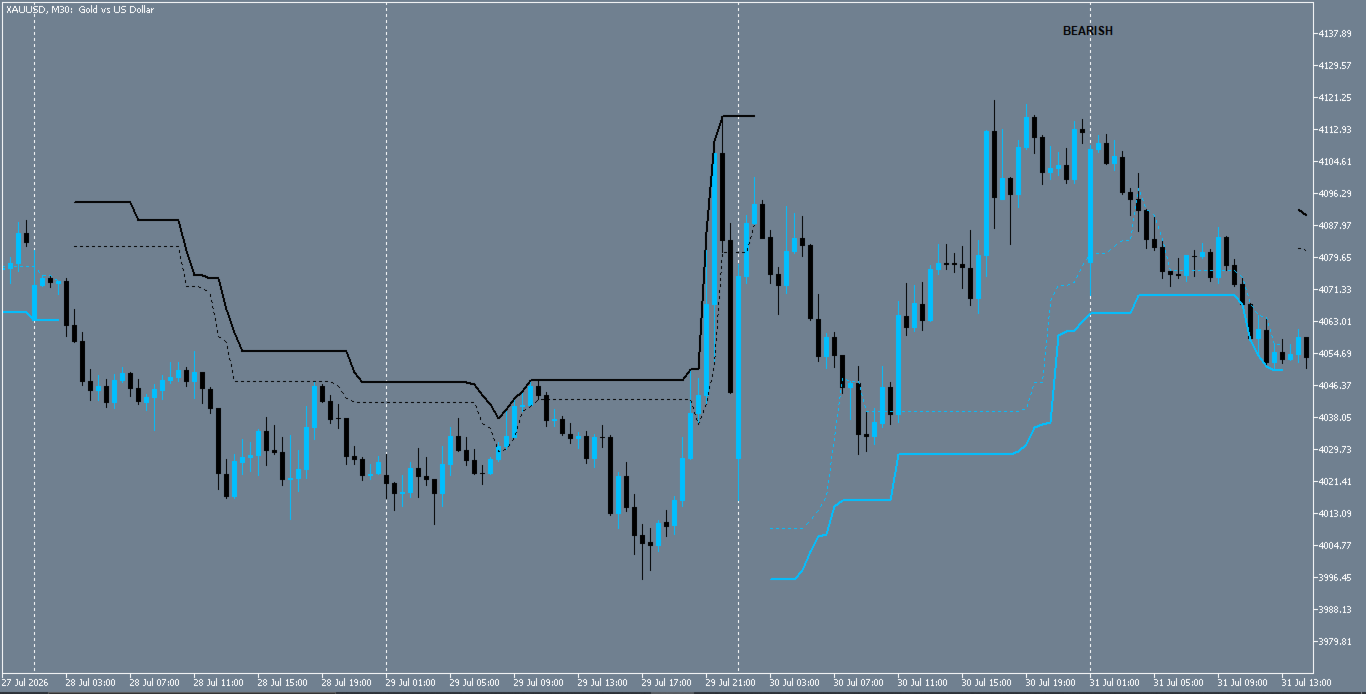
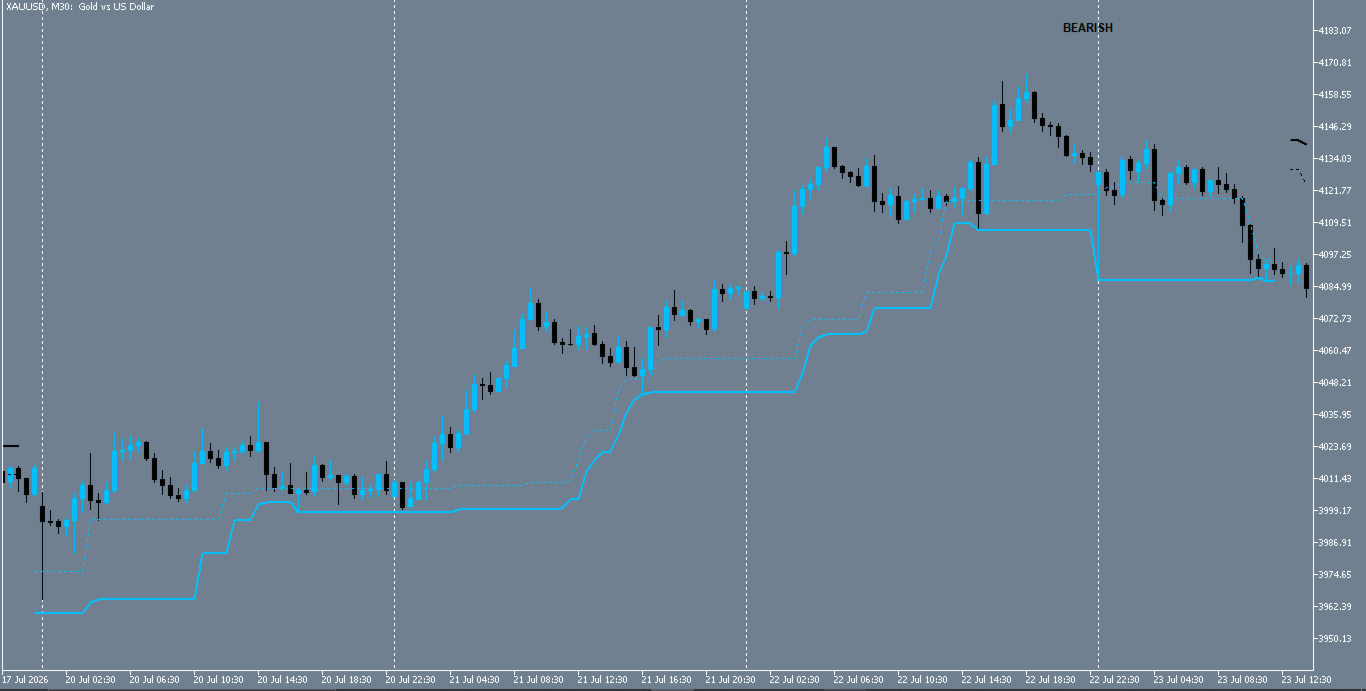
Cyclic Trend is a MetaTrader 5 indicator that presents a confirmed market bias and an adaptive price zone. It processes price data through a proprietary cycle-detection framework and outputs two visual elements: a trend label (BULLISH, BEARISH, or NEUTRAL) and a dynamic channel that appears on the relevant side of price (lower band during bullish phases, upper band during bearish phases).

Visual Output

  • A text label in a user‑selectable corner, with customisable font, size, colour, and offset.

  • A two‑level zone (inner and outer boundaries) that updates bar by bar. The zone is drawn only on the side corresponding to the current bias, reducing chart clutter.

Practical Use

  • Bias filter: The label indicates the preferred trading direction. In neutral phases, the indicator suggests avoiding new positions or reducing exposure.

  • Entry area: The displayed zone provides a structured price range. Traders may wait for price to reach the zone and then apply their own entry triggers.

  • Trade management: A close beyond the zone boundaries can serve as a signal to tighten stops or exit, as it may indicate the current cycle is losing momentum.

  • Multi‑timeframe context: The bias can be checked on a higher timeframe to align with the broader cycle, while zone interactions are executed on a lower timeframe.

Customisation

  • Adjustable channel lookback and phase thresholds to adapt to different market speeds.

  • Choice of price model (standard or Heikin‑Ashi) and source (e.g., close, high‑low median, typical).

  • Full visual control over the label and zone colours (set in the Colors tab).

Compatibility
Works on all symbols and timeframes, including forex, metals, indices, energy, and crypto. Suitable for manual trading and for integration into EA logic.

Risk Note
This indicator is a decision‑support tool. It does not guarantee profitable outcomes. Users should apply appropriate risk management and validate settings on their own markets before live use.
Altri dall’autore
CVD Range Divergencee
Jackson Mukurani Wanguthi
CVD Range Divergence   is a powerful volume-based technical indicator designed for MetaTrader 5 (MQL5). It calculates the Cumulative Volume Delta (CVD) by analyzing the difference between buying and selling pressure per candle, utilizing either Tick Volume or Real Volume. Multi-Period Swing Scanning : Automatically scans a user-defined range of swing periods (e.g., 9 to 13) to detect regular and hidden divergences between price peaks/troughs and CVD peaks/troughs. Weighted Delta Support : Includ

FREE
VWAP Anchor Tool
Jackson Mukurani Wanguthi
Anchored VWAP is a lightweight, interactive volume-weighted average price indicator designed for traders who need precision without clutter. Unlike standard VWAP that resets every session, this tool lets you drop up to five custom anchors directly on any candle. Each anchor calculates VWAP from that exact point forward, complete with standard deviation bands to highlight where price may find support or resistance relative to volume. Key Features: • Up to 5 simultaneous anchors — compare multi
FREE
Market Pulse Dashboard
Jackson Mukurani Wanguthi
A clean, information-dense dashboard that sits on your chart and answers the five questions every trader should ask before pulling the trigger: 1) What am I looking at? — Symbol, timeframe, live spread in points and pips. 2) When am I trading? — Active forex session with overlap detection, candle countdown timer, broker server time (auto-detected UTC offset, DST-proof), and your local time. 3) How much should this move? — 5 configurable ATR multiplier rows for quick SL/TP sizing, plus Daily,
FREE
Adaptive Alpha EMA
Jackson Mukurani Wanguthi
Adaptive Alpha EMA is a next-generation trend indicator that revolutionizes the classic EMA crossover by introducing real-time volatility responsiveness. Unlike traditional EMAs that rely on static periods, Adaptive Alpha EMA measures volatility speed through ATR (Average True Range) and automatically scales the alpha (smoothing factor) of both fast and slow EMAs. The result is an indicator that tightens during low-volatility consolidation and expands during explosive trend moves — delivering e
FREE
UniversalLevelAlert
Jackson Mukurani Wanguthi
4 (1)
UniversalLevelAlert is a free, lightweight MT5 chart indicator that combines price-level alerts with multi-timeframe candle-close alerts — all in one tool. What it does: Price Alerts: Set up to 5 horizontal alert lines directly on the chart. Drag them visually to adjust levels. Get notified when price comes within a trigger distance. Candle-Close Alerts: Monitor up to 5 timeframes simultaneously. Get alerted the moment a candle closes on any chosen timeframe, with bullish/bearish classification
FREE
ACE Signals
Jackson Mukurani Wanguthi
ACE Signals Adaptive Confluence Engine — Precision Entry Signals Through Multi-Layer Validation Tired of repainting arrow indicators that fire late, whipsaw in chop, and leave you holding the bag? Most signal indicators rely on a single condition — a moving average cross, an RSI spike, or a price pattern. In volatile markets, that is not enough. ACE Signals was engineered from the ground up to eliminate false entries by requiring three independent layers of market intelligence to align before a
FREE
Time Period Labels
Jackson Mukurani Wanguthi
4 (1)
TimePeriodLabels – See where new periods start on any chart A clean indicator that draws vertical lines and labels when a new year, month, week or day begins. No more squinting at dates or placing manual lines every time you open a chart. Each period type has its own colour and style so you instantly know what changed. What it does Detects when the day, week, month or year flips on the current timeframe. Draws a vertical line at the first bar of the new period. Adds a text label (for day, month
FREE
Asian Session Anchor Profile
Jackson Mukurani Wanguthi
Overview Asian Session Anchor Profile is a technical indicator for MetaTrader 5. It calculates reference levels from the Asian trading session and displays them on the chart. The levels remain visible during the following sessions and are updated as new data arrives. The indicator is an analysis tool. It does not open trades and does not provide buy or sell signals. Displayed elements The indicator draws the following elements on the chart: 1. Asian session range, shown as a rectangle betw
FREE
Risk Management Suite
Jackson Mukurani Wanguthi
RISK MANAGEMENT SUITE — YOUR STRATEGY. YOUR ENTRIES. INSTITUTIONAL DISCIPLINE ON EVERY TRADE. You already have a strategy. You can read the market. What hurts traders is not the strategy — it is everything that happens between "I see the trade" and "the trade is managed": the lot size you guessed, the stop you placed too tight, the target you moved, the revenge trade, the third pair you opened without realizing the first two were already the same bet. The Suite removes all of it. Forever. HOW I
Smartflow
Jackson Mukurani Wanguthi
Overview Smartflow is a technical indicator for MetaTrader 5 that displays directional trade signals, trend state and supply and demand levels in one chart window. It calculates a direction state from a volatility based trailing stop model using the Average True Range (ATR), and it prints buy and sell markers where that state changes on a closed bar. The indicator does not open trades and does not manage positions. All outputs are visual, and the decision to enter or exit a trade remains with
Filtro:
Nessuna recensione
Rispondi alla recensione