Quantam levels
- Indicatori
- Versione: 1.1
- Attivazioni: 5

Overview
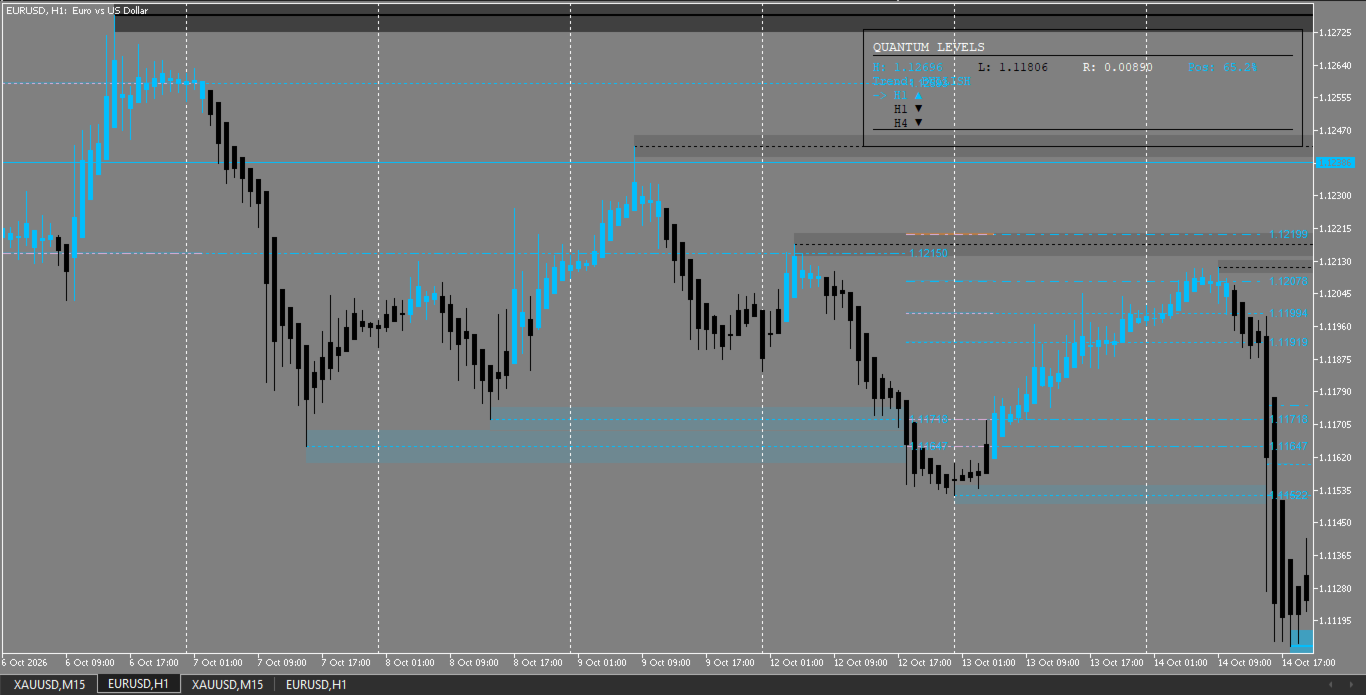
Quantum Levels is a technical indicator for MetaTrader 5. It calculates market structure zones, liquidity nodes, and a multi-layer price consensus, and displays these elements directly on the chart.
Displayed elements
The indicator provides the following elements:
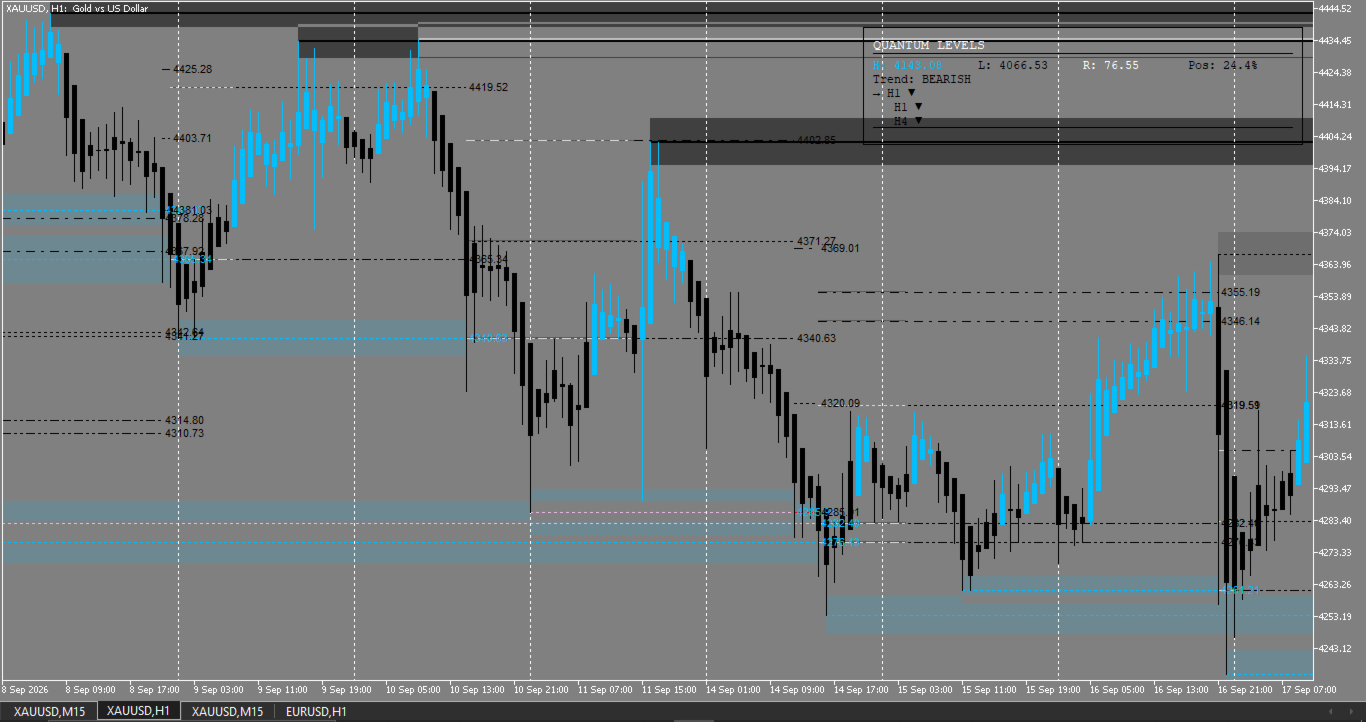
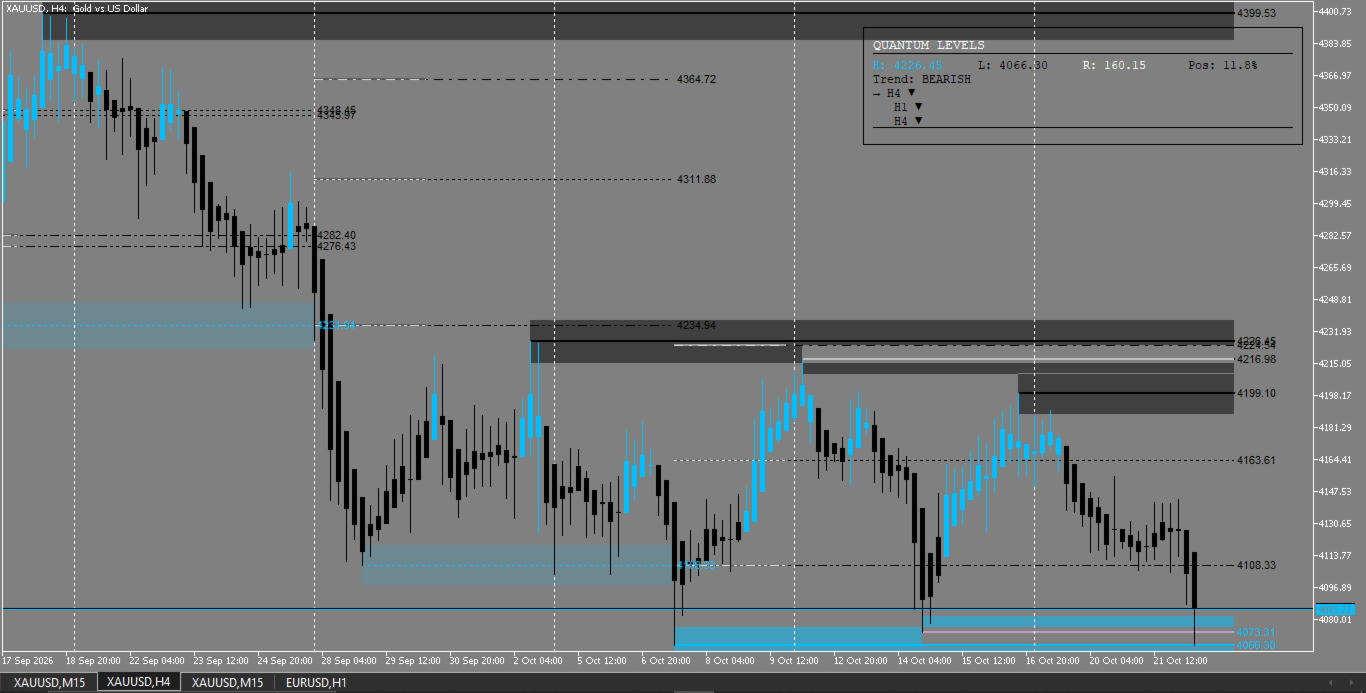
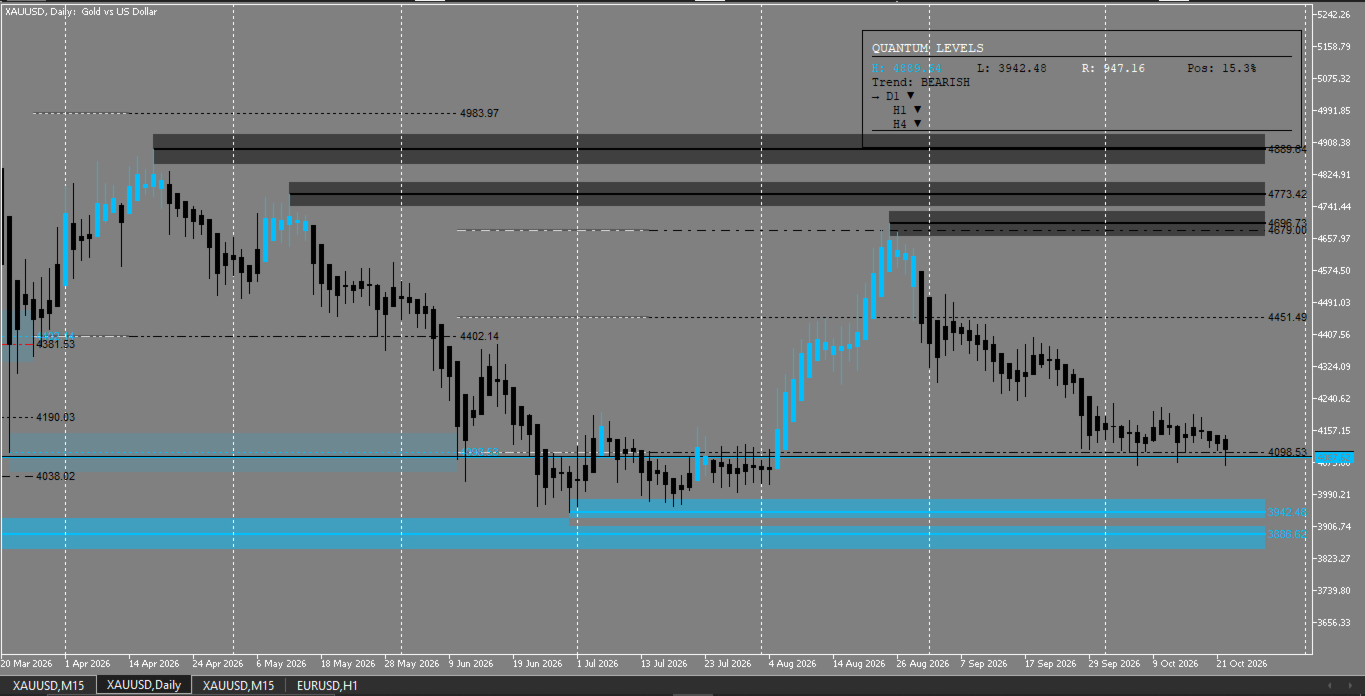
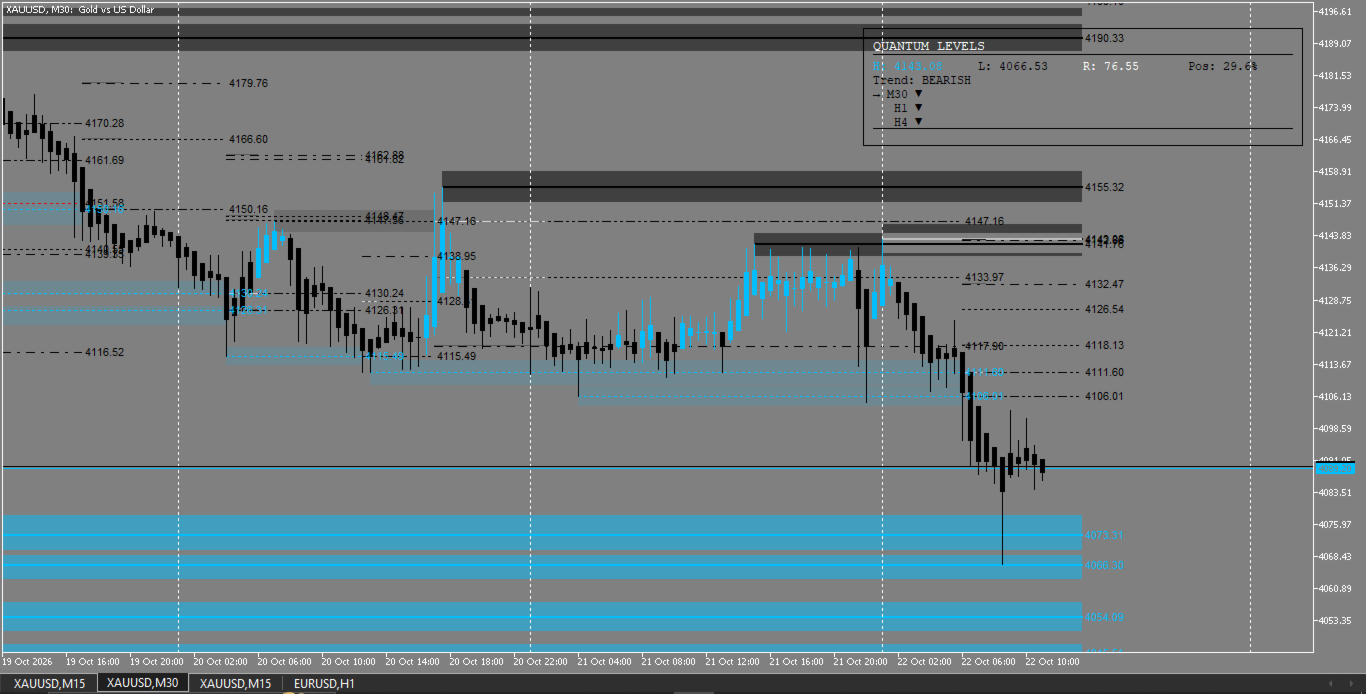
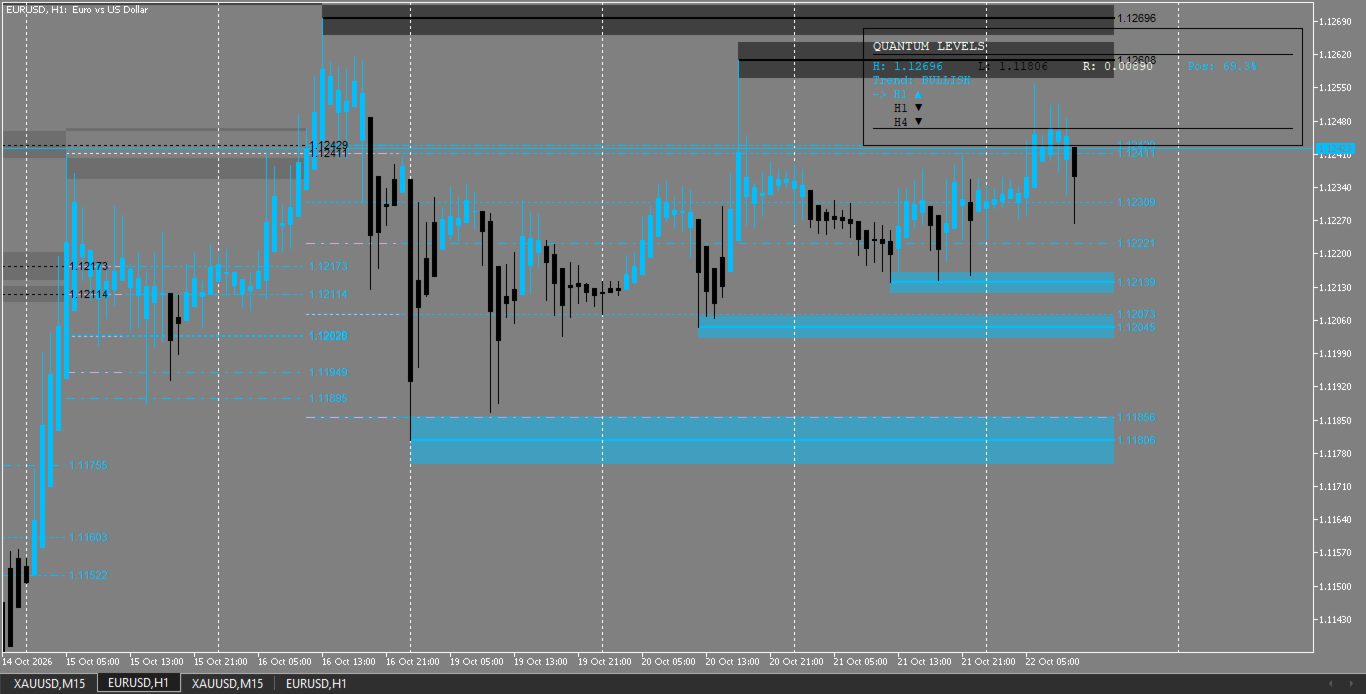
1. Market structure zones based on swing highs and lows, indicating active and broken structural areas.
2. Liquidity node areas and shift lines derived from structural breaks.
3. Color-coded consensus candles representing price agreement across multiple calculation layers.
4. A dashboard (HUD) displaying the session high, low, range, structural trend, and range position.
5. Multi-timeframe trend rows within the dashboard, showing the current chart timeframe and two higher timeframes.
6. Optional directional arrows placed on the chart when specific internal conditions are met.
Interpretation
The market structure zones indicate areas where price previously reversed or accelerated. The liquidity nodes display areas derived from the distance between structural points and volatility. The dashboard summarizes the current market state, including the high, low, and range measured from the most recent structural break, as well as the current price position within that range. The multi-timeframe rows show the structural direction for the current chart, a higher timeframe, and a macro timeframe.
How these outputs are applied is the trader's own decision.
Input parameters
The parameters are grouped as follows:
1. Market Structure Engine: Structure swing resolution, historical scan depth, structural zone display, volatility baseline period, zone width and precision, zone opacity, price label display, and broken structure display.
2. Liquidity and Institutional Nodes: Independent toggles, reactivity periods, expansion multipliers, zone periods, zone multipliers, opacity, and colors for Primary Node, Secondary Node, and Tertiary Node.
3. Alpha Consensus Algorithm: Underlying price source, consensus price weighting, adaptive volatility factor, consensus volatility period, signal and confirmation response periods, colors, and plot visibility toggles.
4. Multi-Timeframe Confluence: Enable toggle, higher timeframe target, macro timeframe target, and display toggles for each timeframe row.
5. Trading Signals and Alerts: Enable toggle, arrow identifiers, arrow placement shifts, arrow colors, and arrow size.
6. HUD and Visual Theme: Dashboard enable toggle, screen corner, X and Y offsets, font size, background color, border color, text colors, and display toggles for High/Low, Trend, and Position rows.
Technical notes
The indicator works on any symbol and timeframe and uses the data of the current chart. It calculates adaptive volatility internally using standard platform functions. It does not use DLLs, external resources, or network requests. All displayed elements are chart objects created by the indicator.
Risk notice
Please test the product on a demo account and in the Strategy Tester before using it on a live account.