AB LiquidityMap
- Indicatori
- Versione: 1.0
- Attivazioni: 5

How it works
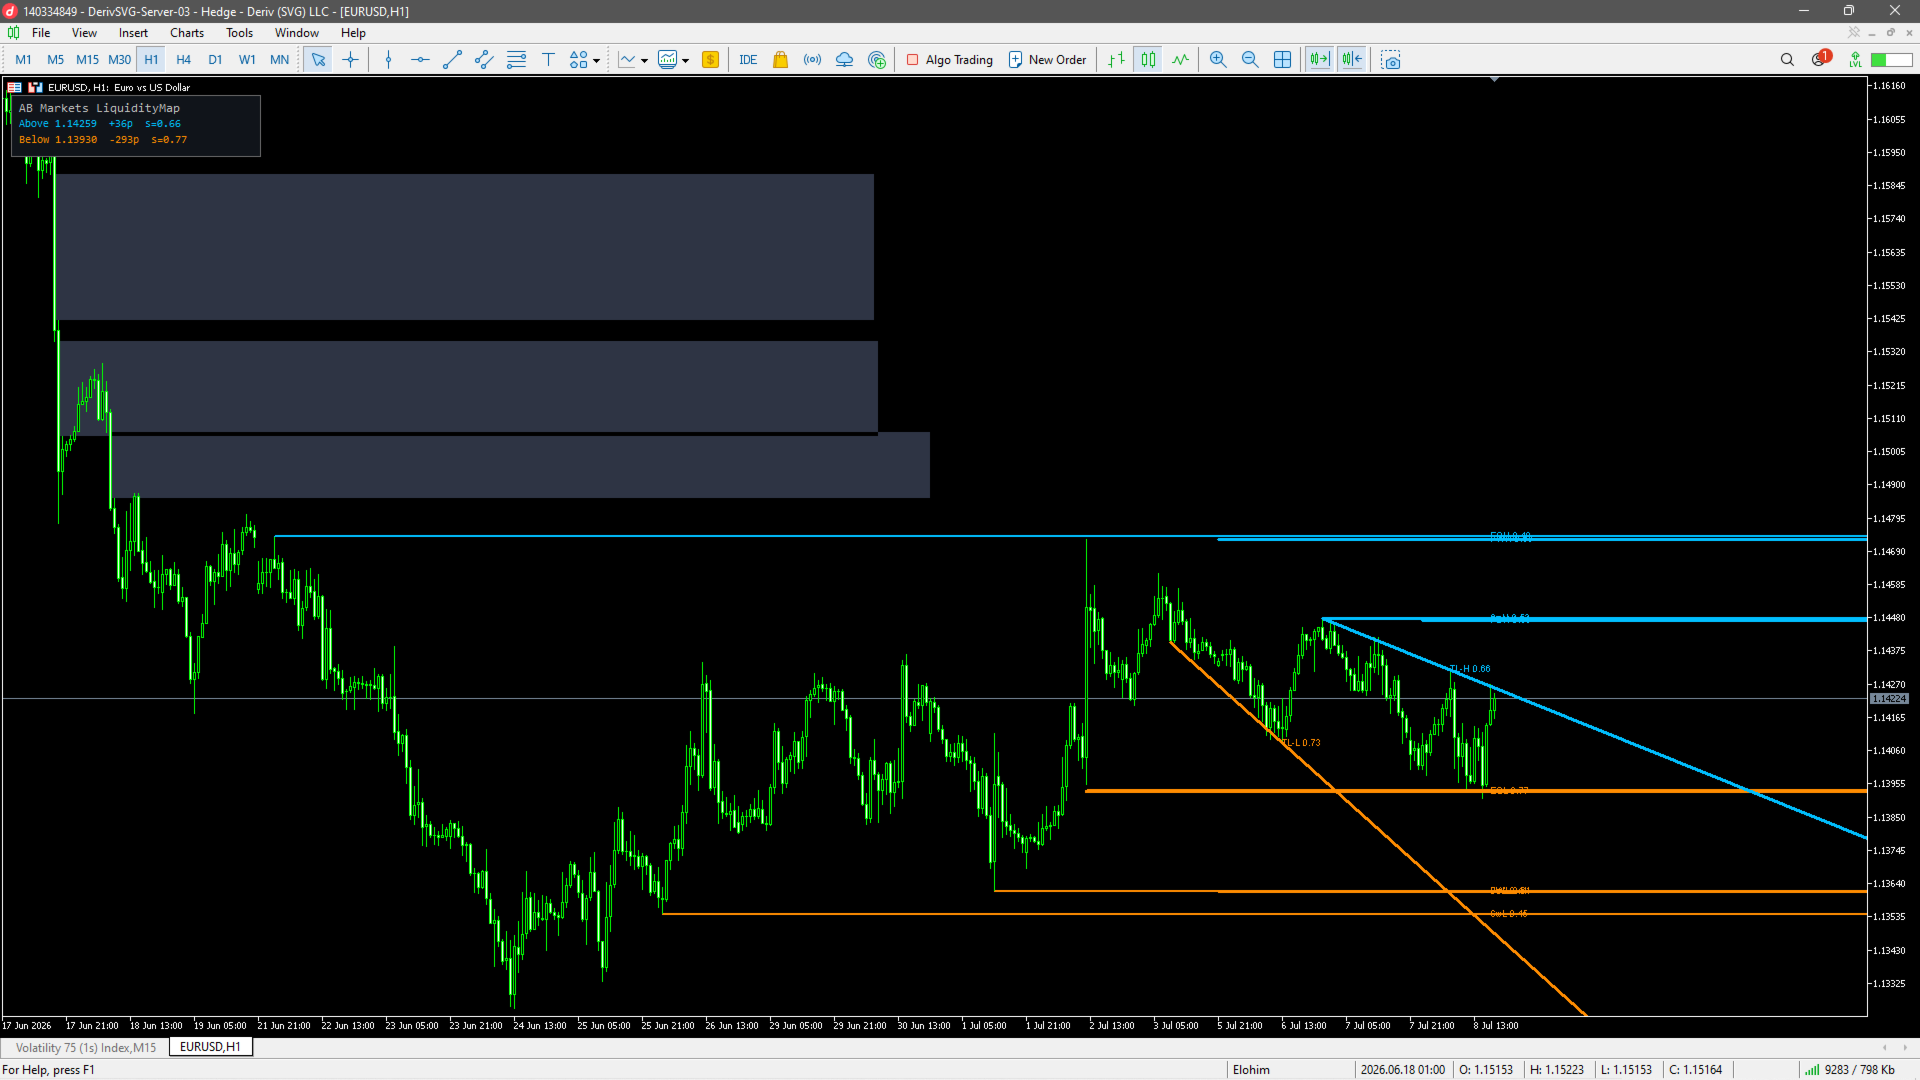
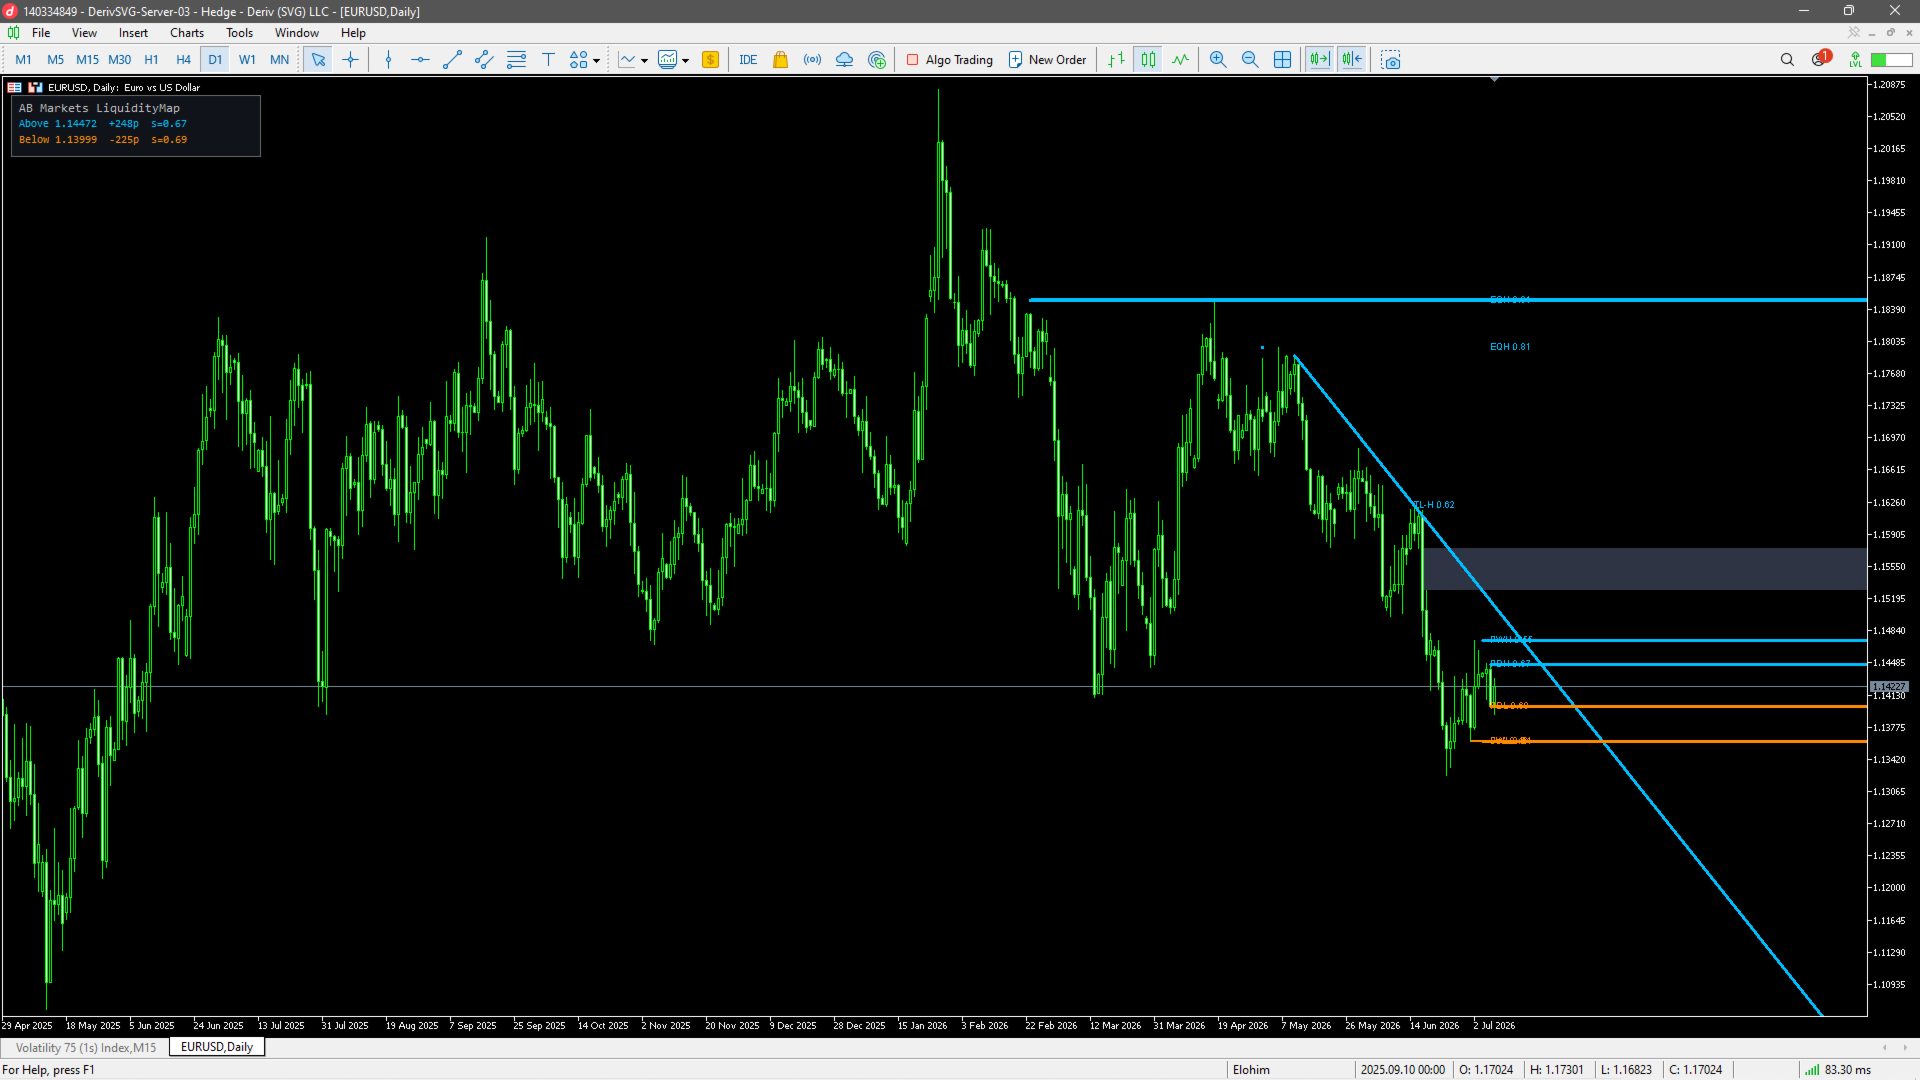
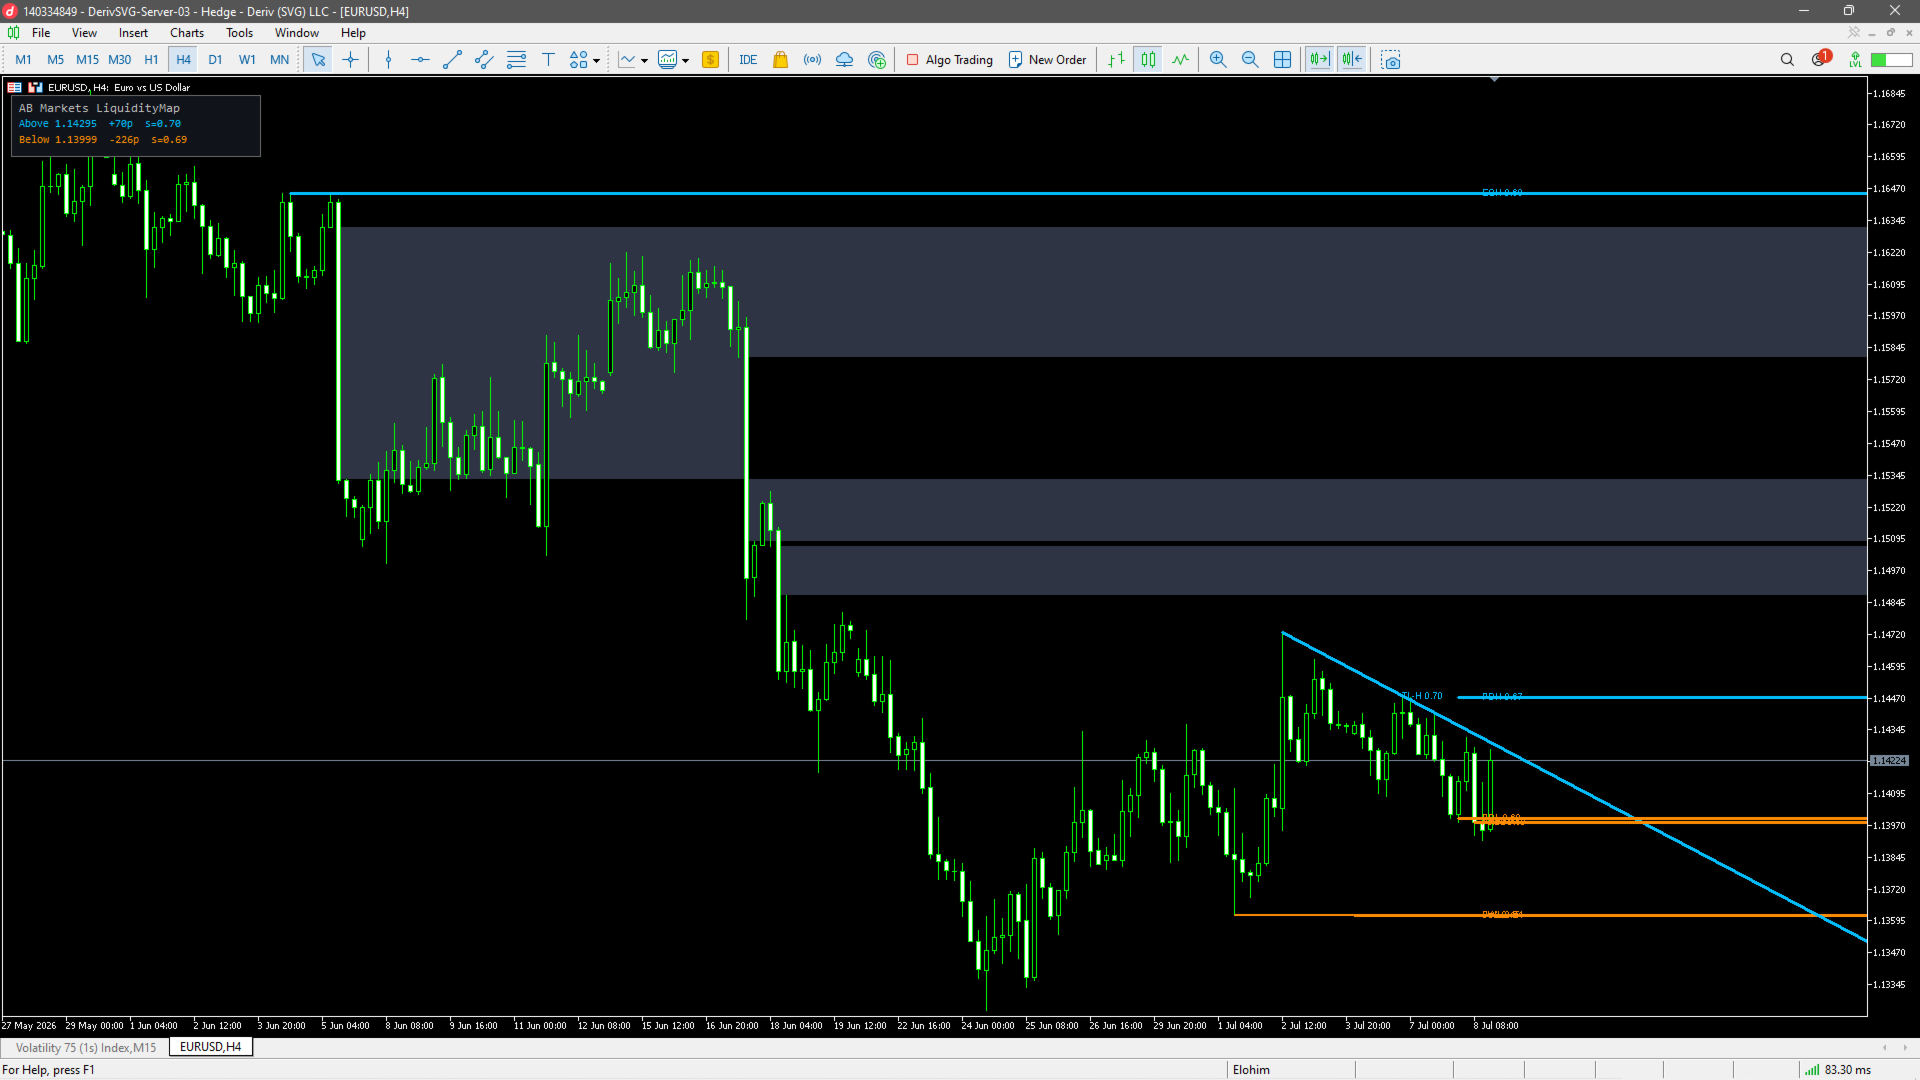
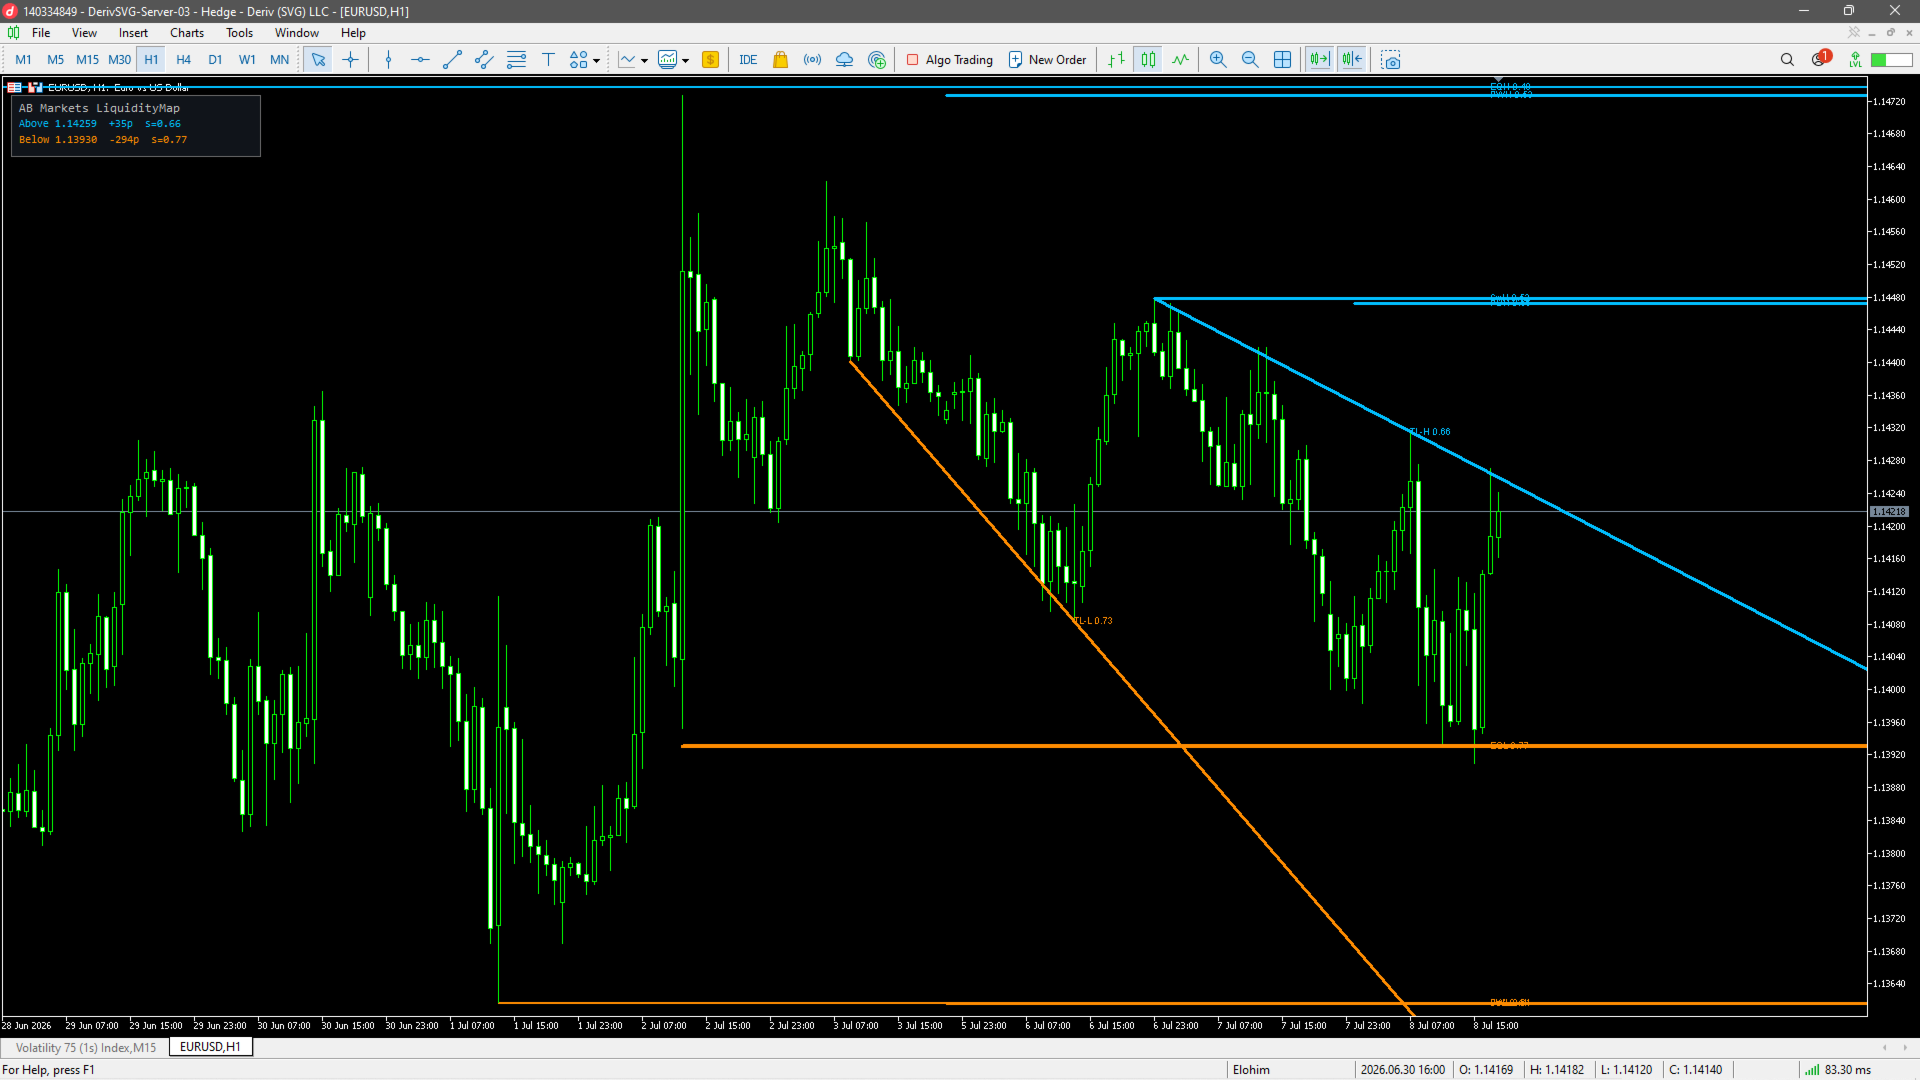
– Pool detection — equal highs/lows (within an ATR-scaled tolerance), unswept swing highs/lows, session and daily/weekly extremes, and trendline liquidity (3+ touch diagonal clusters where stops accumulate).
– Pool weighting — each pool scored by touch count, age, round-number proximity and origin timeframe, then drawn with thickness/opacity proportional to score. The chart literally shows where the fuel is.
– Sweep engine — a sweep registers when price wicks through a pool and closes back inside within K bars. Classified as sweep-and-reverse (fuel taken, reversal context) or sweep-and-go (genuine breakout).
– Liquidity voids — low-participation zones that price tends to retrace through quickly are shaded automatically.
A dashboard shows the nearest pool above and below with live distance in points and its score.
Marketplace description
| The market is an engine that runs on stop-losses. LiquidityMap shows you the fuel tank. It automatically detects and scores every resting liquidity pool — equal highs/lows, unswept swings, session and daily extremes, trendline stop clusters — and draws them weighted by size, so the most magnetic levels are the most visible. The sweep engine then classifies every raid in real time: sweep-and-reverse (liquidity grabbed, reversal context active) or sweep-and-go (real breakout). Liquidity voids are shaded so you know where price travels fast. Nearest-pool dashboard with a live distance readout. This is the map layer every SMC, ICT and price-action trader needs under their strategy. Non-repainting, EA-ready. |