CorrelFusion
- Indicatori
-
Noel Anjao Alube
 Dedicated to developing smart, data-driven trading solutions with a strong focus on performance, risk management, and innovation. Committed to transforming trading ideas into automated strategies.
 - Versione: 2.0
- Attivazioni: 5
CorrelFusion - Multi-Symbol Correlation Matrix & Rolling Heatmap
Overview
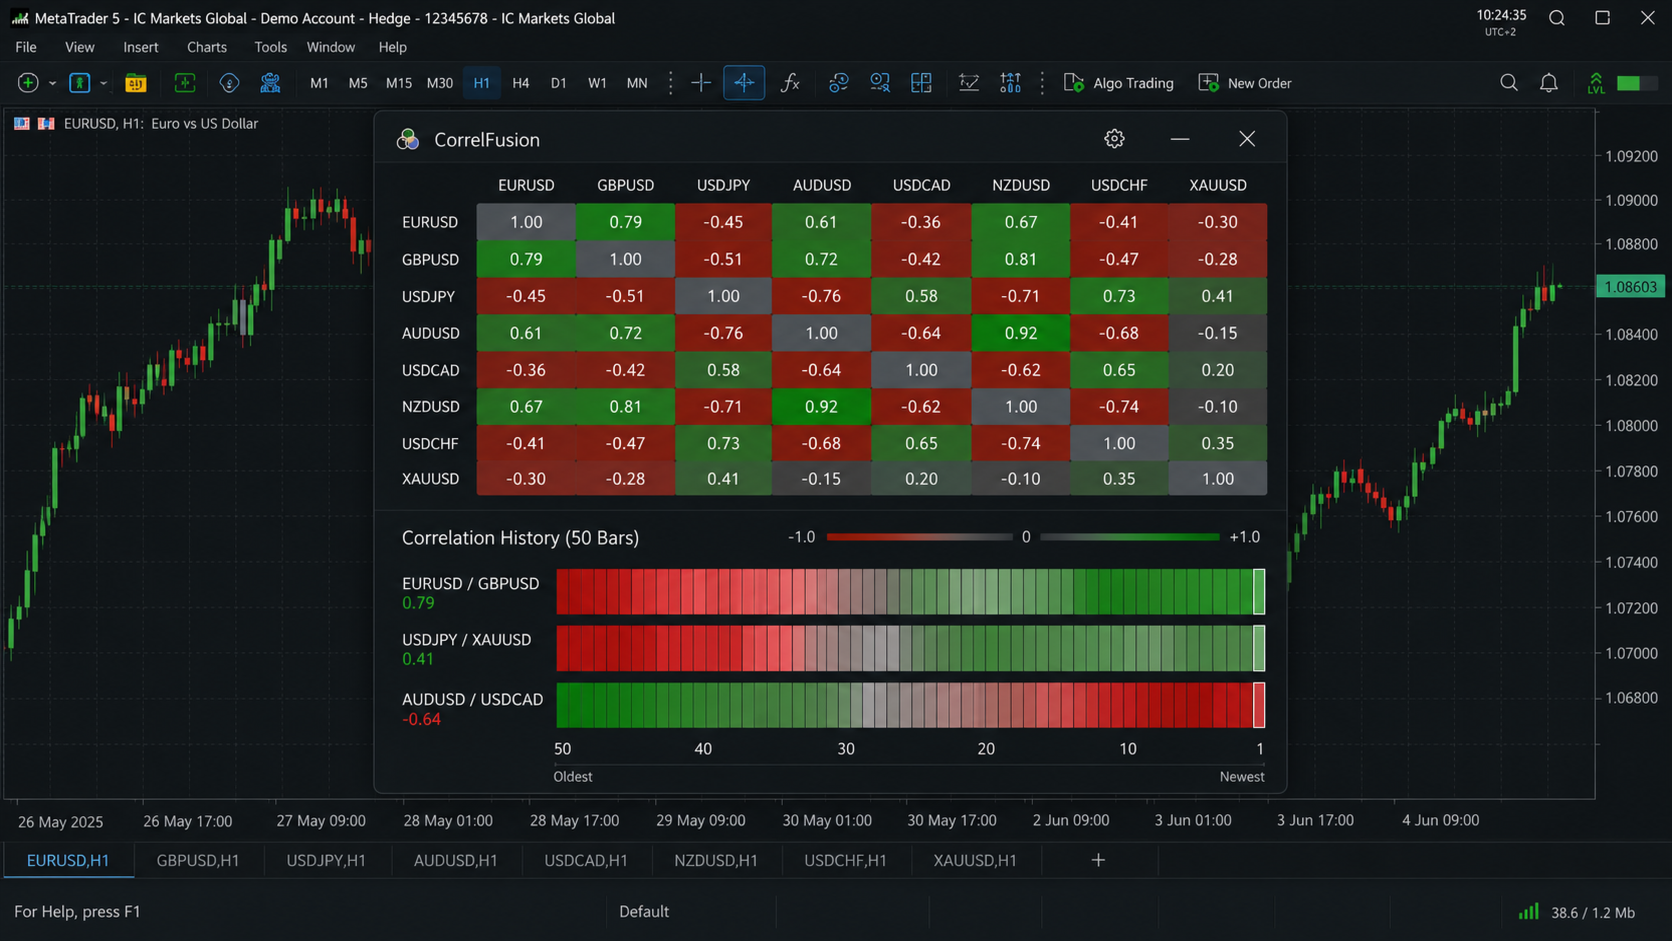
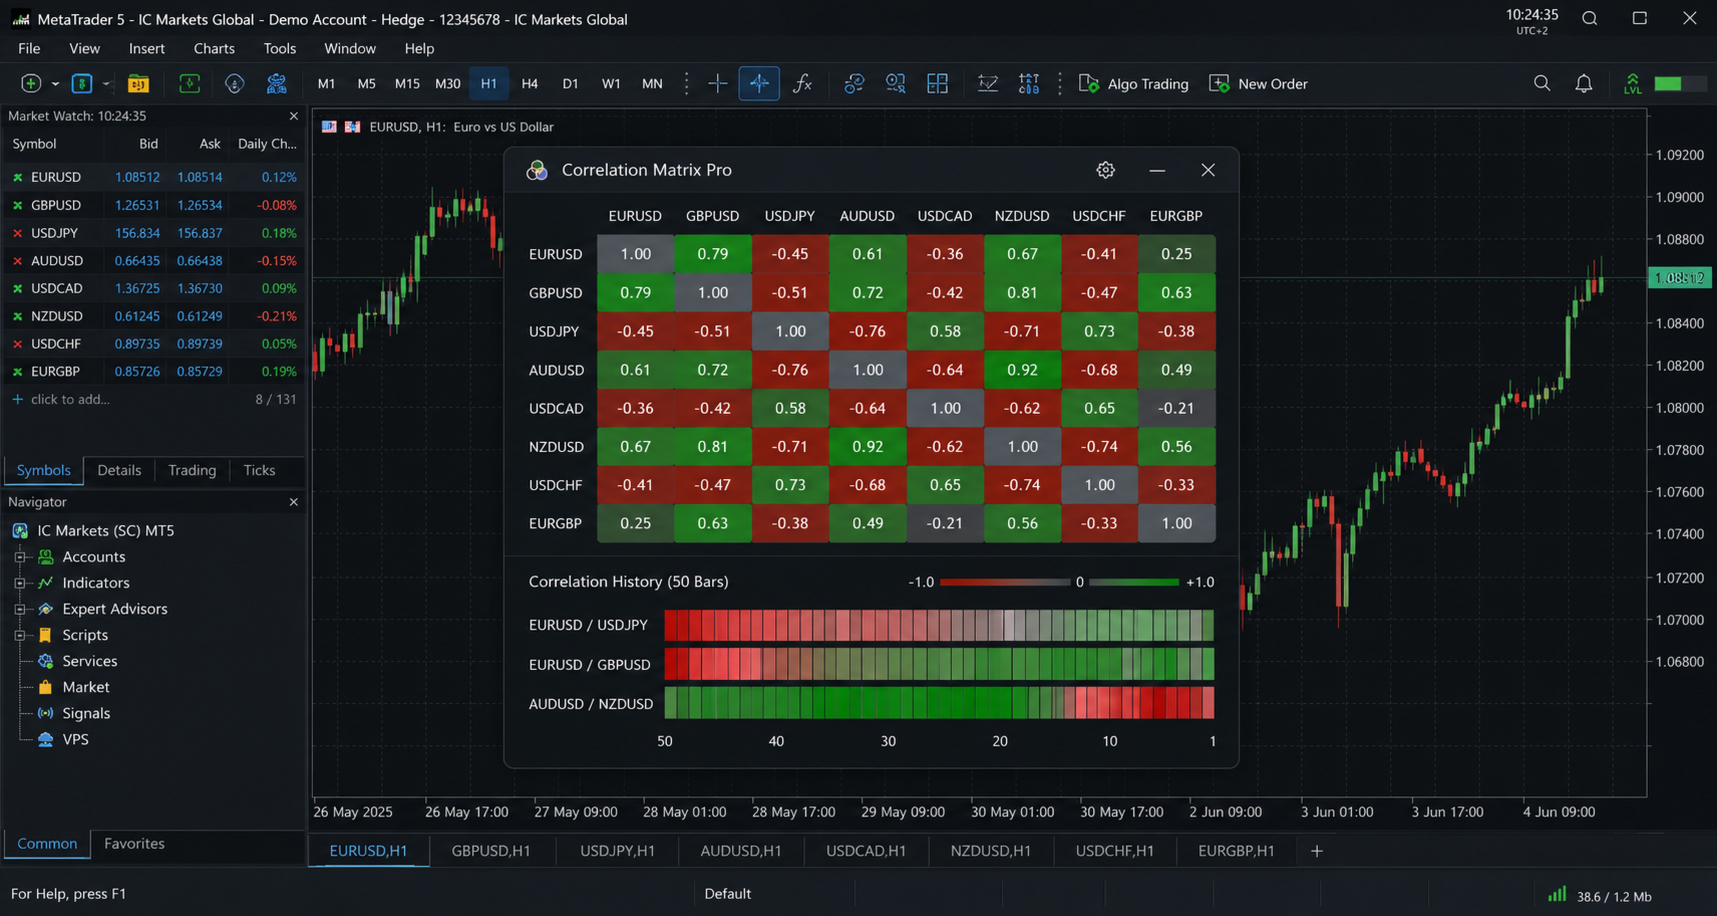
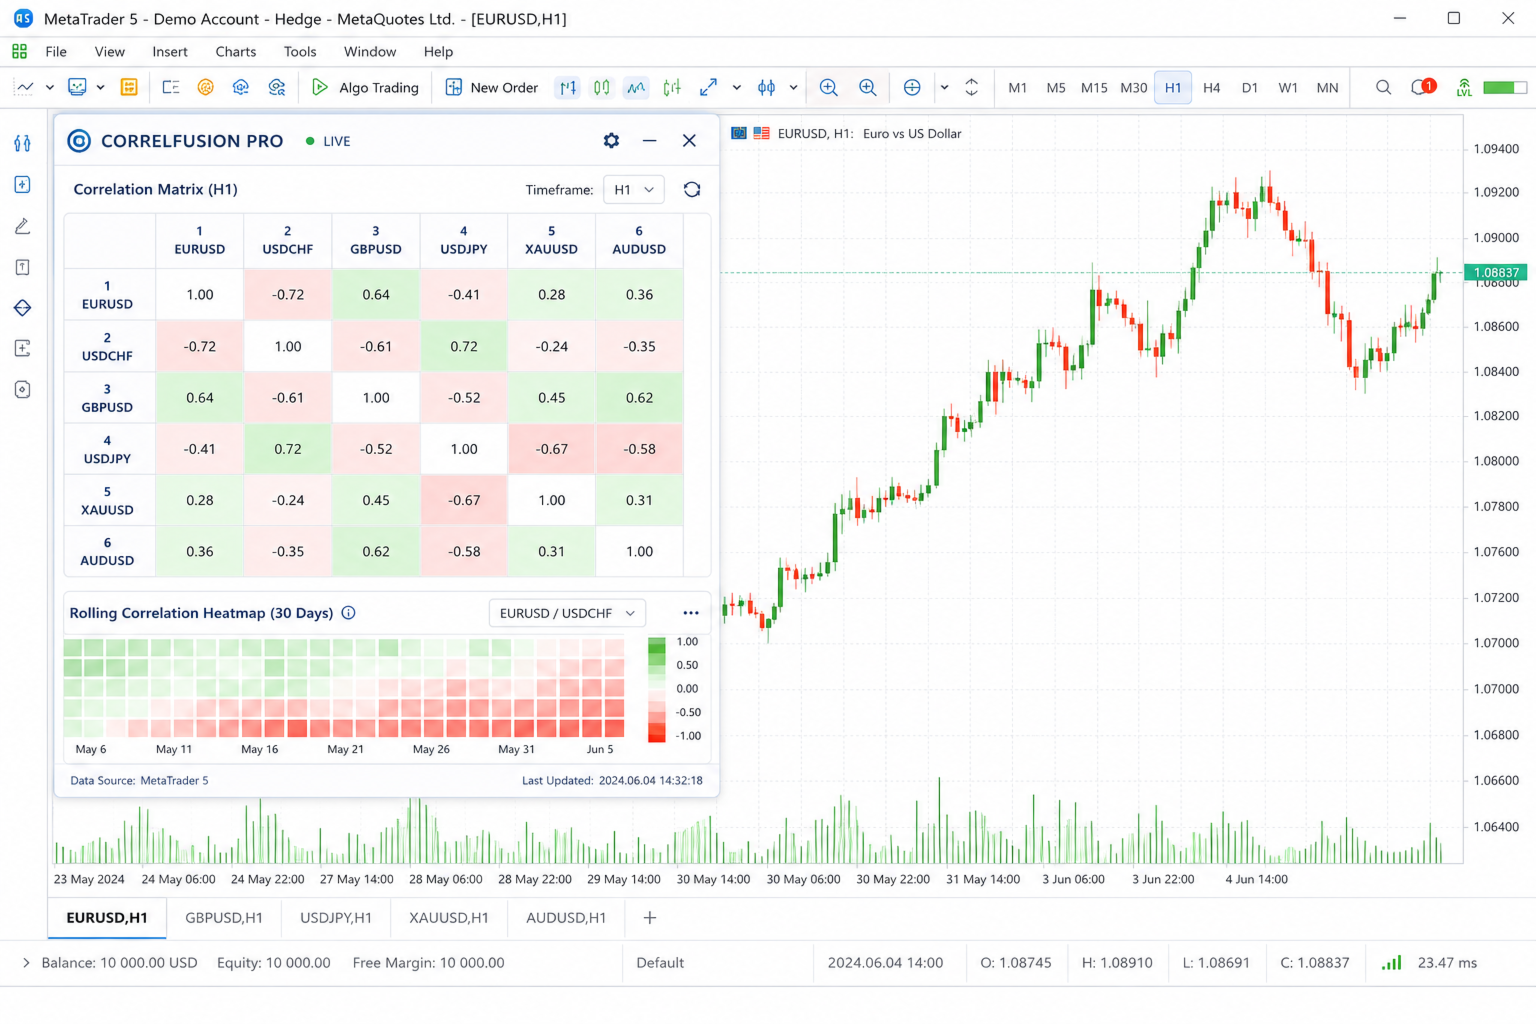
CorrelFusion is a professional correlation analysis tool for MetaTrader 5 that displays a live correlation matrix for up to 10 symbols simultaneously. It features a unique rolling heatmap that visualizes how correlations evolve over time, helping traders identify diversification opportunities, hedge relationships, and market regime shifts at a glance.
Key Features
Live Correlation Matrix
-
Displays Pearson correlation coefficients for up to 10 symbols in a clean, color-coded grid
-
Visual strength bars show correlation intensity at a glance
-
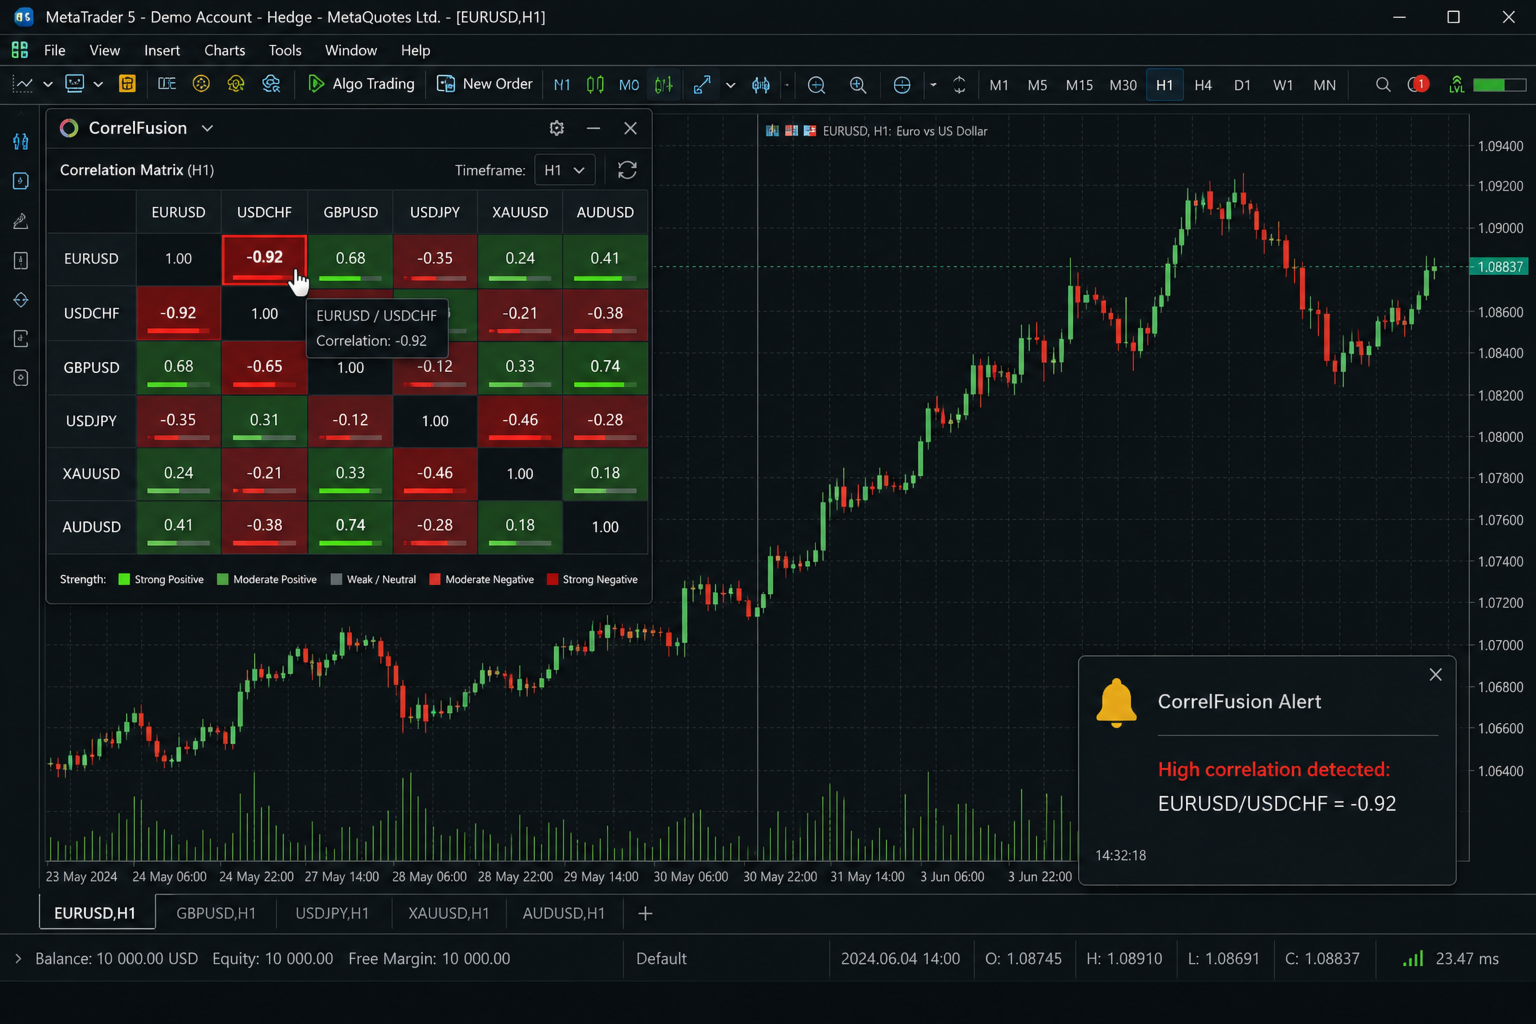
Positive correlations in green, negative in red, neutral in gray
-
Diagonal elements clearly marked for easy orientation
Rolling Heatmap
-
Tracks correlation history over user-defined bars (up to 200)
-
Smooth color gradient from red (negative) through gray (neutral) to green (positive)
-
Shows how correlations have changed over time, revealing shifting market relationships
-
Customizable symbol pairs for focused analysis
Interactive Interface
-
Click any matrix cell to instantly open a chart of the selected symbol pair
-
Real-time updates on new bars or timer-based refresh
-
Dark and light theme options for comfortable viewing
-
Adjustable panel position, cell size, and header width
Alert System
-
Threshold-based alerts when absolute correlation exceeds user-defined level (default 0.90)
-
Popup alerts and optional push notifications
-
Prevents repeated alerts until correlation drops below threshold
Customizable Display
-
Toggle value display on/off
-
Show or hide strength bars
-
Adjust high/low correlation color thresholds
-
Choose from up to 10 user-defined symbols (including empty slots)
Input Parameters
Symbols
-
Sym1 to Sym10: Define up to 10 symbols to analyze (e.g., EURUSD, GBPUSD, XAUUSD)
Correlation Settings
-
CorrPeriod: Number of bars for correlation calculation (default 20)
-
TF: Timeframe for data (current or custom)
-
UpdateOnTimer: Enable automatic updates
-
TimerSeconds: Update interval when timer is active
Rolling Heatmap
-
ShowHeatmap: Toggle heatmap visibility
-
HeatmapBars: Number of historical bars to display (max 200)
-
HeatmapCellH: Height of each heatmap row
-
HM1A/HM1B to HM3A/HM3B: Symbol pairs for heatmap rows
Panel Position
-
PanelX, PanelY: Screen position
-
CellSize: Matrix cell dimensions
-
HeaderWidth: Row/column header size
Visual Theme
-
DarkMode: Toggle dark/light theme
-
ShowValues: Display correlation numbers in cells
-
ShowStrengthBar: Show intensity bars in cells
-
HighCorrThresh, LowCorrThresh: Color transition thresholds
Alerts
-
EnableAlerts: Activate notification system
-
AlertThreshold: Correlation level that triggers alerts (default 0.90)
-
EnablePushNotif: Send mobile push notifications
How It Works
CorrelFusion calculates Pearson correlation coefficients using log-returns of closing prices. The matrix shows current correlations while the heatmap stores historical values, allowing traders to see how relationships between instruments have evolved over time.
For example, if EURUSD and GBPUSD typically show a strong positive correlation, a sudden drop in their correlation value may indicate a market shift or changing fundamentals.
Use Cases
-
Identify diversification candidates among correlated assets
-
Monitor hedging relationships between currency pairs
-
Detect early signs of market regime changes
-
Visualize inter-market relationships
-
Find assets with stable or shifting correlation structures
System Requirements
-
MetaTrader 5 build 4000 or higher
-
Minimum 2 symbols required (up to 10 supported)
-
Sufficient historical data for selected timeframe and period
Installation
-
Place CorrelFusion.ex5 in your MT5 Indicators folder
-
Attach to any chart
-
Configure symbols and parameters in the Inputs tab
-
The panel will appear on the chart
Support
For questions, feature requests, or bug reports, please contact the developer through the MQL5 messaging system.
Version History
v2.00 - Initial release
-
Live correlation matrix with color coding
-
Rolling heatmap visualization
-
Click-to-chart functionality
-
Alert system with push notifications
-
Dark/light theme support
Disclaimer: Past correlation does not guarantee future results. This indicator is for informational purposes only and should not be considered trading advice. Always conduct your own analysis before making trading decisions