Pivot Breakout Map
- Indicatori
- Versione: 1.0
- Attivazioni: 5

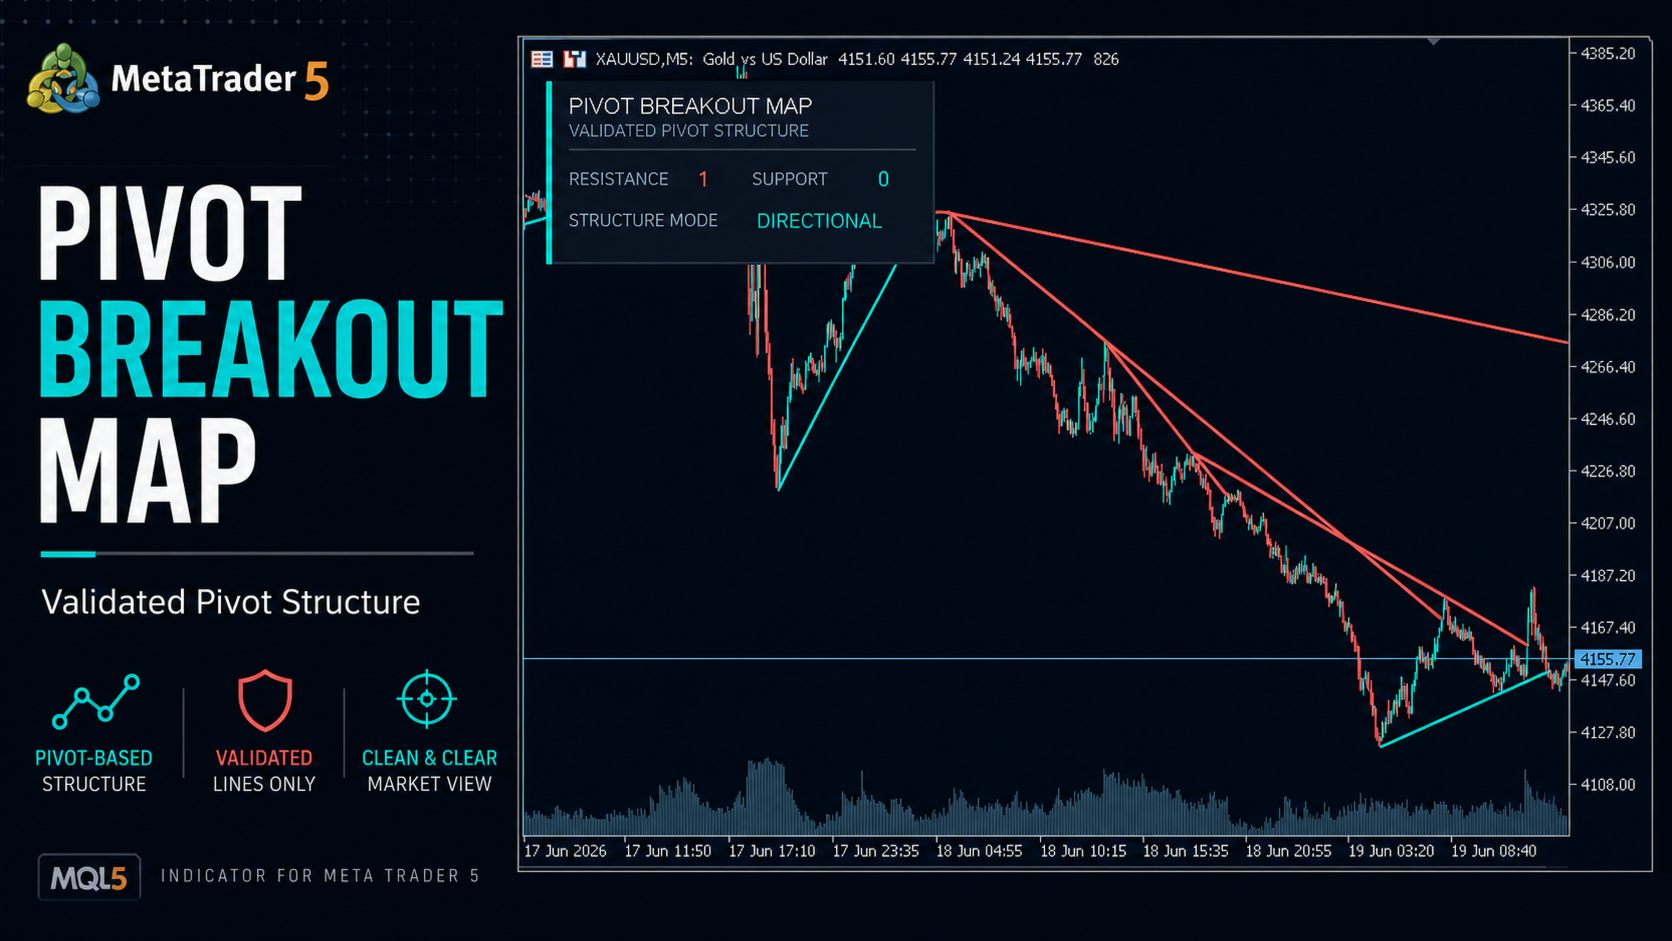
Pivot Breakout Map
Pivot Breakout Map is a visual indicator for MetaTrader 5 that automatically connects confirmed pivot highs and lows to create dynamic support and resistance trendlines.
When price closes beyond an active trendline, the indicator marks the breakout and generates a complete trade map with Entry, Stop Loss and three Take Profit levels.
Main Features
- Automatic pivot-based trendlines
- Confirmed bullish and bearish breakout signals
- Entry, Stop Loss and TP1–TP3 projection
- ATR or percentage-based Stop Loss
- Customizable risk-to-reward ratios
- Visual risk and reward zones
- Optional signal labels and arrows
- On-chart dashboard
- Popup and push notifications
- Compatible with different symbols and timeframes
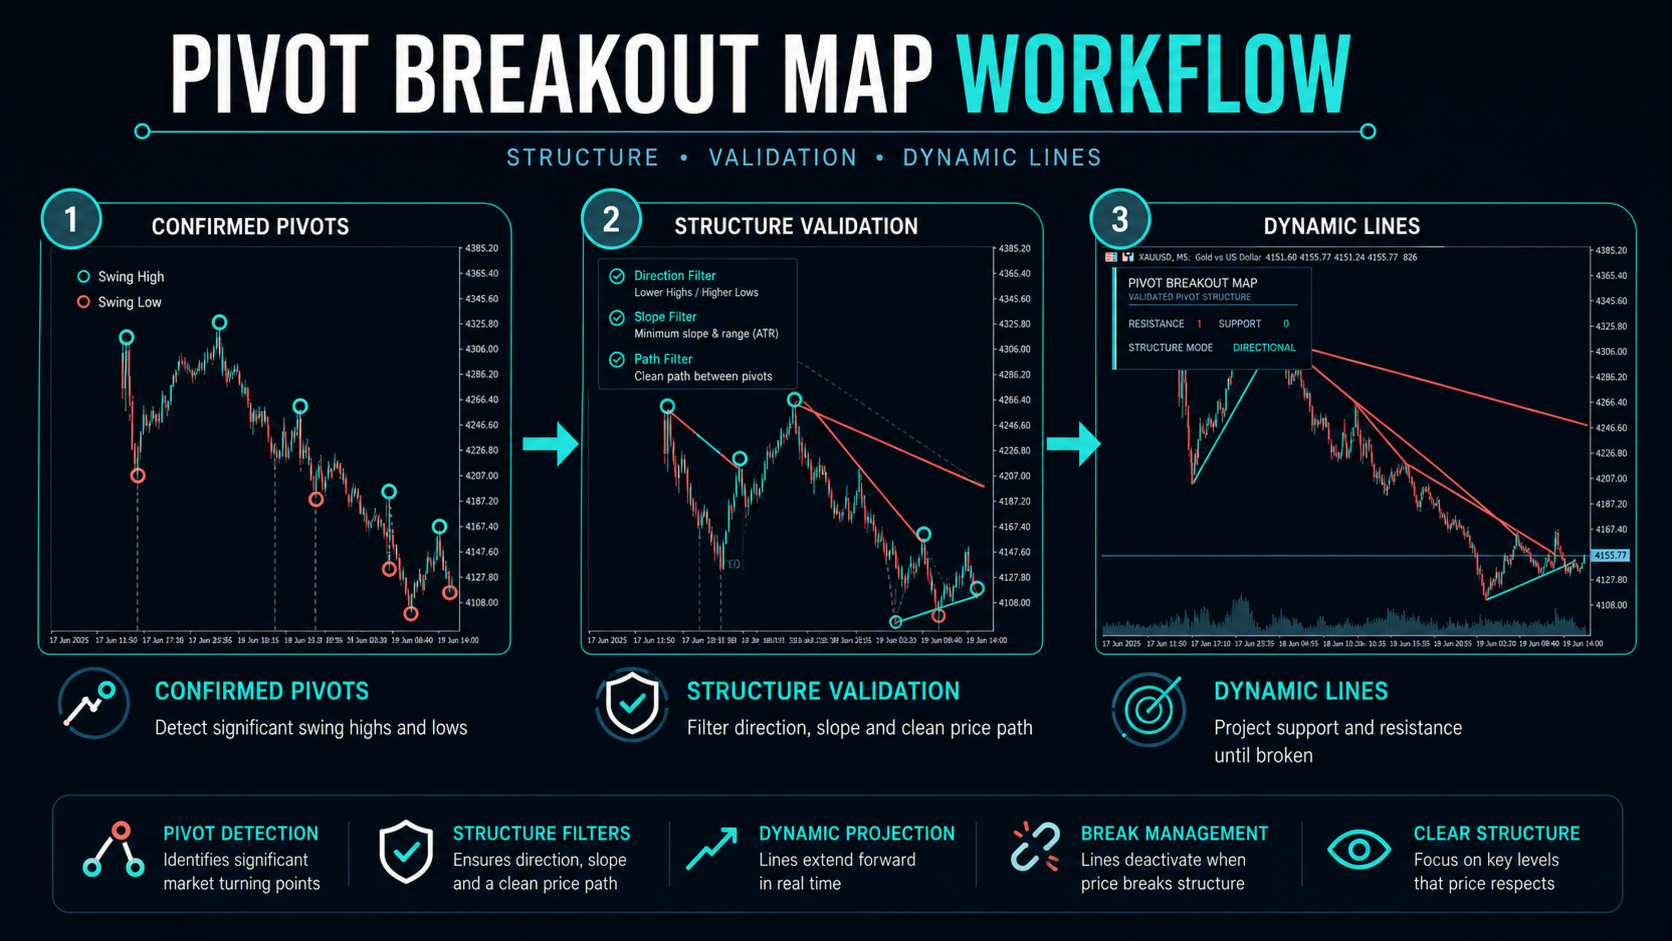
How It Works
The indicator detects confirmed market pivots and connects consecutive highs and lows. A Buy signal appears when price closes above an active resistance line, while a Sell signal appears when price closes below an active support line.
After a breakout, the trade map provides structured reference levels for planning and managing the setup. Pivot confirmation requires future bars, so trendlines are displayed only after the selected Pivot Right period has completed.
Pivot Breakout Map is an analytical tool and does not open or manage trades automatically.