Market Temperature Map
- Indicatori
- Versione: 1.0

Market Temperature Map
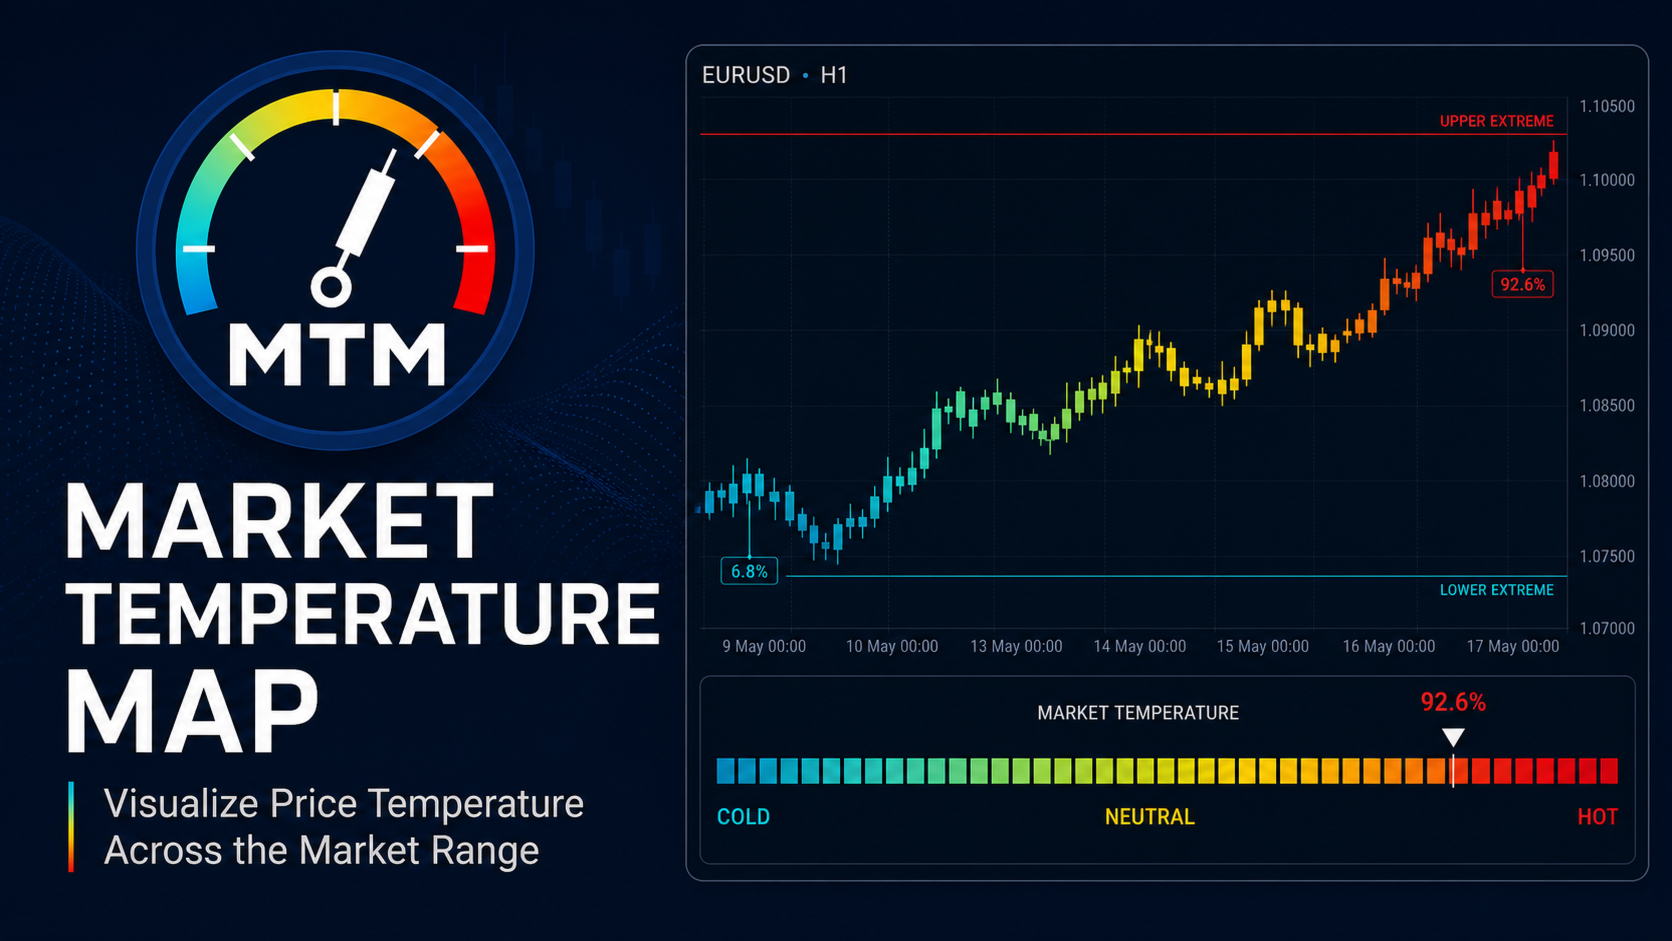
Market Temperature Map is a visual indicator for MetaTrader 5 designed to show where the current price is positioned within its recent trading range.
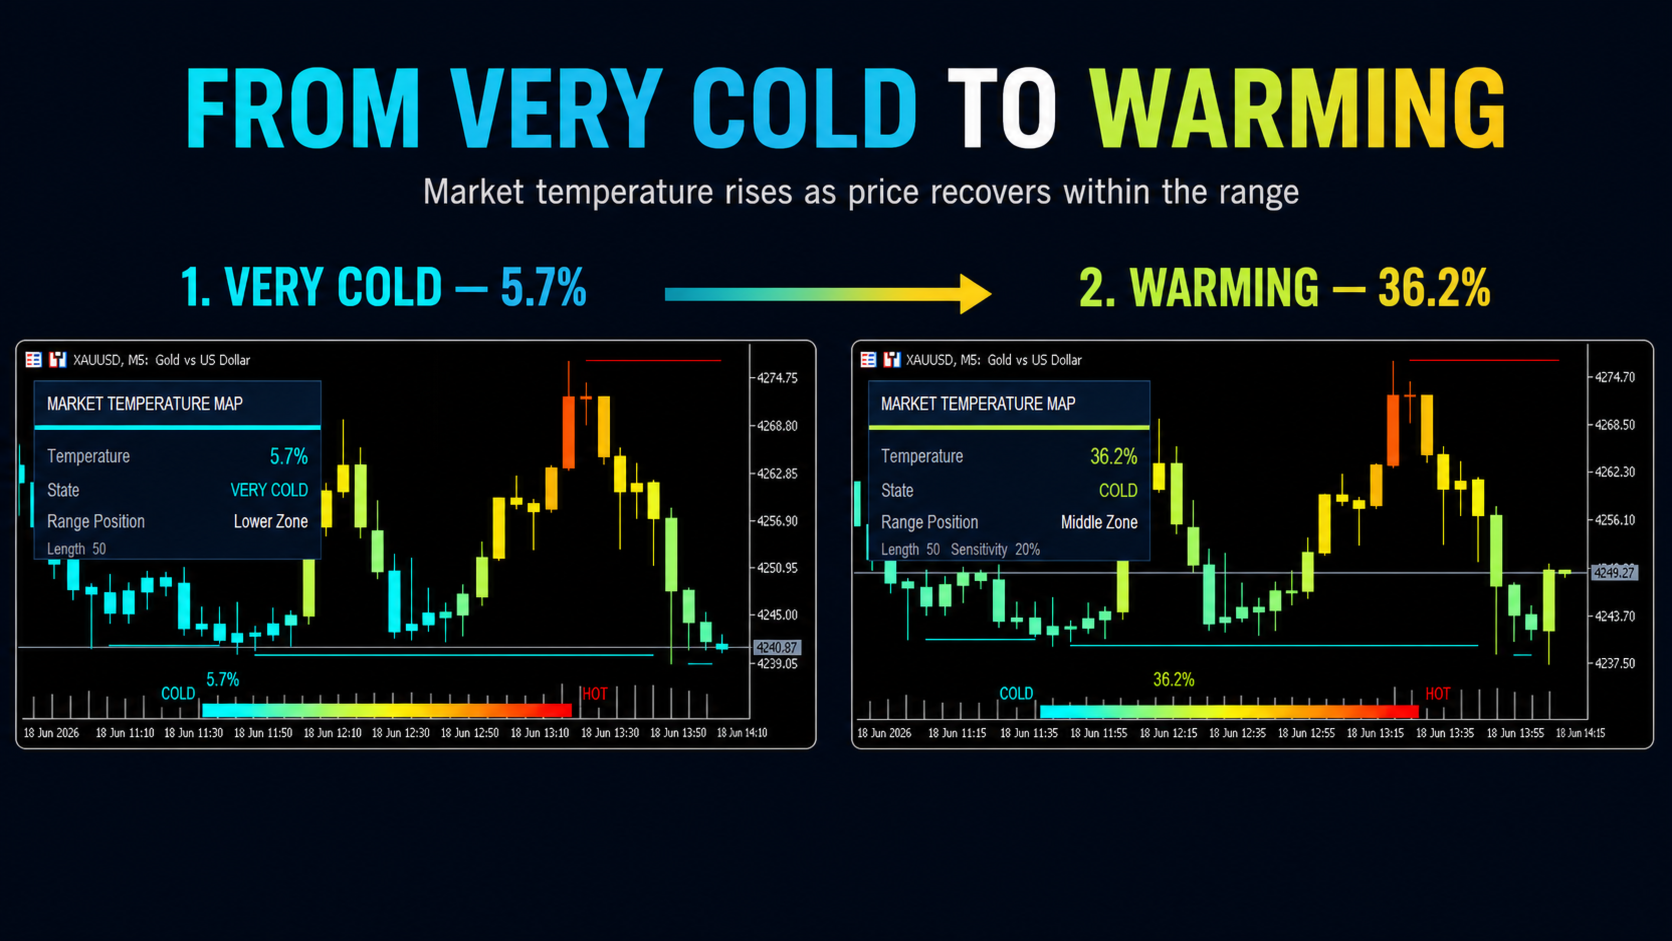
The indicator transforms this relative price position into a dynamic temperature scale. Cold colors represent prices near the lower part of the range, while hot colors represent prices near the upper part. This provides a fast and intuitive view of market pressure, momentum and potential exhaustion areas.
How It Works
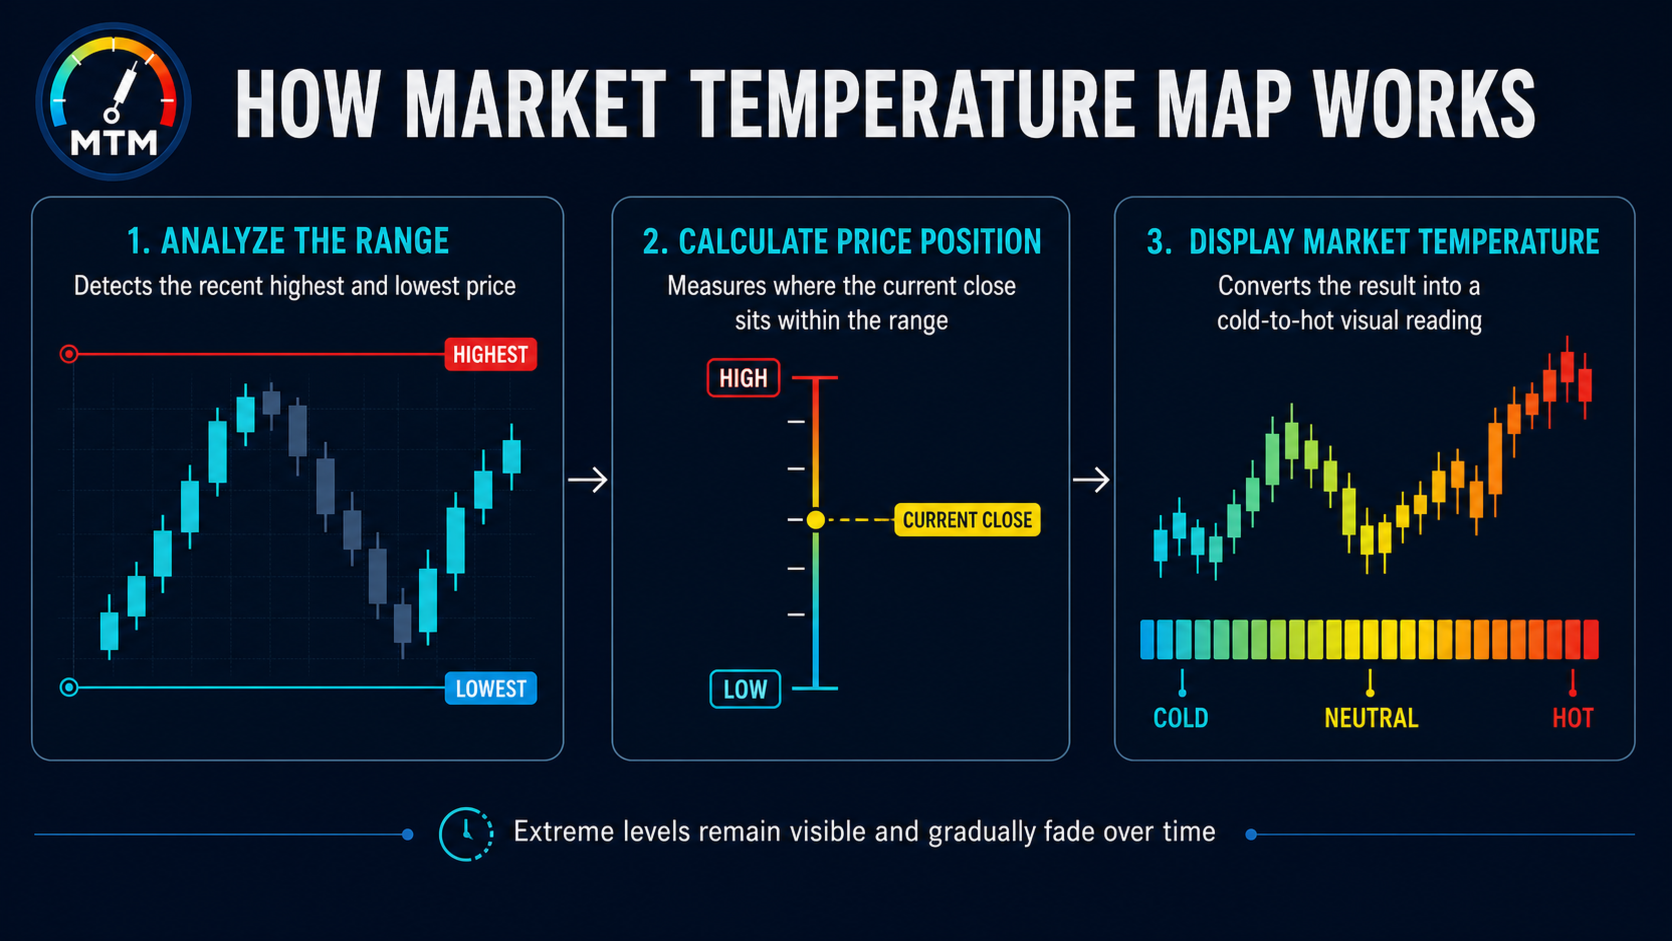
The indicator calculates the highest and lowest prices over a configurable lookback period. The current closing price is then normalized within that range and expressed as a percentage from 0% to 100%.
- Values near 0% indicate that price is close to the lower boundary
- Values near 50% indicate that price is near the middle of the range
- Values near 100% indicate that price is close to the upper boundary
This percentage controls the candle colors and the marker position on the temperature meter.
Main Features
- Dynamic cold-to-hot candle coloring
- Real-time market temperature meter
- Automatic upper and lower extreme levels
- Confirmed extreme labels with temperature percentages
- Customizable calculation period and colors
- Compatible with any symbol and timeframe
Extreme Levels
When a new high or low is detected, the indicator tracks how long that level remains unbroken. Confirmed extremes can be marked directly on the chart together with the temperature percentage recorded during their formation.
The upper and lower lines gradually fade as they become older, allowing recent levels to remain visually prominent without overcrowding the chart.
Practical Use
Market Temperature Map can help traders evaluate whether price is trading near the upper, middle or lower portion of its recent range. It may support trend analysis, pullback evaluation, breakout monitoring and the identification of potentially extended market conditions.
The temperature reading should not be interpreted as an automatic buy or sell signal. A hot market can continue rising, and a cold market can continue falling. The indicator should be combined with the trader's own strategy and risk management rules.
Main Settings
- Heat Length: Lookback period used to calculate the price range
- Confirmation Bars: Time required to confirm an extreme
- Heat Colors: Custom colors for the temperature gradient
- Visual Options: Control the candles, levels, labels and meter
Market Temperature Map does not execute or manage trades. It is a visual tool developed to support manual market analysis.