MaMI Structure Engine v6
- Indicatori
-
Mcblastus Gicharu Ndiba
 MaMI Trading Ecosystem
A comprehensive market intelligence and trading technology framework specializing in institutional market structure, liquidity analysis, probability-based decision systems, Expert Advisor development, and automated trading solutions for MetaTrader 5. - Versione: 6.0
- Attivazioni: 5
Stop guessing whether the market is trending, reversing, or simply ranging.
MaMI Structure Engine v6.0 helps traders instantly identify high-quality market structure and avoid low-probability setups before risking capital.
MaMI Structure Engine v6.0 is a professional MetaTrader 5 market structure indicator built to help traders quickly understand whether the current market is bullish, bearish, mixed, or not ready for execution.
Instead of forcing you to manually read every swing, BOS, CHoCH, protected high, protected low, premium zone, discount zone, and multi-timeframe structure condition, the engine simplifies everything into one clear decision dashboard.
Its main purpose is simple:
Is the market structure strong enough to trade, or should you wait?
MaMI Structure Engine v6.0 helps traders avoid weak, confusing, and low-probability market conditions by showing when structure is aligned, when momentum is shifting, and when the chart still needs confirmation.
Main Benefits
• Instantly understand the current market bias
• Avoid trading unclear or mixed structure
• See whether D1, H4, and H1 are aligned
• Identify bullish and bearish structure breaks
• Detect CHoCH conditions before major shifts
• Know whether protected levels are still valid
• See whether price is in premium, discount, or equilibrium
• Filter trades using a 0–100 structure strength score
• Get a final dashboard decision before execution
What the Indicator Shows
The dashboard displays:
• Market Bias
• Market State
• D1 / H4 / H1 Alignment
• Structure Sequence
• BOS / CHoCH Events
• Protected High / Protected Low
• Premium / Discount Zone
• Liquidity State
• Last Sweep Context
• Strength Score
• Structure Grade
• Final Decision
Why This Matters
Many traders enter too early because price looks bullish or bearish on one timeframe.
MaMI Structure Engine v6.0 helps solve that problem by reading the full structural context first.
It shows whether the chart is truly trending, reversing, ranging, or waiting for confirmation, so traders can avoid forcing trades in poor conditions.
Core Features
• HH / HL / LH / LL structure labels
• Bullish and bearish BOS detection
• Bullish and bearish CHoCH detection
• Protected High and Protected Low logic
• Premium, Discount, and Equilibrium zones
• Previous Day High / Low levels
• Previous Week High / Low levels
• Liquidity sweep detection
• D1 / H4 / H1 multi-timeframe alignment
• 0–100 structure strength score
• A+ to D grading system
• Clear final decision dashboard
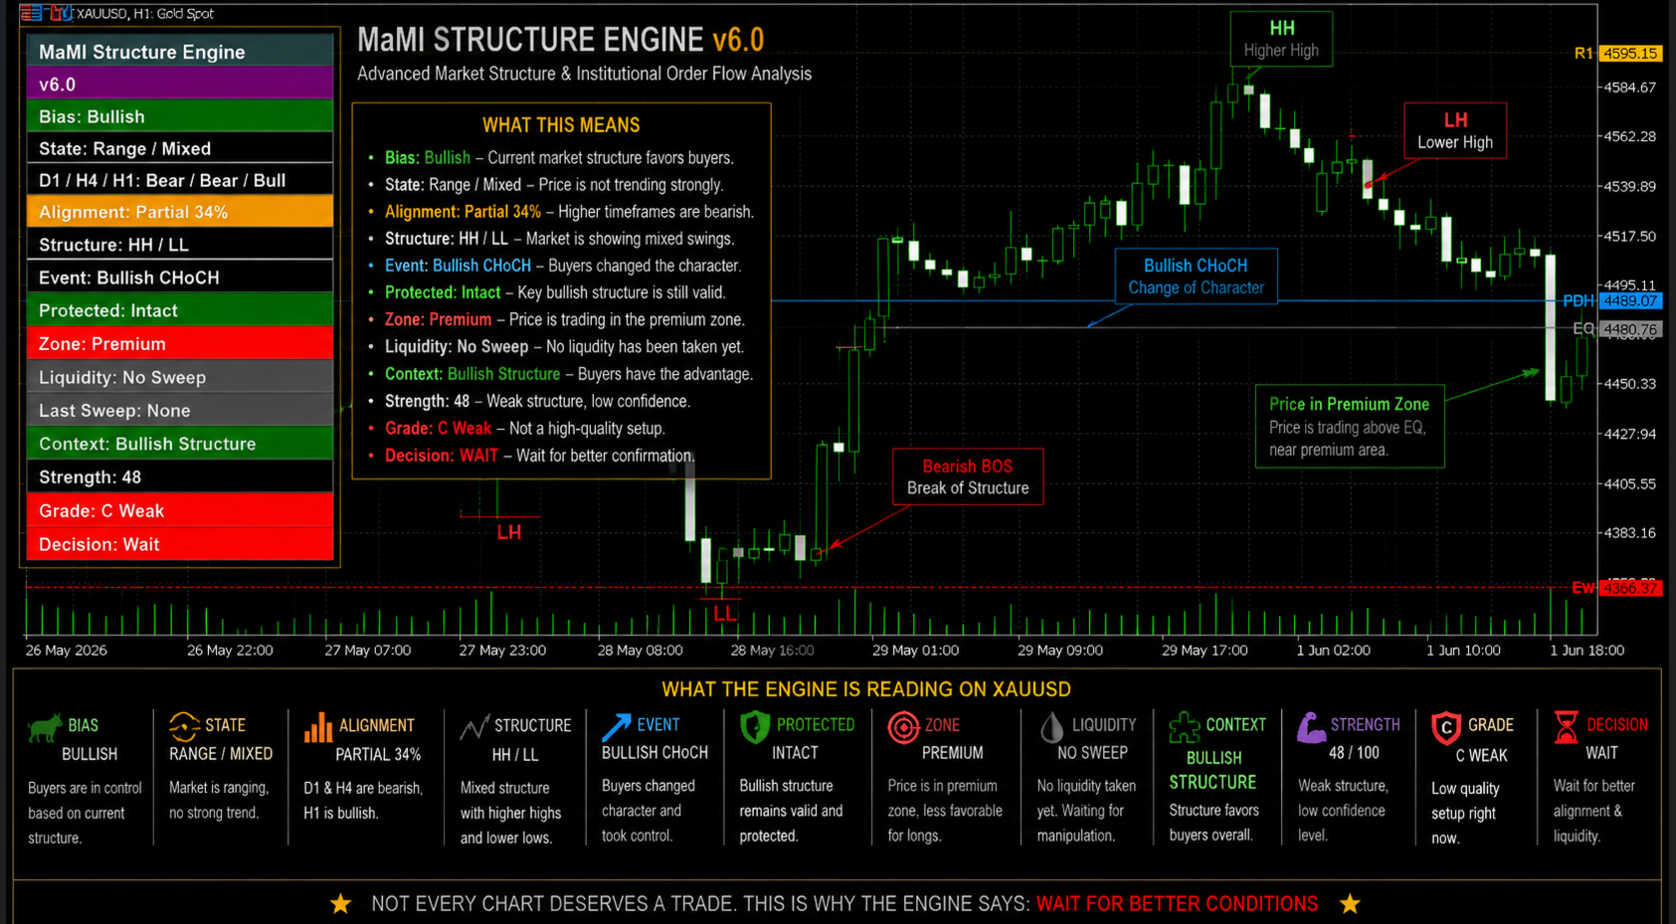
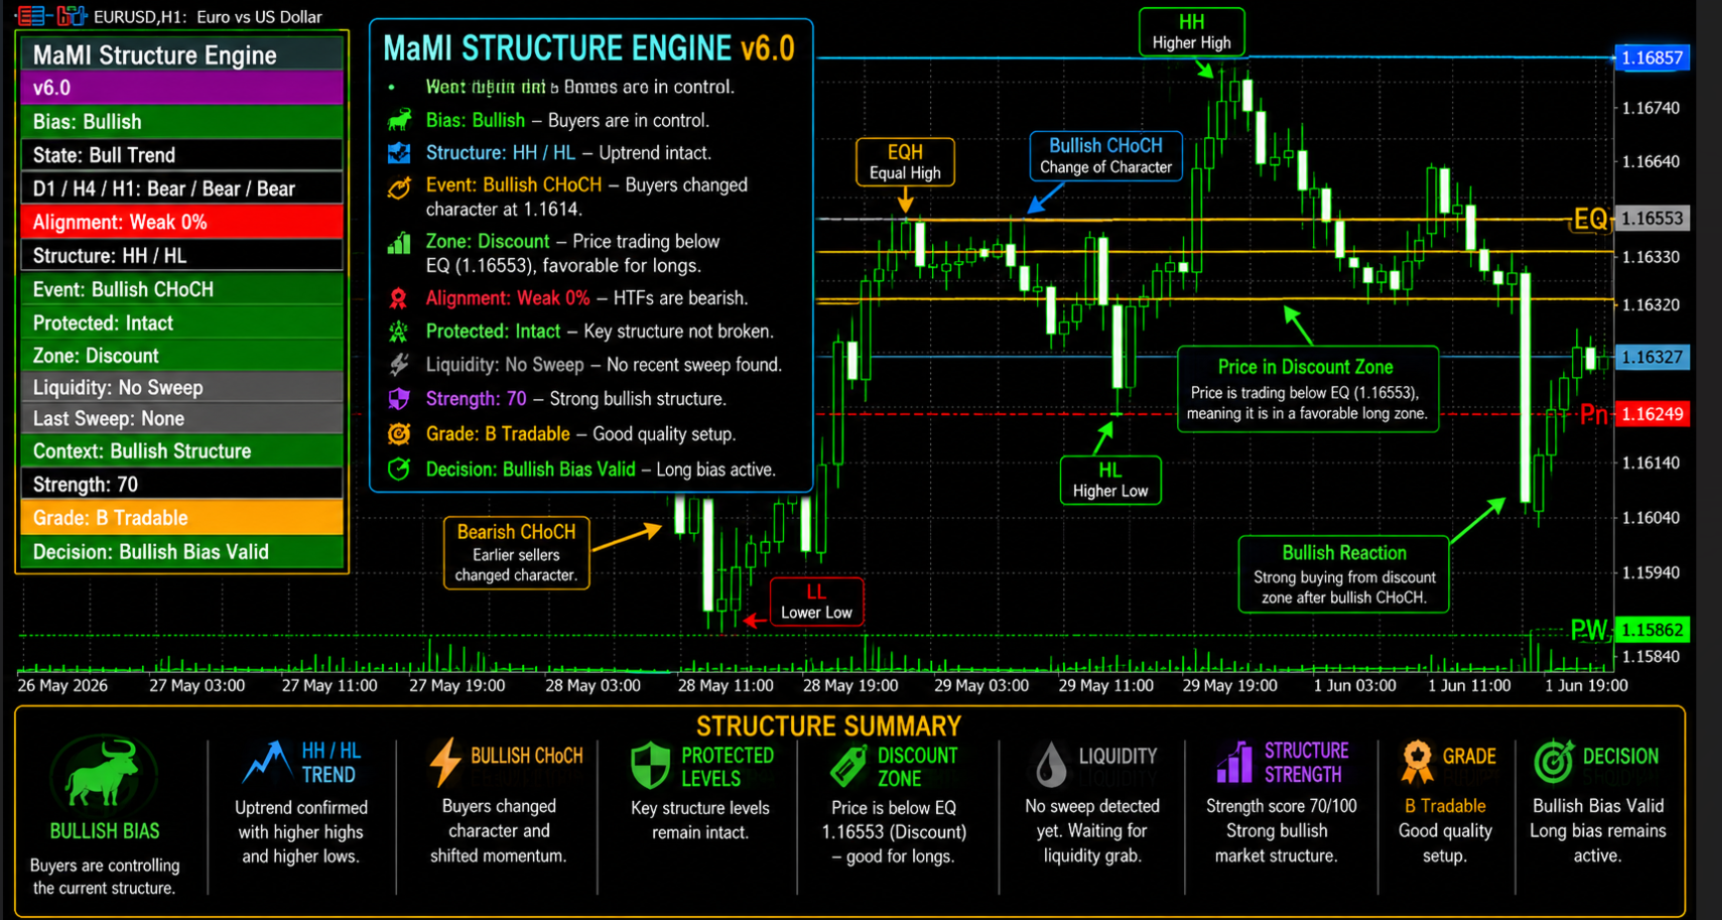
Dashboard Meaning
Bias shows whether the current structure is bullish, bearish, or neutral.
State shows whether price is trending, transitioning, ranging, or mixed.
D1 / H4 / H1 alignment shows whether higher timeframes agree with the current market direction.
Structure shows the latest swing sequence, such as HH / HL or LH / LL.
Event shows the latest structural shift, including bullish BOS, bearish BOS, bullish CHoCH, or bearish CHoCH.
Protected levels show whether the active bullish or bearish structure remains valid.
Zone shows whether price is trading in premium, discount, or equilibrium.
Liquidity shows whether a liquidity sweep has been detected.
Strength gives the current structure quality score from 0 to 100.
Grade rates the structure quality from weak to institutional-level.
Decision tells the trader whether structure is valid or whether waiting is safer.
Grade System
90–100 = A+ Institutional
75–89 = A Strong
60–74 = B Tradable
40–59 = C Weak
0–39 = D Avoid
Best Timeframes
• M30
• H1
• H4
• D1
Best Markets
• Forex
• Gold / XAUUSD
• Indices
• NAS100
• US30
Best Workflow
-
Open your chart.
-
Apply MaMI Structure Engine v6.0.
-
Check the dashboard bias.
-
Confirm D1 / H4 / H1 alignment.
-
Look for BOS or CHoCH confirmation.
-
Check whether protected levels are still valid.
-
Confirm premium or discount zone.
-
Use the strength score and final decision before execution.
Screenshot Captions
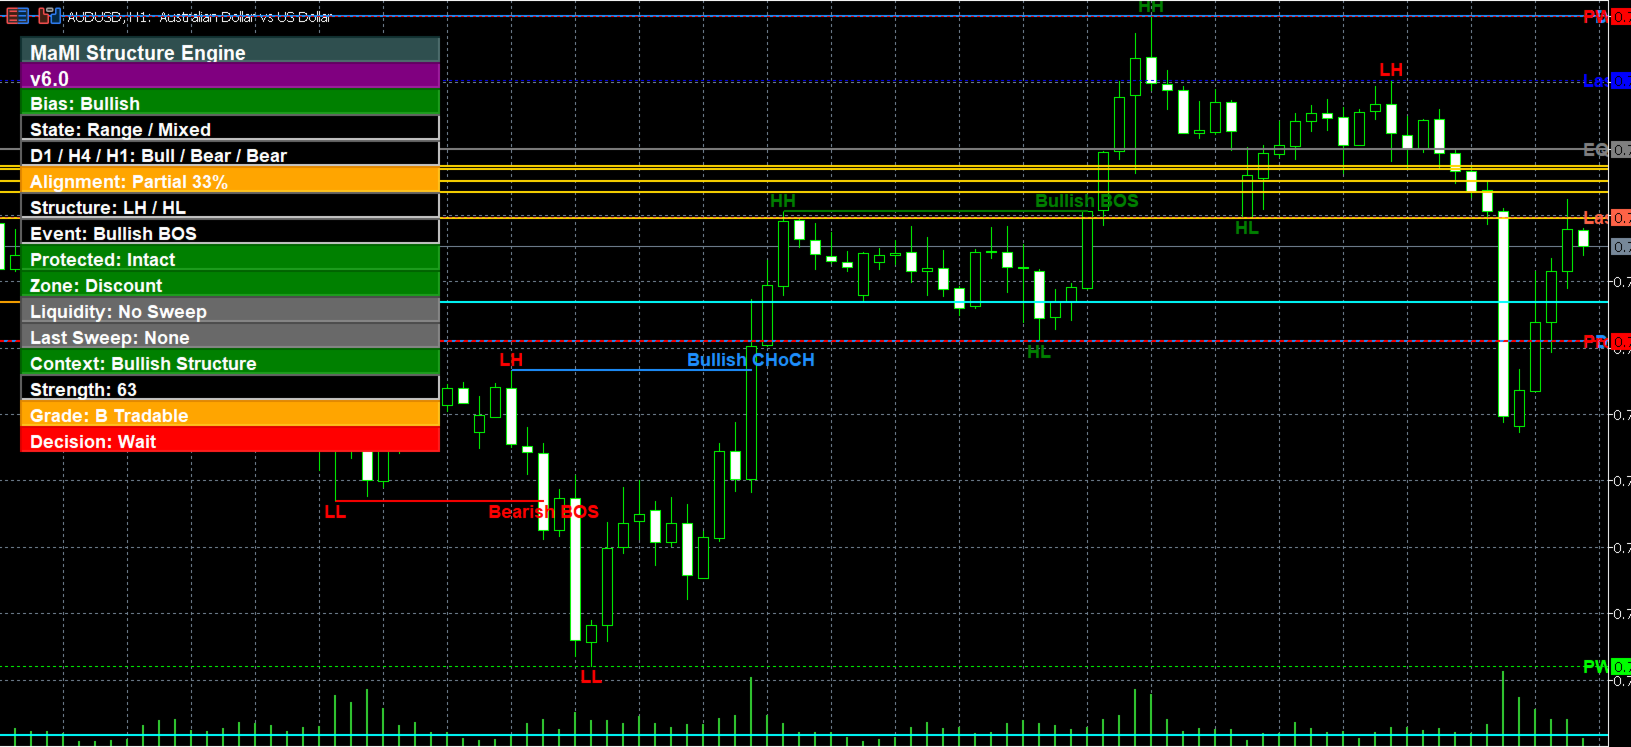
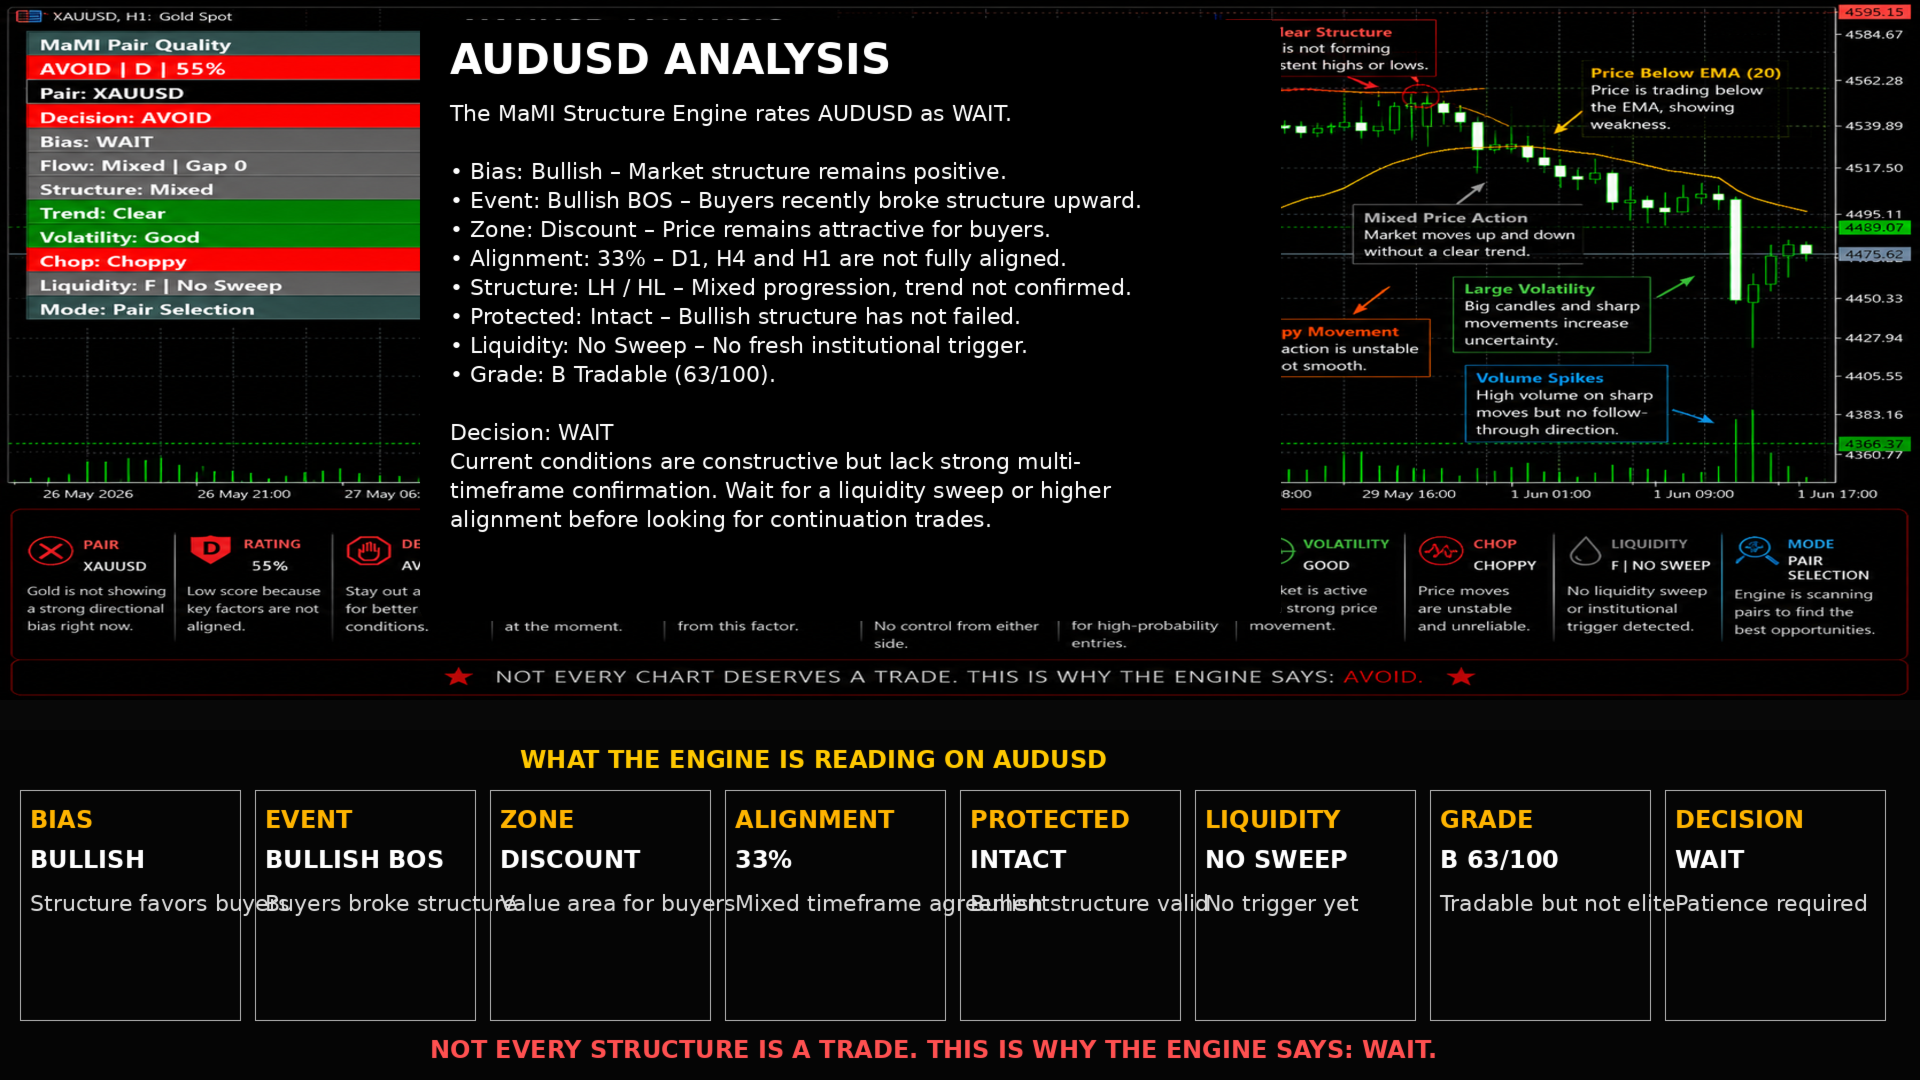
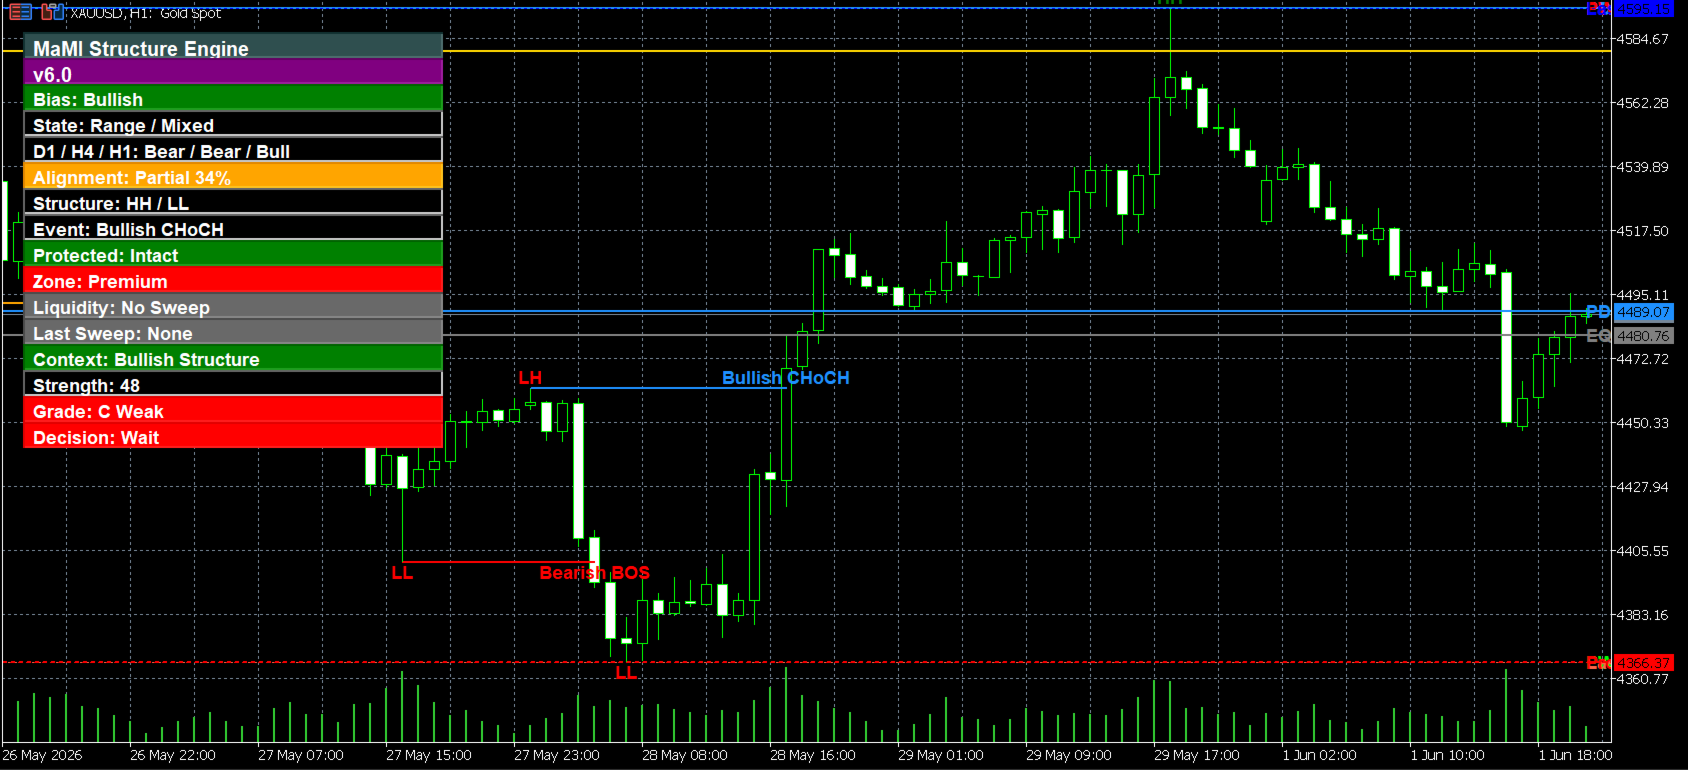
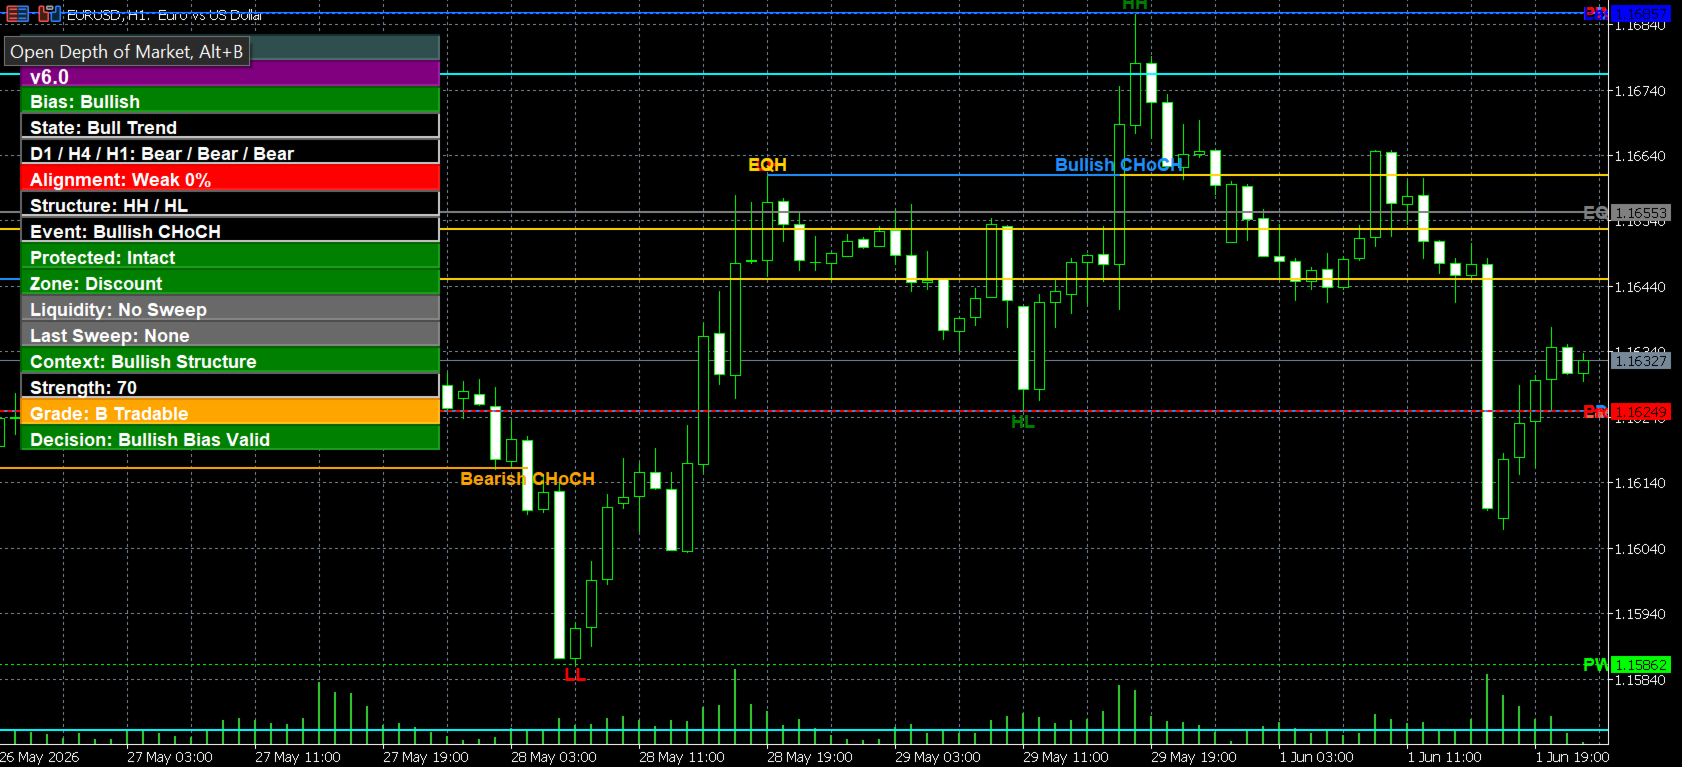
Screenshot 1: Full Structure Dashboard
Shows the full decision panel with bias, state, alignment, protected levels, zone, strength score, grade, and final decision.
Screenshot 2: BOS and CHoCH Detection
Shows structural breaks and character changes directly on the chart.
Screenshot 3: HH / HL / LH / LL Labels
Automatically marks market structure so traders can see whether price is trending or transitioning.
Screenshot 4: Multi-Timeframe Alignment
Shows whether D1, H4, and H1 structure agree before the trader commits to a direction.
Screenshot 5: Premium and Discount Zones
Helps traders understand whether price is in a more favorable buying, selling, or neutral zone.
Screenshot 6: Protected Levels
Shows the key structural levels that must hold for the current bias to remain valid.
Screenshot 7: Liquidity and Sweep Context
Identifies sweep conditions and shows whether liquidity supports or conflicts with the structure.
Screenshot 8: Wait Decision Example
Shows how the engine helps traders avoid unclear setups even when price is moving.
MaMI Structure Engine v6.0 is not just a structure-labeling tool.
It is a market condition filter designed to help traders wait for better structure, avoid weak setups, and make decisions with more clarity.