CasperIT MTF TrendMatrix PRO
- Indicatori
-
Imad Saadeh
 🔹 Professional gold & crypto trader (GMT+2)
🔹 Developer of robust MT5 Expert Advisors & dashboards
🔹 Focused on risk management, equity protection & automation
🔹 Global community leader, sharing transparent trading solutions - Versione: 2.30
- Attivazioni: 10
CasperIT MTF TrendMatrix PRO Short Description Multi-timeframe trend matrix indicator with closed-bar chart signals, confidence filtering, continuation cooldowns and a historical signal report.
Full Description
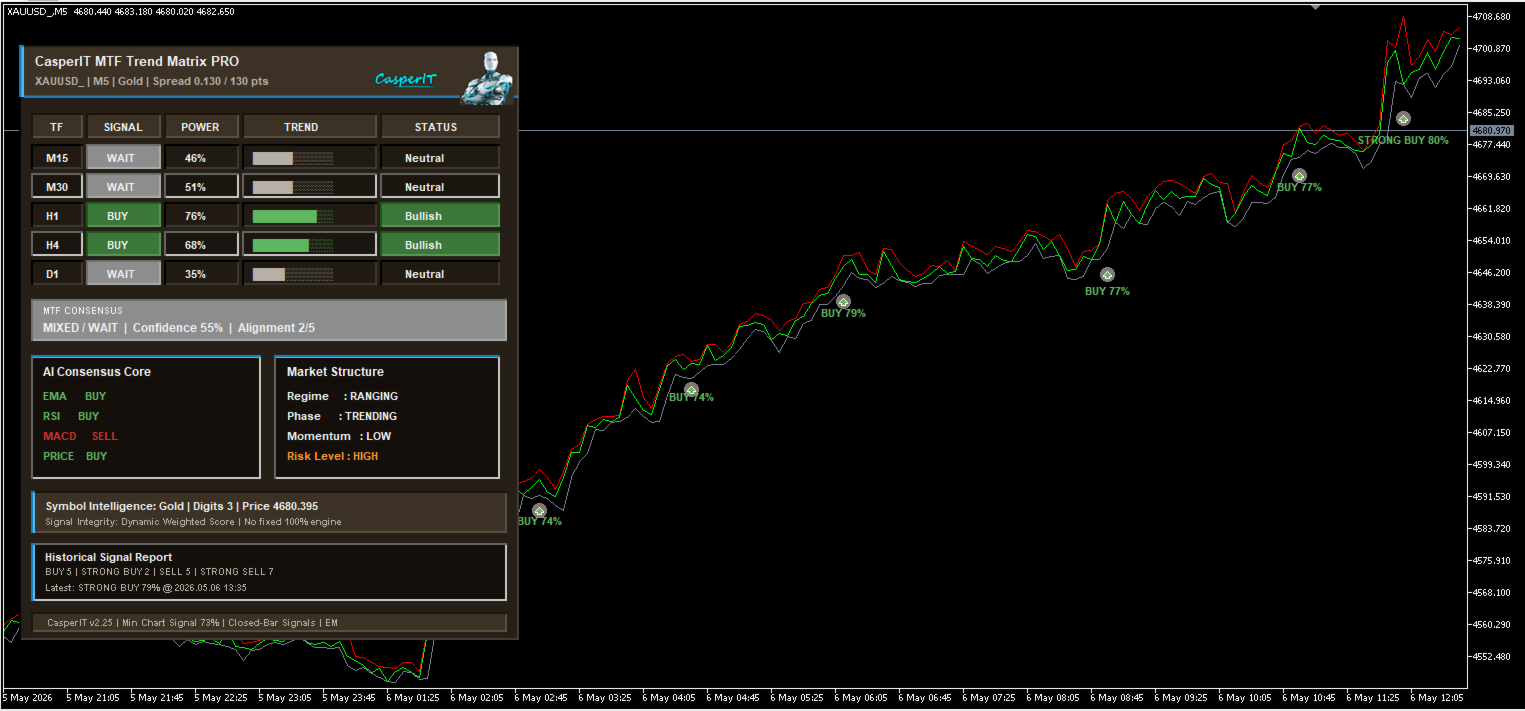
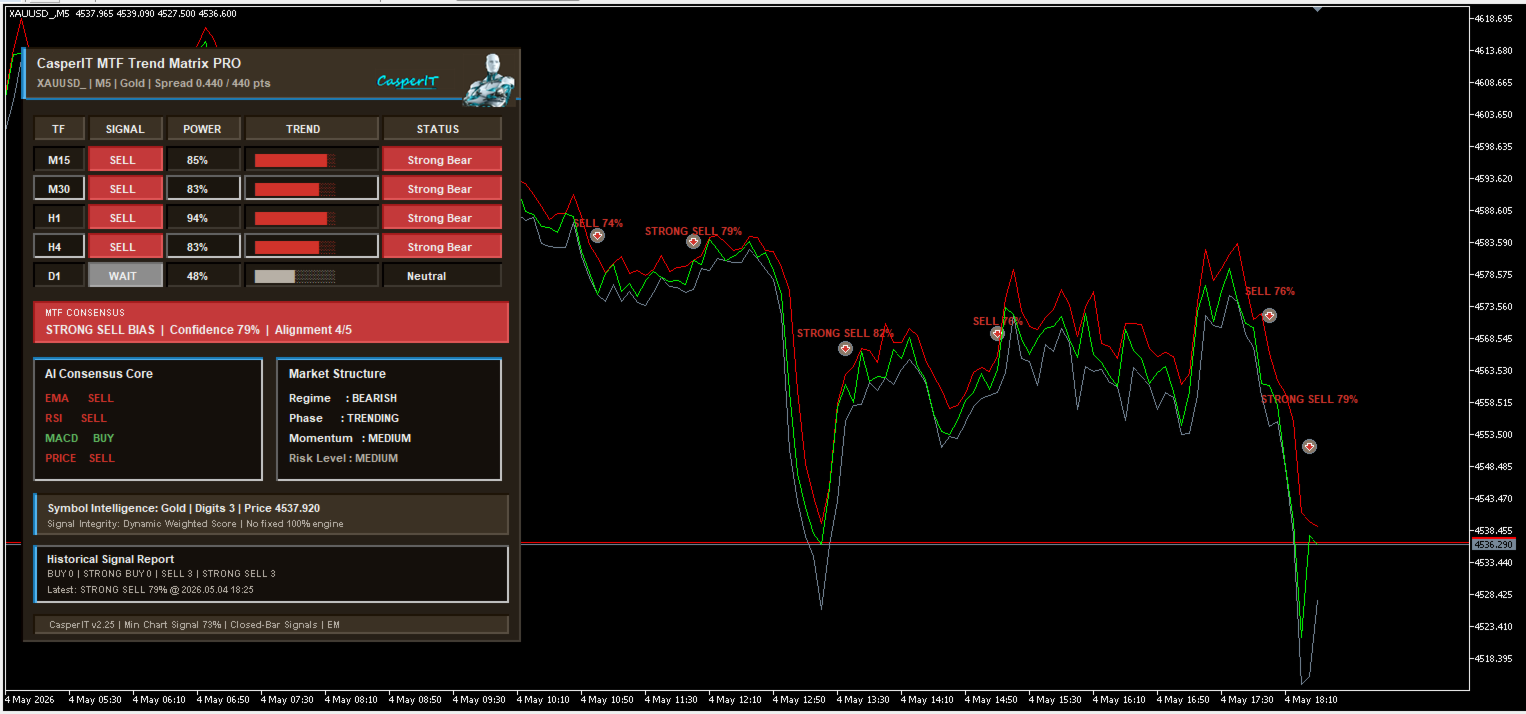
CasperIT MTF Trend Matrix PRO is a chart-window indicator for MetaTrader 5. It summarizes trend conditions across multiple timeframes and displays the result in a compact panel. The indicator evaluates EMA alignment, RSI behavior, MACD momentum, price structure, ADX trend phase and ATR market activity. It combines these readings into timeframe-level signal scores and an overall multi-timeframe consensus. Chart signals use closed candles. This reduces changes caused by the currently forming candle. Submitted BUY and SELL labels are placed below or above the relevant candle and remain visible for later review. The default chart-signal confidence threshold is 73 percent. Lower-confidence market context can remain visible in the panel without creating chart markers. The continuation cooldown reduces repeated labels during extended trends.Main Features
Multi-timeframe dashboard for M15, M30, H1, H4 and D1. BUY, SELL and WAIT status for each enabled timeframe. Overall multi-timeframe consensus with confidence and alignment values. Closed-bar BUY, SELL, STRONG BUY and STRONG SELL chart labels. Minimum chart-signal confidence filter. Configurable continuation cooldown for repeated trend signals. Configurable candle-relative signal-label offset. Historical signal report with totals and latest submitted signal. Compact panel mode. Strategy Tester visual-mode support. Automatic symbol display for Forex, metals, indices and common crypto symbols.Signal Interpretation
The panel can display BUY BIAS, SELL BIAS or MIXED / WAIT. Chart labels are submitted only when the multi-timeframe bias is confirmed and the configured minimum confidence level is met. By default, the minimum chart-signal confidence is 73 percent. STRONG BUY and STRONG SELL labels indicate that the stronger consensus threshold has been met.Important Inputs
InpShowM15, InpShowM30, InpShowH1, InpShowH4, InpShowD1: enable or disable dashboard timeframes. InpShowChartSignals: show or hide submitted chart labels. InpEnableSignalAlerts: enable or disable signal alerts. InpMaxChartSignals: limit retained historical chart markers. InpReentryCandles: set the continuation cooldown between repeated trend signals. InpStrongUpgradeCandles: set the minimum delay before a normal signal can upgrade to a strong signal. InpMinChartSignalConfidence: define the minimum confidence required for chart labels. InpSignalOffsetFactor: adjust chart-label distance from candle wicks. InpCompactMode: display the compact dashboard layout.Usage Notes
Attach the indicator to a chart and enable the preferred timeframes. The indicator is intended as an analytical tool. It does not open, modify or close trades. The indicator does not guarantee trading results. Evaluate its signals according to your own trading plan and risk management rules.