MarketTrend AI40

La paura più grande nel trading non è la perdita, ma piuttosto la "direzione incerta".

Perché molti trader vengono fermati dallo stop-loss? Perché osservano un solo timeframe. Questo indicatore utilizza la tecnologia di riduzione del rumore basata sull'intelligenza artificiale per combinare la robustezza del timeframe H1 con la sensibilità del timeframe M15, creando un filtro di trend automatico.

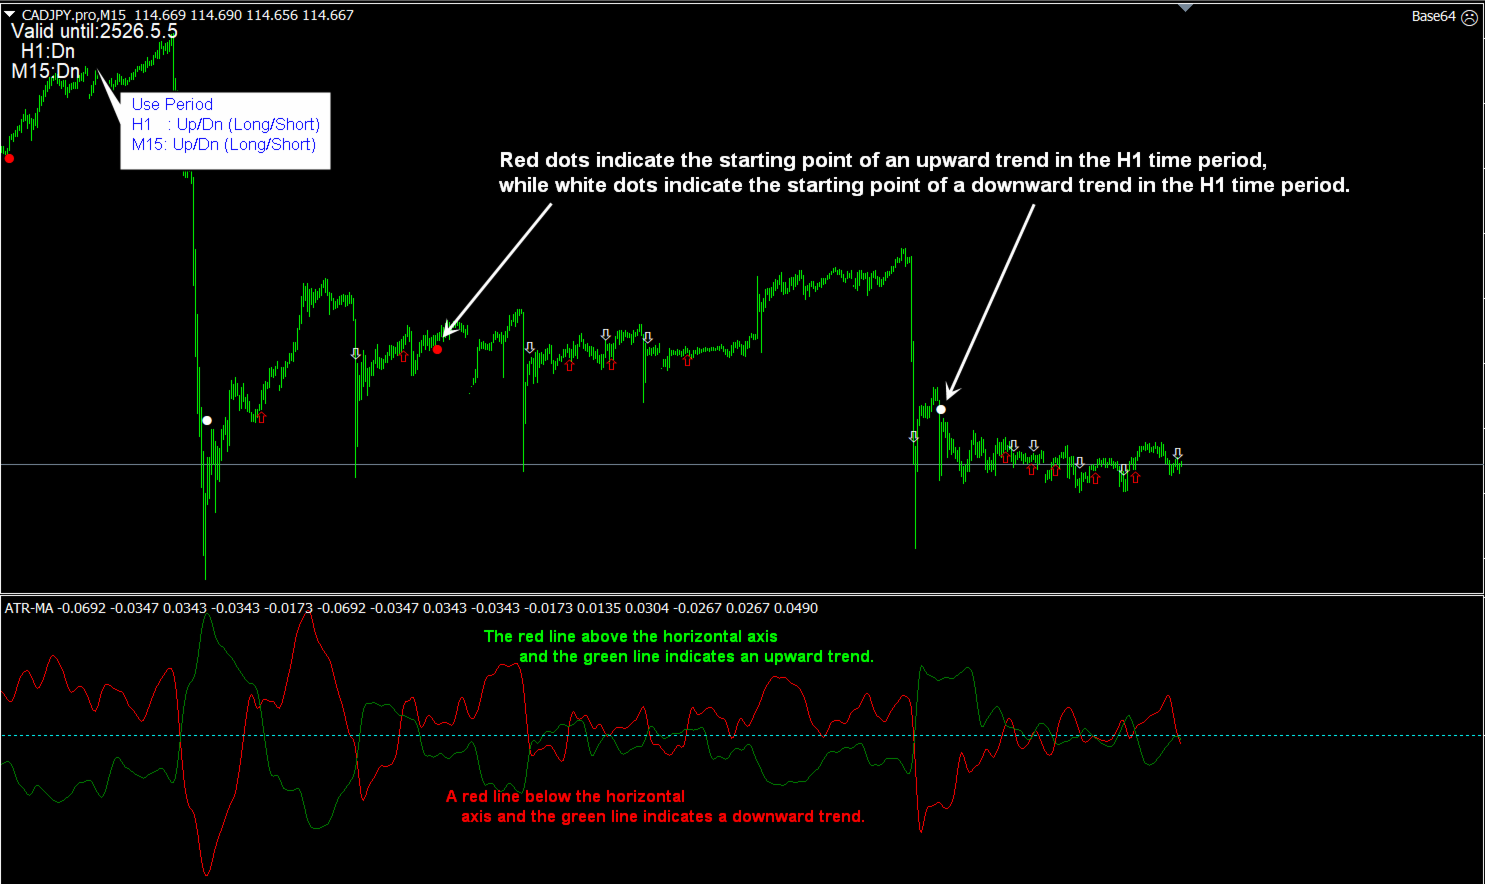
"Lascia che siano i dati a parlare, lascia che l'IA ti guidi e tu dovrai solo raccogliere i frutti." Questo indicatore visualizza la direzione del trend di due timeframe sul grafico della materia prima: H1 (punti) e M15 (frecce). I risultati del calcolo per altri timeframe sono visualizzati nella curva sottostante. Per la direzione del mercato, la volatilità, la forza, il volume di scambio, ecc., si prega di fare riferimento a indicatori come Stocastico, MACD e RSI. Questo indicatore è in grado di determinare con precisione la direzione dei movimenti ondulatori e i punti di ingresso e uscita appropriati.


Si prega di fornire i dati completi del proprio account per richiedere la chiave: sellcoco0907@gmail.com

Caratteristiche dell'indicatore:

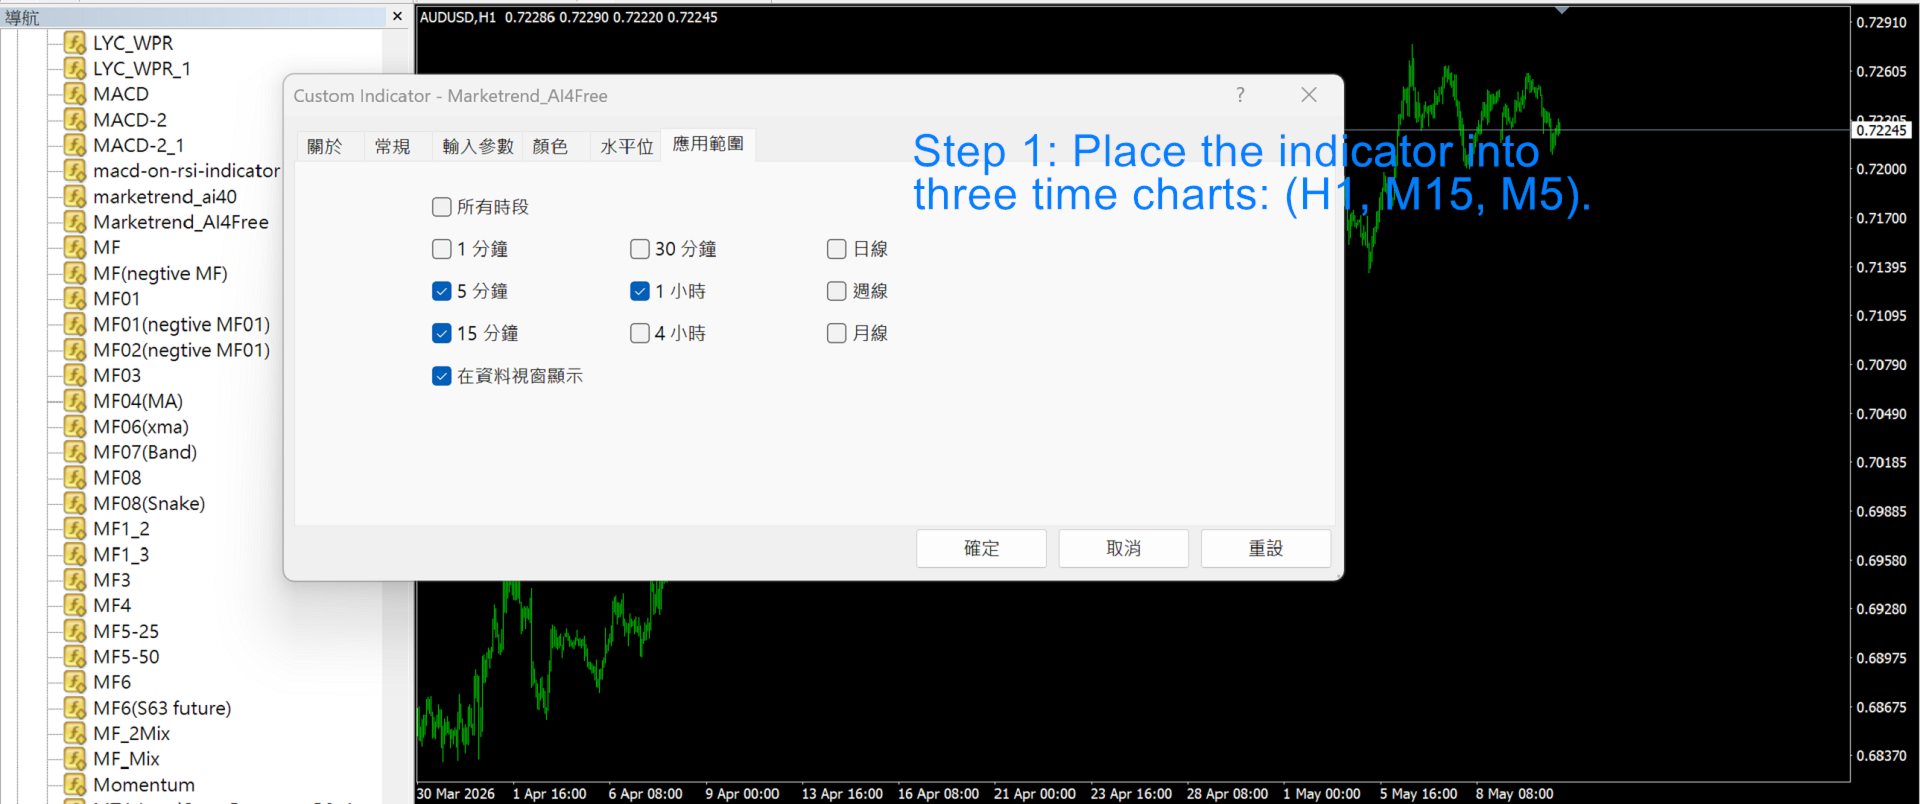
1. Calcolo dinamico multi-timeframe (MTF) con intelligenza artificiale

Questo indicatore è dotato di un algoritmo di filtraggio del trend basato sull'IA che sincronizza automaticamente H1 (monitoraggio del trend a lungo termine) e M15 (navigazione precisa dei punti di ingresso). L'IA filtra automaticamente le piccole fluttuazioni all'interno di un trend noto che non offrono potenziale di profitto, assicurandoti di essere sempre dalla parte giusta del trend principale e riducendo la pressione psicologica durante la fase di consolidamento.

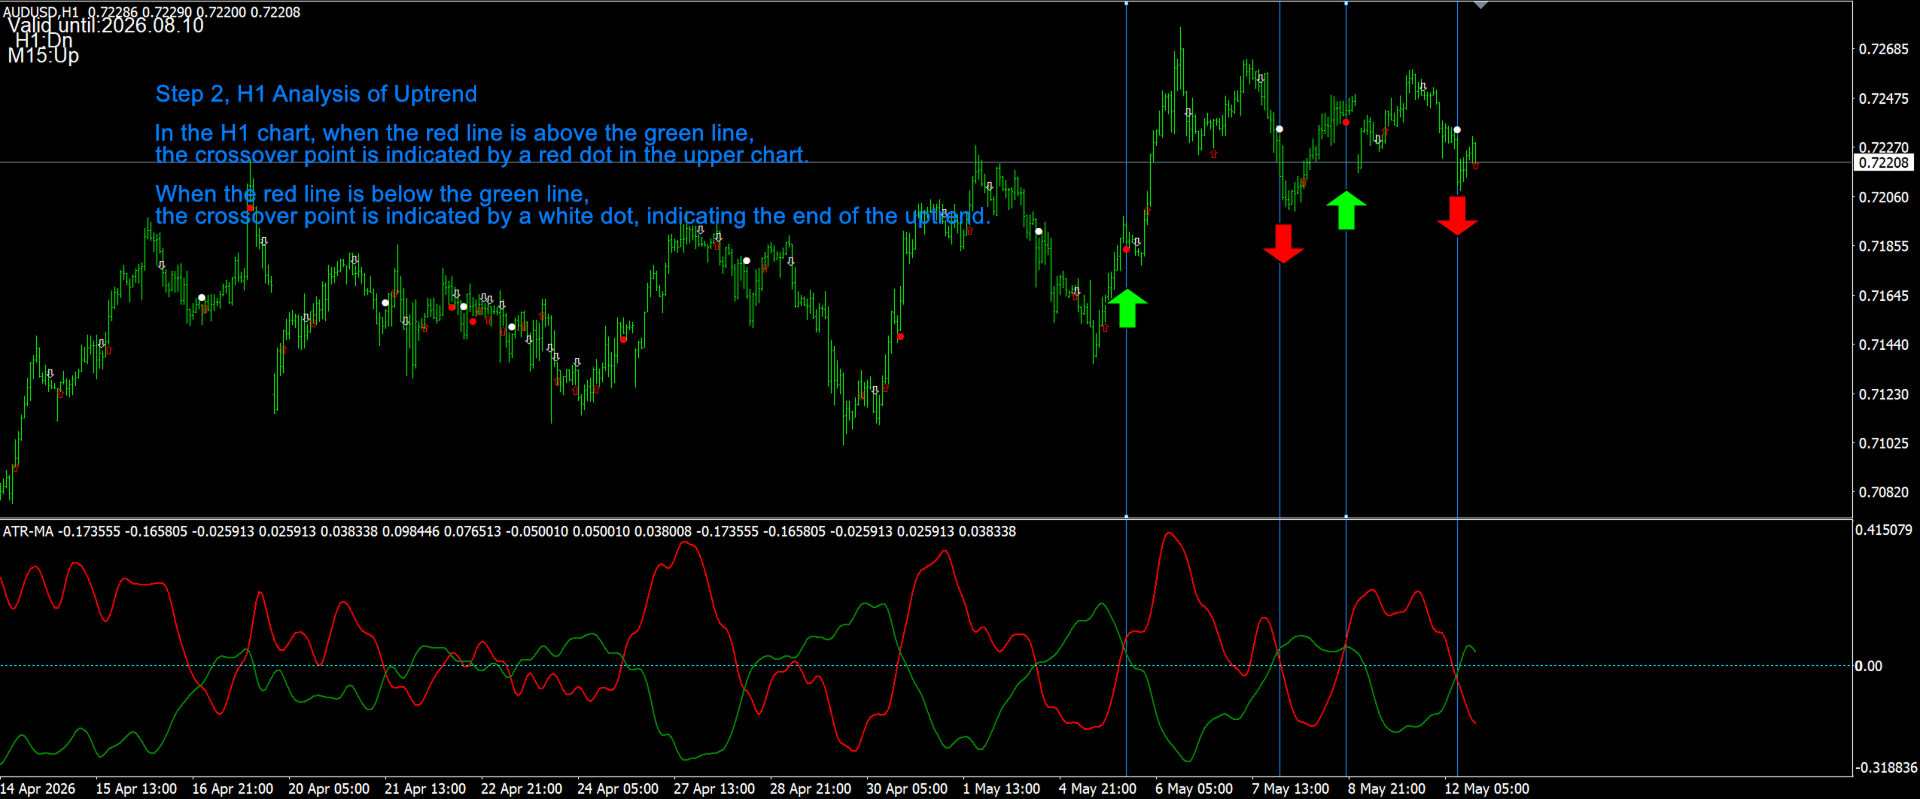
Punto H1: Il tuo radar di navigazione, che si aggancia alla direzione del trend principale.

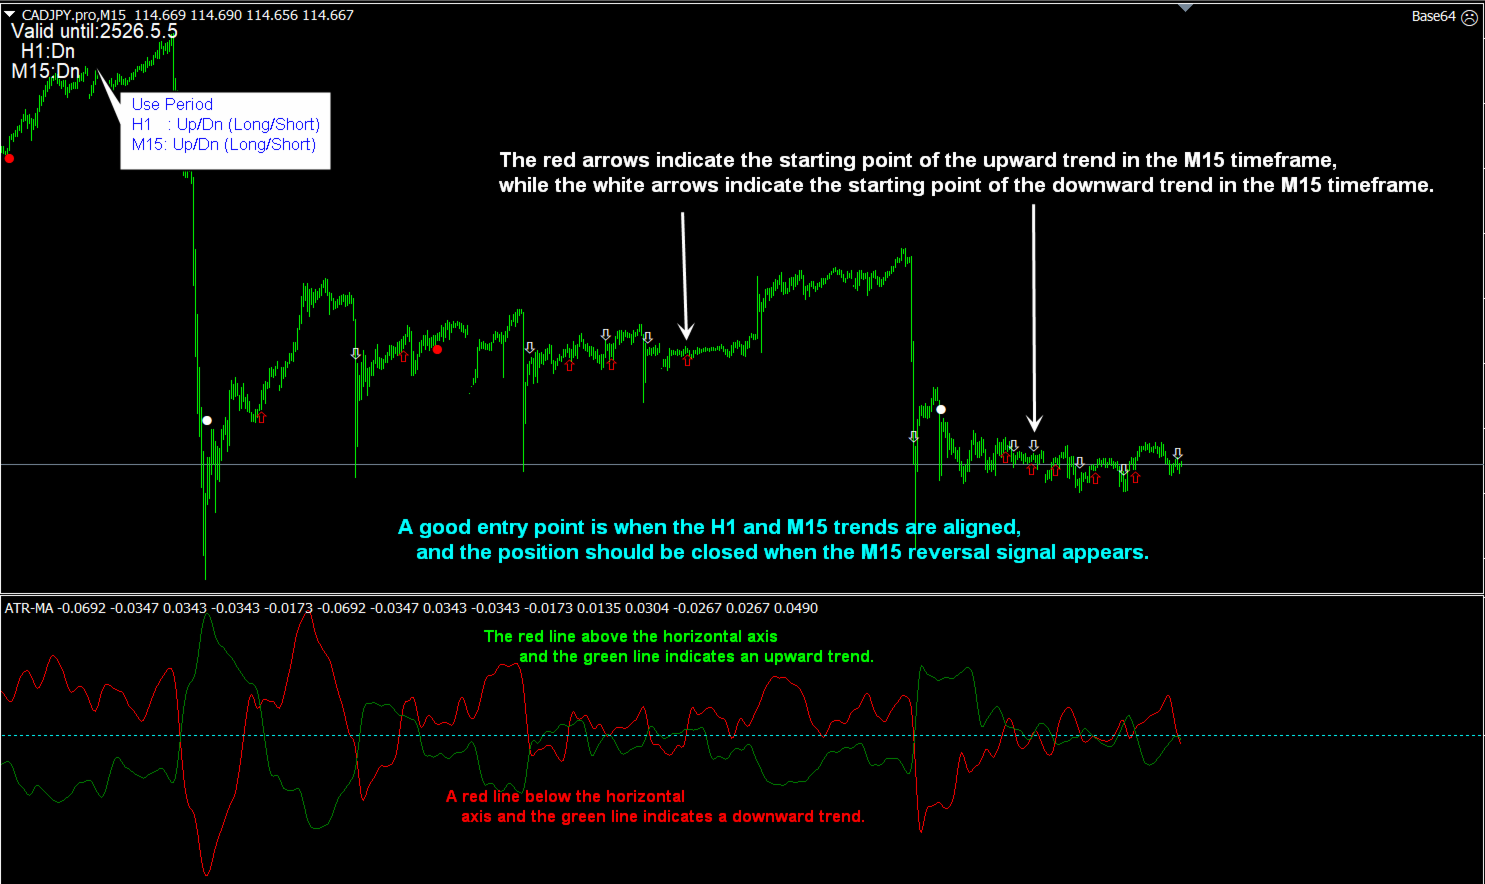
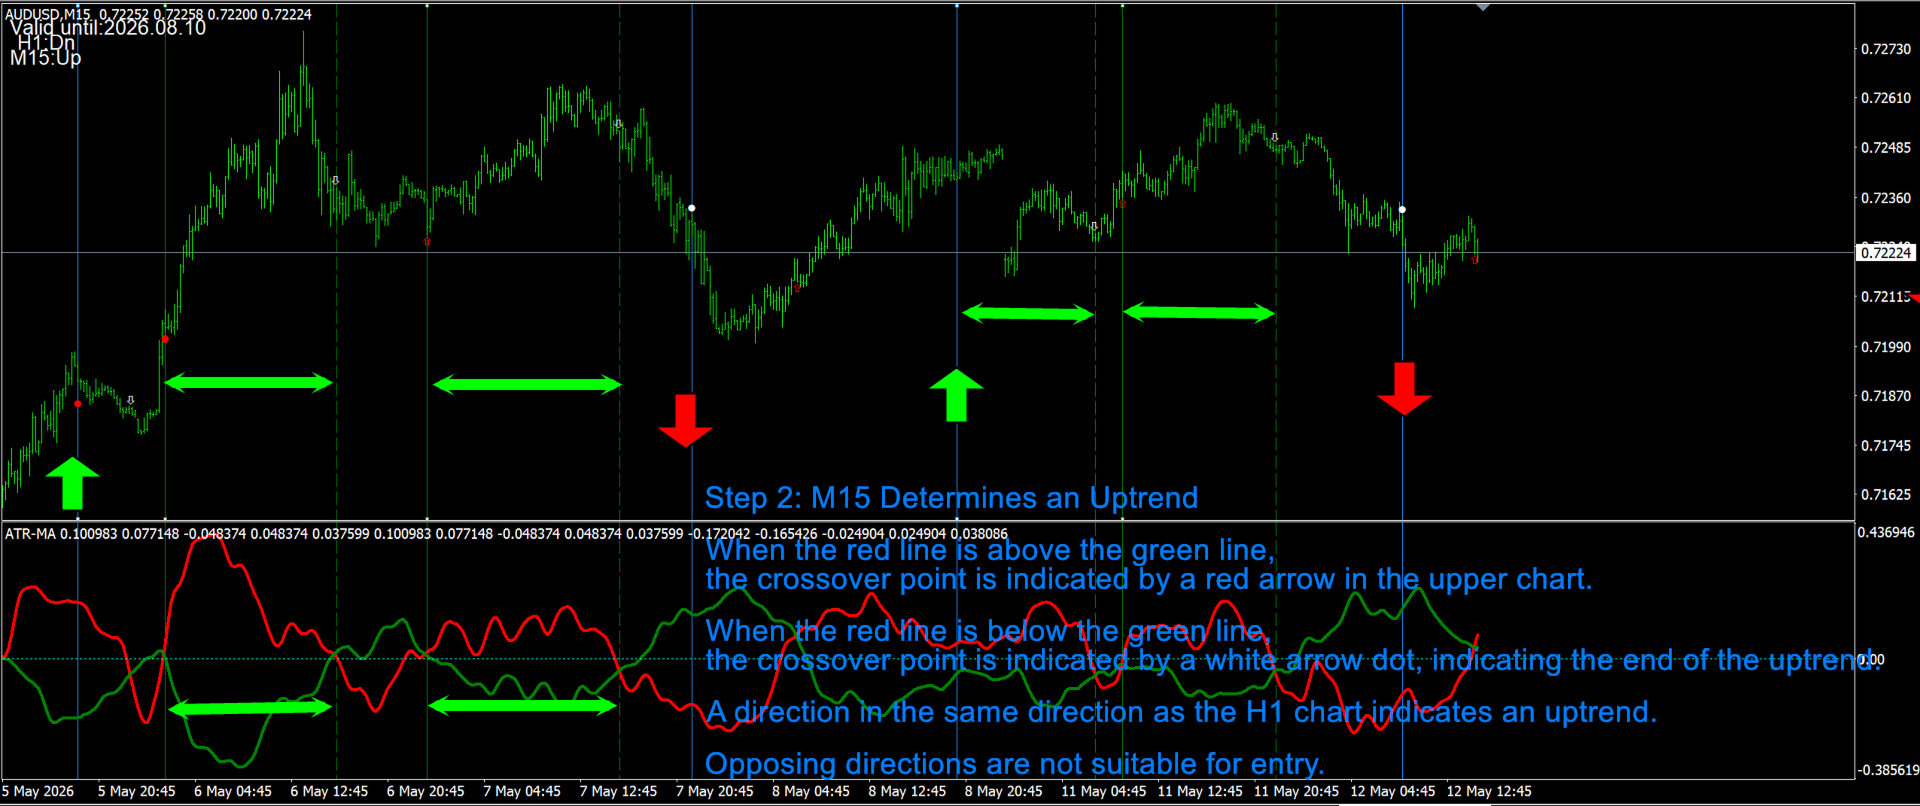
Freccia M15: Il tuo pulsante di attivazione, che cattura con precisione il momento dell'entrata.

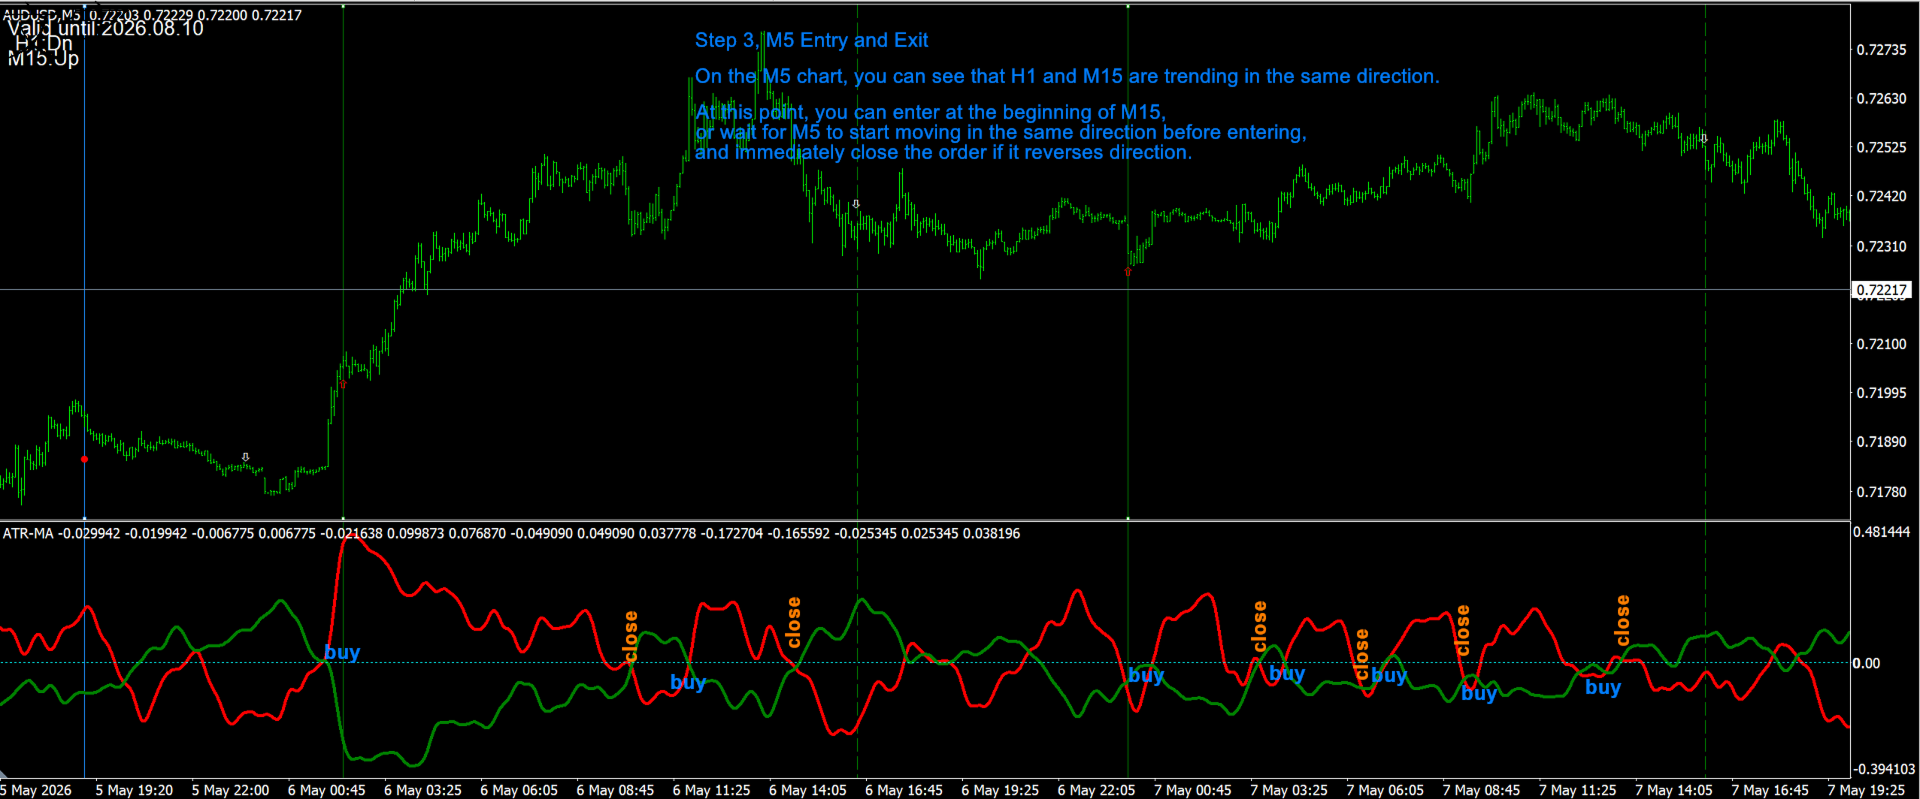
2. Grafico a doppio periodo, identificazione istantanea della direzione e dei punti di ingresso/uscita

A differenza degli indicatori a logica singola presenti sul mercato, questo strumento visualizza simultaneamente la direzione combinata dei timeframe H1 e M15. È in grado di rilevare tempestivamente i segnali di esaurimento del trend, consentendoti di "uscire elegantemente" prima che il mercato inverta la tendenza. Quando il punto e la freccia si allineano, si crea una "zona di risonanza" ad alta probabilità di trading.

3. Compatibilità perfetta: creare la combinazione di trading più efficace

Questo indicatore è progettato specificamente per gli swing trader ed è altamente complementare agli indicatori classici (Stocastico, MACD, RSI). Determina la direzione del movimento, mentre gli indicatori tradizionali ne determinano la forza, formando un sistema di trading impeccabile.
Prodotti consigliati
Introduction This indicator detects volume spread patterns for buy and sell opportunity. The patterns include demand and supply patterns. You might use each pattern for trading. However, these patterns are best used to detect the demand zone (=accumulation area) and supply zone (=distribution area). Demand pattern indicates generally potential buying opportunity. Supply pattern indicates generally potential selling opportunity. These are the underlying patterns rather than direct price action. T
The Trend Professor is a moving average based indicator designed for the purpose of helping the community of traders to analyse the price trend. The indicator will be displayed in the main chart as it is indicated on the screenshot section. How it works The indicator has lines of moving averages and colored histograms to depict the direction of the trend. There will be a fast signal line colored blue/yellow/red at some points. The red/yellow colored lines stands for bearish trend/signal while th
Introduction to Fractal Pattern Scanner Fractal Indicator refers to the technical indicator that makes use of the fractal geometry found in the financial market. Fractal Pattern Scanner is the advanced Fractal Indicator that brings the latest trading technology after the extensive research and development work in the fractal geometry in the financial market. The most important feature in Fractal Pattern Scanner is the ability to measure the turning point probability as well as the trend probabi
Un indicatore tecnico che struttura i grafici e identifica i movimenti ciclici dei prezzi. Può funzionare su qualsiasi grafico. Diversi tipi di notifiche. Ci sono altre frecce sul grafico stesso. Senza ridisegnare la storia, lavora sulla chiusura della candela. TF consigliati da M5 in su. Parametri facili da usare e configurare. Se si utilizzano 2 indicatori con parametri diversi, è possibile utilizzarli senza altri indicatori. Ha 2 parametri di input Ciclicità e durata del segnale Questi 2 pa
HorizonFX
Gabriel Gomes
5 (1)
HorizonFX — Market Oscillator for Technical Analysis Support HorizonFX is a market oscillator developed to support technical analysis in Forex and other CFD markets. It is designed to help visualize price momentum behavior and volatility context through an oscillator panel and clear visual references on the chart. Core Features Oscillator with Momentum Representation HorizonFX calculates an internal oscillator line and histogram to represent momentum behavior relative to recent market movement
Visible Range High Low MT4 (Non-Repainting) Overview The Visible Range High Low indicator is designed to help traders instantly identify the most critical price levels on their chart. It dynamically scans a user-defined number of bars to detect the visible range's absolute high and low, marking these pivot points directly on the chart. Key Features: Non-Repainting Logic: Once a high or low is identified and plotted, it remains fixed, allowing for reliable back-testing and historical analysis. C
Bank Executive Indicator Uses A Simple method of tracking price as it moves across the chart and signals when a potential long or short position is active and indicates this to the trader giving you the opportunity to take a position on the market. Or you can simply use this indicator to give yourself signals and determine if you want to take the trade or learn the strategy on your own.
Moving Pivot Average    The pivot indicator compares the selected period with its counterpart from the previous period. The indicator uses very flexible algorithm for pivot value calculating. It allows you to allocate in days a certain time intervals (custom bars) and calculate the average pivot value based on High, Low and Close prices of these bars. How many custom bars will be taken into account is determined by the "Days" setting. The pivot line can be considered an average trend line and us
SFO Trend Racer
Tevin Marshall
5 (1)
SFO Trend Racer system is a trend indicator created by the CEO and Founder of " Simple Forex Options ", Tevin Marshall . It serves 6 different functions all in one. It shows the trader the entry signals as well as exit signals, whether it is a take profit or a stop loss. It also uses trend filters and signal confirmations so that the trader is able to make the most logically fit decision. Trend Racer uses various filters and specific settings from a plethora of indicators. The beauty in this ind
Questo indicatore funziona con la teoria delle onde di Elliott in due modi: Modalità automatica: In questa modalità, l'indicatore rileverà automaticamente le cinque onde motrici sul grafico in conformità alla teoria delle onde di Elliott. Fornirà previsioni e individuerà potenziali zone di inversione. Inoltre, avrà la capacità di generare avvisi e messaggi push per informare i trader sugli sviluppi importanti. Questa funzionalità automatica semplifica il processo di identificazione e analisi dei
ADR/AWR/AMR Lines Indicator - Professional Range Boundary Display Advanced Multi-Timeframe Range Analysis Tool for Professional Traders Overview The ADR/AWR/AMR Lines Indicator is a sophisticated visual analysis tool that displays dynamic range boundaries across multiple timeframes on your chart. This professional-grade indicator calculates and projects Average Daily Range (ADR), Average Weekly Range (AWR), and Average Monthly Range (AMR) boundaries, providing traders with precise entry/exit l
Floating peaks oscillator - it the manual trading system. It's based on Stochastik/RSI type of oscillator with dynamic/floating  overbought and oversold levels. When main line is green - market is under bullish pressure, when main line is red - market is under bearish pressure. Buy arrow appears at the floating bottom and sell arrow appears at floating top. Indicator allows to reverse signal types. Main indicator's adjustable inputs : mainTrendPeriod; signalTrendPeriod; smoothedTrendPeriod; tre
Trend Sim
Ivan Simonika
This is a professional Trend Sim indicator. The intelligent algorithm of the Trend Sim indicator accurately detects the trend, filters out market noise and generates input signals and exit levels. Functions with advanced statistical calculation rules improve the overall performance of this indicator. The indicator displays signals in a simple and accessible form in the form of arrows (when to buy and when to sell). Knowing the entry point of each of the currencies is very important for every f
This Indicator is use the ZigZag to calculate the Upper and  Lower Bound and the uptrend and the downtrned. Red for downtrend, Green for uptrend and Yellow is for the horizontal trend this horizontal trend also bookmarked the upper limited and the lower limited the the price swings.  Or in simple the Support and the Resistance level. However, You may use the Heikin Ashi to confirm the trend of the buy sell signal above. I cannot guarantee the win rate, Nevertheless, you must study well the timef
Questo indicatore è un indicatore per l'analisi automatica delle onde perfetto per il trading pratico! Caso... Nota:   non sono abituato a usare nomi occidentali per la classificazione delle onde a causa dell'influenza della convenzione di denominazione di Tang Lun (Tang Zhong Shuo Zen), ho chiamato l'onda base come   penna   e la banda dell'onda secondaria come   segmento   At allo stesso tempo, il segmento ha la direzione del trend. La denominazione   è principalmente segmento di trend   (que
BarInOut
Sergey Shevchenko
The indicator shows the possible direction of the price movement up or down, depending on the appearance of the arrow on the chart. It does not redraw and does not disappear when the direction of movement changes. It works absolutely on all timeframes and currency pairs. The indicator is based on candlestick analysis for a certain period of time. An arrow indicating the possible direction of movement appears as soon as a signal has appeared. The larger the arrow on the chart, the stronger the s
Gann Zone Pro
Kirill Borovskii
This indicator identifies and displays zones, as it were areas of strength, where the price will unfold. The indicator can work on any chart, any instrument, at any timeframe. The indicator has two modes. The indicator is equipped with a control panel with buttons for convenience and split into two modes. Manual mode: To work with manual mode, you need to press the NEW button, a segment will appear. This segment is stretched over the movement and the LVL button is pressed. The level is displayed
Nygma Binary Options is a momentum indicator that measures the magnitude of recent price changes to evaluate overbought or oversold conditions in the price of a stock or other asset with few major tweaks. This is NOT RSI. Features V3: Added Supply/Demand Filter: You must add your own S/R indicator .  You get alerts when prices is entering on a specific supply/demand zone. How to use the S/R Filter? Load the Nygma_Mod.ex4 into the chart, after that load your S/R indicator on the chart. In order
ACB Breakout Arrows Scanner MT4
KEENBASE SOFTWARE SOLUTIONS
Questo è uno scanner multi-simbolo e multi-timeframe per il nostro indicatore ACB Breakout Arrows . Con le impostazioni predefinite, analizza i segnali di acquisto/vendita su 28 coppie di valute e 9 timeframe contemporaneamente .  Caratteristiche Può analizzare 252* combinazioni di simboli e timeframe da un singolo grafico. Apre il grafico del segnale con un modello predefinito con un solo clic.  Facile da spostare ovunque sul grafico tramite drag and drop. Avvisi in tempo reale tramite popup,
MA Cross Signal Alerts_v1.0 The Moving Average Cross displays a fast and a slow moving average (MA). A signal arrow is shown when the two MAs cross. An up arrow is displayed if the fast MA crosses above the slow MA and a down arrow is given if the fast MA crosses below the slow MA. The user may change the inputs (close), methods (EMA) and period lengths.  When two Moving Averages cross the indicator will alert once per cross between crosses and mark the cross point with down or up arrow. Ale
Hammer Shooting Star v1.1 – Advanced Candlestick Pattern Scanner Author: LIANG1990 Are you searching for a reliable tool to identify market reversals with precision? Hammer Shooting Star v1.1  is a professional MT4 indicator designed to scan and detect high-quality Hammer and Shooting Star candlestick formations. Unlike basic pattern indicators, this tool applies multiple built-in filters (shape, size, trend alignment, and contextual conditions) to reduce false signals and highlight only the cle
Urgently
Tatiana Savkevych
The Urgently indicator is designed to quickly determine the situation in the market, reflect the state of the market and signal profitable levels for opening trades. Market conditions change quickly enough, requiring constant calibration of trading strategies. Recommended for use in conjunction with any of the oscillators. The Urgently forex market trend indicator shows the trend direction and entry points. It smooths out price fluctuations when generating a signal by averaging the data and the
Kısa ve öz Bu gösterge, iki uzmanı – RSI ve MACD'yi – tek bir sistemde birleştirir . İki ayrı grafiğe bakıp tahmin yürütmek yerine, kararı sizin için verir: Her iki gösterge de aynı fikirde olduğunda bir ok çizer (al veya sat). En önemlisi: Oklar yeniden çizilmez . Bir kere belirdi mi, olduğu yerde kalır. Backtest yapabilir ve canlı işlemlerinize güvenebilirsiniz. "Combo" ne anlama geliyor? Normalde bir trader, RSI'ye (hareketin gücü) ve MACD'ye (trend yönü) ayrı ayrı bakar. Burada ikisi takım
PT Trade
Dmitriy Kashevich
PROFITABLE TRADER is an interesting name for this indicator... And all because it is for a true trader who values ​​his time. It has a built-in Alert and parameters that will make your work easier. Open settings will allow you to set the indicator to any cryptocurrency or just currency. It's better to test and then draw a conclusion .. screenshots will show everything.. good bidding my friend.
Vrc Updated
Vimal Chudasama
This is an indicator that has been updated from the previous VRC indicator, which has both buy and sell arrows now, and it is optimised from the previous one. You can try it out, the version is upgraded and might suit your trading style. You can also use this indicator as a confluence, or you can use it as a main signal provider; it can be used along with your strategy or top-down approach analysis. Past performance does not guarantee future performance; kindly do a top-down analysis and keep yo
The Propfolio Master Suite is the ultimate all-in-one analytical workstation for professional traders. Combining the power of the Beat The Market Maker (BTMM) methodology, Smart Money Concepts (SND/Liquidity), and Advanced Volume Profile, this suite replaces multiple different indicators with one optimized engine. Monitor up to 14 pairs simultaneously from a single chart, instantly identify market cycles, and seamlessly map institutional footprints with the click of a button. The Command Center
Impulse fractals indicator - is counter-trend oriented complex market fractal pattern.  Market creates bull/bear impulse, trend starts, fractals on impulsed wave are an agressive pullback signals. Buy arrow is plotted when market is bearish and it's impulse showed up-side fractal, and sell arrow is plotted when market is bullish and it's impulse showed dn-side fractal. Main indicator's adjustable inputs : impulsePeriod - main period of impulse histogram  filterPeriod  - smoothes impulse accordi
ENTRY AND EXIT ARROWS Indicator – Description The Entry and Exit Arrows indicator is a simple yet effective momentum-based tool designed to highlight potential buy and sell opportunities directly on the chart using visual arrows. It works by comparing two internal momentum measurements with different sensitivities. When both measurements align in the same direction, the indicator confirms a stronger directional bias and plots a signal. How It Works Buy Signal (Lime Arrow Below Candle): Appea
The Omega Trend Oscillator is a trend indicator based on Moving averages and Bollinger bands. I made it simple for you to have easy and soft market analysis approach. The indicator can be used for the following purpose. 1. For trend analysis 2. For determining the overbought and oversold market condition 3. For discovering market selling and buying opportunities.  Meaning of colors on the indicator FOR BULLISH MARKET (Buy) 1. Lime color is for bullish market/trend 2. Blue color is for very st
Fibo RSI Channels
Igor Semyonov
4 (1)
Colored indicator of the linear channels based on the Fibonacci sequence for the RSI. It is used for making trading decisions and analyzing market sentiment. The channel/channels boundaries represent strong support/resistance levels, as they are the Fibonacci proportion levels. Users can select the number of displayed lines of channel boundaries on the chart by means of the input parameters. Various options for using the indicator are shown in the screenshots. The middle of the channel is shown
Gli utenti di questo prodotto hanno anche acquistato
Indicatore Miraculous – Strumento Forex e Binario 100% Non-Repaint Basato sul Quadrato di Nove di Gann Questo video presenta l' Indicatore Miraculous , uno strumento di trading altamente accurato e potente, sviluppato specificamente per i trader di Forex e Opzioni Binarie . Ciò che rende unico questo indicatore è la sua base sul leggendario Quadrato di Nove di Gann e sulla Legge della Vibrazione di Gann , rendendolo uno degli strumenti di previsione più precisi disponibili nel trading moderno. L
Breakout Arrows Mt4
Michael Oko Oboh
5 (1)
Trend Breakout Arrows Indicator The Trend Breakout Arrows Indicator is a momentum-based signal tool designed to identify potential bullish and bearish breakout opportunities. It displays clear arrow signals directly on the price chart, helping traders quickly recognize possible trend changes and continuation setups. Up Arrow (Buy Signal) A magenta up arrow appears below a candle when bullish momentum begins to strengthen. This signal indicates that buying pressure may be overtaking selling press
L'indicatore " Dynamic Scalper System " è progettato per il metodo di scalping, ovvero per il trading all'interno di onde di trend. Testato sulle principali coppie di valute e sull'oro, è compatibile con altri strumenti di trading. Fornisce segnali per l'apertura di posizioni a breve termine lungo il trend, con ulteriore supporto al movimento dei prezzi. Il principio dell'indicatore. Le frecce grandi determinano la direzione del trend. Un algoritmo per generare segnali per lo scalping sotto fo
TRADING STRATEGY GUIDE DELIVERY The full Trading Strategy Guide will be sent directly to you after purchase. Just message me on MQL5 and ask for it — you'll receive it instantly, along with priority support and setup help. Powered Market Scanner for Smart Trading Decisions Keypad Support & Resistance is a next-generation MT4 trading system built for serious traders who demand precision, reliability, and clarity. It combines advanced smart filters with real-time price structure logic to genera
KuKl
IGOR KIRIANEN
The indicator is built on a non-standard Zig Zag, it draws accumulations after which if the price leaves this zone and a test of this zone occurs, then a sound signal is given and an arrow appears - after the test candle closes.The indicator does not redraw its signals, it is very easy to use, there are only three settings 1- this is the zig zag parameter 2- this is the minimum price exit from the zone 3- this is the maximum price exit from the zone. The lower the parameter for Zig Zag, the more
WanaScalper MT4
Isaac Wanasolo
1 (1)
A scalping indicator based on mathematical patterns, which on average gives signals with relatively small SL, and also occasionally helps to catch big moves in the markets (more information in the video) This indicator has three main types of notifications: The first type warns of a possible/upcoming signal on the next bar The second type indicates the presence of a ready signal to enter the market/open a position The third type is for SL and TP levels - you will be notified every time price re
Meravith
Ivan Stefanov
5 (3)
Strumento per market maker. Meravith: Analizzerà tutti i timeframe e mostrerà il trend attualmente in corso. Evidenzierà le zone di liquidità (equilibrio dei volumi) dove i volumi rialzisti e ribassisti sono uguali. Mostrerà tutti i livelli di liquidità dei diversi timeframe direttamente sul grafico. Genererà e presenterà un’analisi di mercato testuale a scopo di riferimento. Calcolerà obiettivi, livelli di supporto e punti di stop-loss in base al trend attuale. Calcolerà il rapporto rischio/ren
CountSig
Yin Zhou Luo
一款信号统计指标(MT4)——实现基于当前图表周期下的单线MA转向和双线MA金叉/死叉统计 . 转向定义:前一K向下或走平,当前K向上,视为转向向上;反之,转向向下。 金死叉定义:前一K快线在慢线下方,当前K快线在慢线上方,为金叉;反之,死叉。 参数及使用说明: 1、可指定统计K线数。 2、可指定4个不同的日内时间段,格式如"03:00-07:59",4个时间段可交叉任意输入。 3、可配置ABC三个浮盈区间段点值。如:分界区间统计小点值设为500,即当某转向信 号出现后到下一反向信号止浮盈<=此点值,计入A区间; 若大于此点值<大分界点值时,计入B区间;若大于“大分界点值”计入C区间。 4、最大/最小浮盈统计。显示所有统计区间内的最大浮盈点值和最小浮盈点值(亏损点值)。 5、输出完整信号,按信号出现顺序排列,如“ACCBCA”之类。 6、综合预测。使用概率、周期、趋势、马尔可夫链等综合概算输出预测该信号出现的归类概率值。 7、加载指定MA线。在当前图表自动载入相应设置的MA线。 8、自适应列宽。以完整显示统计信号数。 9、用法:点击相应统计按钮即输出相应的统计表格.
SYSTEM INTRODUCTION:   The Binary Options Channels System Is Specifically Designed For Binary Options Trading. Unlike Other Systems And Indicators That Were Adopted From Other Trading Environments For Binary Options. Little Wonder Why Many Of Such Systems Fail To Make Money . Many End Up Loosing Money For Their Users.  A Very Important Fact That Must Be Noted Is The Fact That Application Of Martingale Is not Required. Thus Making It Safer For Traders Usage And Profitability. A Trader Can Use Fi
Fxland Price Reversal Zones (MT4) FXLAND Smart Reversal Indicator is a professional technical analysis tool designed to help traders identify potential price reversal zones and key market turning points with clarity and precision. The best reversal indicator and price return by choosing only one ceiling or floor in each time frame A masterpiece of combining mathematics and Gann, fractal matrix, Fibonacci, movement angle and time. Completely intelligent Key Features Detects potential pr
The Hurricane Indicator
Paul Nicholas Clevett
5 (1)
Currently switched to the 4 hour chart - but use other time frames for confirmation. :-)  I change my main time frame based on the market movement at the time. The Hurricane Forex Indicator is a multi time frame indicator that includes such things as Trade Notifications, Trade Calculator, Momentum Indicator, risk reward and much more. We have a free Trade room for our users as well. Please check out the video for full details of how this indicator works as it has over 15 years worth of developme
VTrende Pro mt4
Andrii Diachenko
3 (2)
VTrende Pro MT4 - MTF indicator for trend trading with a display panel for MT5 *** Videos can be translated into any language using subtitles (video language - Russian) Although the signals of the VTrende Pro indicator can be used as signals of a full-fledged trading system, it is recommended to use them in conjunction with the Bill Williams TS. VTrende Pro  MT4 is an extended version of the VTrende indicator. Difference between Pro version and VTrende: - Time zones - Signal V - signal 1-2 wave
FFx Engulfing Setup Alerter gives trade suggestions with Entry, Target 1, Target 2 and StopLoss. Below are the different options available: Entry suggestion - pips to be added over the break for the entry 3 different options to calculate the SL - by pips, by ATR multiplier or at the pattern High/Low 3 different options to calculate the 2 TPs - by pips, by ATR multiplier or at Risk/Reward Offset the dashboard - any place on the chart Remove the suggestion once the price reached the SL line Lines
FFx InsideBar Setup Alerter gives trade suggestions with Entry, Target 1, Target 2 and StopLoss. Below are the different options available: Entry suggestion - pips to be added over the break for the entry Minimum candle size - to avoid too close buy/sell entry suggestions 3 different options to calculate the SL - by pips, by ATR multiplier or at the pattern High/Low 3 different options to calculate the 2 TPs - by pips, by ATR multiplier or at Risk/Reward Offset the dashboard - any place on the c
FFx OutsideBar Setup Alerter gives trade suggestions with Entry, Target 1, Target 2 and StopLoss. Below are the different options available: Entry suggestion - pips to be added over the break for the entry. 3 different options to calculate the SL - by pips, by ATR multiplier or at the pattern High/Low. 3 different options to calculate the 2 TPs - by pips, by ATR multiplier or at Risk/Reward. Offset the dashboard - any place on the chart. Remove the suggestion once the price reached the SL line.
FFx PinBar Setup Alerter gives trade suggestions with Entry, Target 1, Target 2 and StopLoss. Below are the different options available: Entry suggestion - pips to be added over the break for the entry Minimum candle size - to avoid too small candles 3 different options to calculate the SL - by pips, by ATR multiplier or at the pattern High/Low 3 different options to calculate the 2 TPs - by pips, by ATR multiplier or at Risk/Reward Offset the dashboard - any place on the chart Remove the sugges
Automatic, live & interactive picture of all trendlines. Assign push, email and sound alerts to the lines of your choice and be informed about price rollback, breakout, rollback after breakout, number of rollbacks, line expiration by double breakout. Correct, drag or delete the lines and interactively tune the line system. https://youtu.be/EJUo9pYiHFA . Chart examples https: //www.mql5.com/en/users/efficientforex Price Interaction Events All events are effective immediately and only after one
The purpose of this new version of the MT4 standard indicator provided in your platform is to display in a sub-window multiple timeframes of the same indicator with its divergences. See the example shown in the picture below. But the display isn't like a simple MTF indicator. This is the real display of the indicator on its timeframe. Here's the options available in the FFx divergences indicator: Select the timeframes to be displayed (M1 to Monthly) Define the width (number of bars) for each tim
The purpose of this new version of the MT4 standard indicator provided in your platform is to display in a sub-window multiple timeframes of the same indicator with its divergences. See the example shown in the picture below. But the display isn't like a simple MTF indicator. This is the real display of the indicator on its timeframe. Here's the options available in the FFx divergences indicator: Select the timeframes to be displayed (M1 to Monthly). Define the width (number of bars) for each ti
The FFx Dashboard MTF alerter will show you on a single chart all the timeframes (M1 to Monthly) with their own status for the indicator. 2 Alert Options: Single timeframe: each selected timeframe alert separately when a signal occurs Multi timeframes: all selected timeframes must agree for an alert to be triggered Both options have an input to select the timeframes to be used for the alert(s). How to Understand the Status: Green/Red square: histogram above/below 0 line Green square + Red bord
The FFx Dashboard MTF alerter will show you on a single chart all the timeframes (M1 to Monthly) with their own status for the indicator. 2 Alert Options: Single timeframe: each selected timeframe alert separately when a signal occurs Multi timeframes: all selected timeframes must agree for an alert to be triggered Both options have an input to select the timeframes to be used for the alert(s). How to understand the status: Green/Red square: RSI above/below 50 line Green square + Red border: R
The FFx Dashboard MTF alerter will show you on a single chart all the timeframes (M1 to Monthly) with their own status for the indicator. 2 Alert Options: Single timeframe: each selected timeframe alert separately when a signal occurs Multi timeframes: all selected timeframes must agree for an alert to be triggered Both options have an input to select the timeframes to be used for the alert(s). How to understand the status: Green/Red square: Stoch above/below 50 line Green square + Red border:
The FFx Dashboard MTF alerter will show you on a single chart all the timeframes (M1 to Monthly) with their own status for the indicator. 2 Alert Options: Single timeframe: each selected timeframe alert separately when a signal occurs Multi timeframes: all selected timeframes must agree for an alert to be triggered Both options have an input to select the timeframes to be used for the alert(s). How to understand the status: Green/Red square: Price above/below Cloud (Kumo) Green square + Red bo
The FFx Dashboard MTF alerter will show you on a single chart all the timeframes (M1 to Monthly) with their own status for the indicator. 2 Alert Options: Single timeframe: each selected timeframe alert separately when a signal occurs Multi timeframes: all selected timeframes must agree for an alert to be triggered Both options have an input to select the timeframes to be used for the alert(s). How to understand the status: Green/Red square: MA pointing Up/Down Green square + Red border: MA po
The FFx Dashboard MTF alerter will show you on a single chart all the timeframes (M1 to Monthly) with their own status for the indicator. 2 Alert Options: Single timeframe: each selected timeframe alert separately when a signal occurs. Multi timeframes: all selected timeframes must agree for an alert to be triggered. Both options have an input to select the timeframes to be used for the alert(s). How to understand the status: Green square: Price above PSAR Red square: Price below PSAR Options
The FFx Dashboard MTF alerter will show you on a single chart all the timeframes (M1 to Monthly) with their own status for the indicator. 2 Alert Options: Single timeframe: each selected timeframe alert separately when a signal occurs Multi timeframes: all selected timeframes must agree for an alert to be triggered Both options have an input to select the timeframes to be used for the alert(s). How to understand the status: Green/Red square: CCI above/below levels (ie. 100/-100) Grey square: C
The FFx Dashboard MTF alerter will show you on a single chart all the timeframes (M1 to Monthly) with their own status for the indicator. 2 Alert Options: Single timeframe: each selected timeframe alert separately when a signal occurs Multi timeframes: all selected timeframes must agree for an alert to be triggered Both options have an input to select the timeframes to be used for the alert(s). How to understand the status: Green/Red square: ADX above level Grey square: ADX below level Red bor
Altri dall’autore
La paura più grande nel trading non è la perdita, ma piuttosto la "direzione incerta". Perché molti trader vengono fermati dallo stop-loss? Perché osservano un solo timeframe. Questo indicatore utilizza la tecnologia di riduzione del rumore basata sull'intelligenza artificiale per combinare la robustezza del timeframe H1 con la sensibilità del timeframe M15, creando un filtro di trend automatico. "Lascia che siano i dati a parlare, lascia che l'IA ti guidi e tu dovrai solo raccogliere i frutti
FREE
La paura più grande nel trading non è la perdita, ma piuttosto la "direzione incerta". Perché molti trader vengono fermati dallo stop-loss? Perché osservano un solo timeframe. Questo indicatore utilizza la tecnologia di riduzione del rumore basata sull'intelligenza artificiale per combinare la robustezza del timeframe H1 con la sensibilità del timeframe M15, creando un filtro di trend automatico. "Lascia che siano i dati a parlare, lascia che l'IA ti guidi e tu dovrai solo raccogliere i frutti
Filtro:
Nessuna recensione
Rispondi alla recensione