MarketTrend AI40
- 지표
- 버전: 1.1
- 업데이트됨: 10 5월 2026
- 활성화: 5

트레이딩에서 가장 큰 두려움은 손실이 아니라 "불확실한 방향성"입니다.
많은 트레이더들이 손절매에 걸리는 이유는 무엇일까요? 바로 단일 시간대 차트만 보기 때문입니다. 이 지표는 AI 노이즈 감소 기술을 활용하여 H1 차트의 견고함과 M15 차트의 민감도를 결합함으로써 자동화된 추세 필터를 제공합니다.
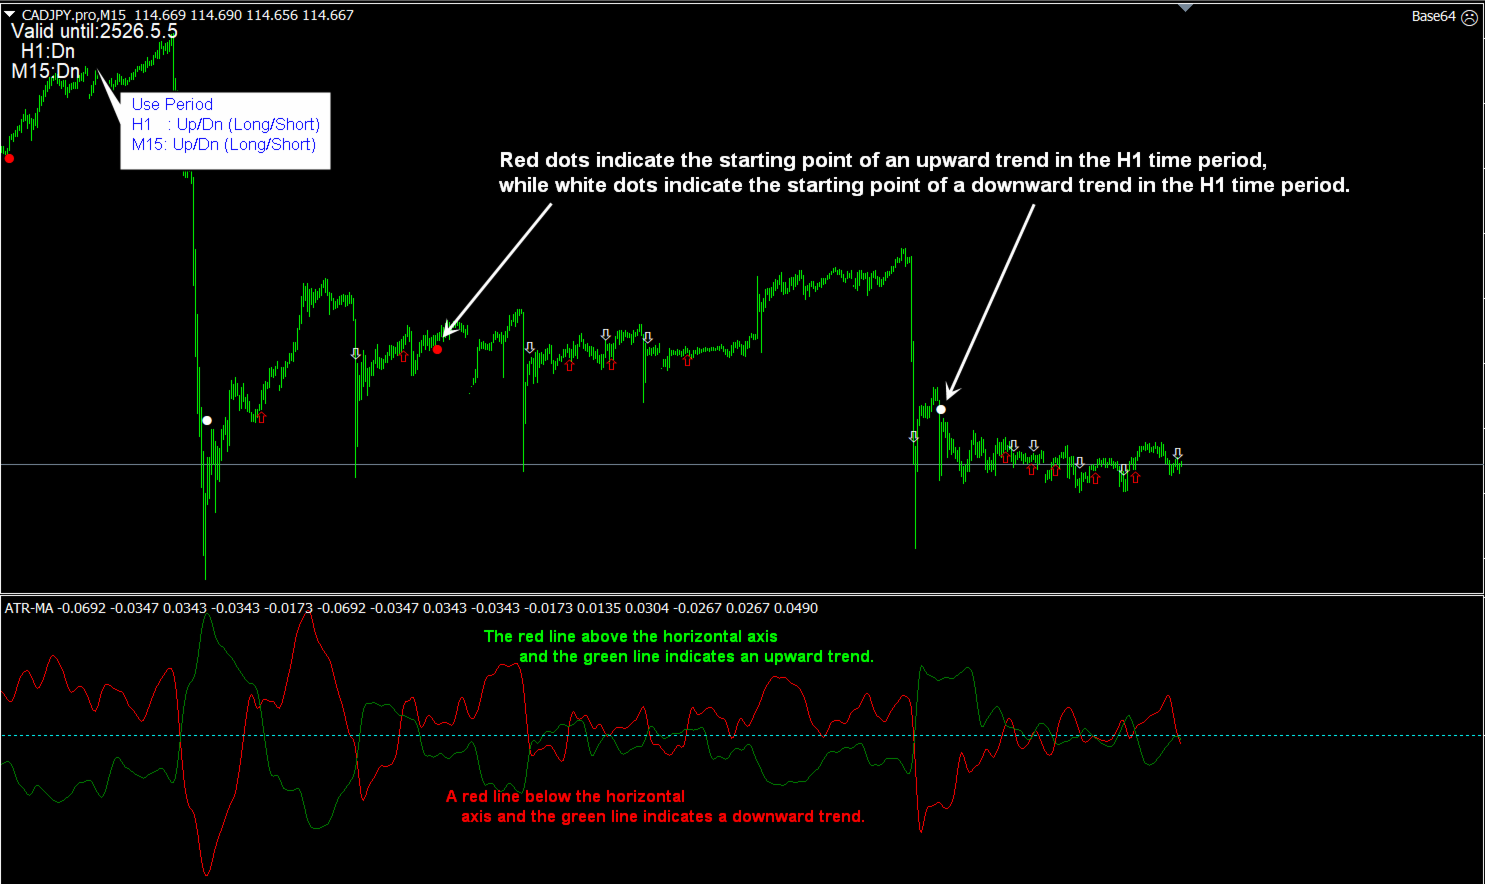
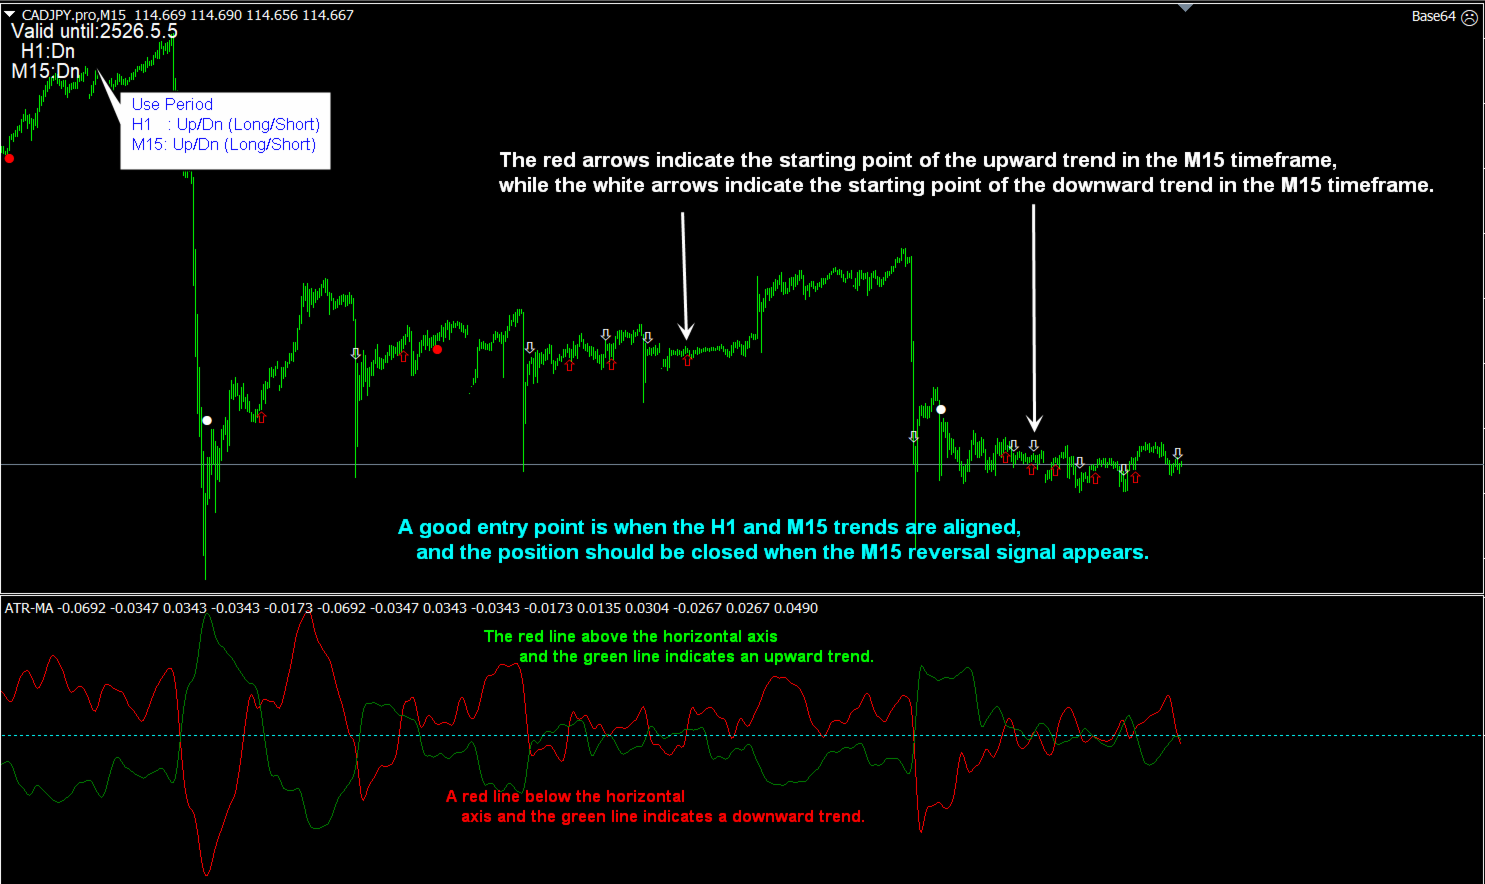
"데이터가 말하고, AI가 길을 안내하는 대로 따라가세요. 당신은 그저 수익을 거두기만 하면 됩니다." 이 지표는 상품 차트에 H1(점)과 M15(화살표) 두 시간대의 추세 방향을 표시합니다. 다른 시간대의 계산 결과는 아래 곡선에 표시됩니다. 시장 방향, 변동성, 강도, 거래량 등은 스토캐스틱, MACD, RSI 등의 지표를 참고하시기 바랍니다. 이 지표는 파동 움직임의 방향과 적절한 진입 및 청산 시점을 정확하게 판단할 수 있습니다.
키를 요청하시려면 sellcoco0907@gmail.com으로 계정 정보를 모두 남겨주세요.
지표 주요 기능:
1. AI 다중 시간 프레임(MTF) 동적 계산
이 지표는 H1(장기 추세 모니터링)과 M15(정확한 진입 시점 파악)를 자동으로 동기화하는 AI 추세 필터링 알고리즘을 탑재하고 있습니다. AI는 수익 잠재력이 부족한 추세 내의 미세한 변동을 자동으로 걸러내어 항상 주요 추세의 올바른 방향에 있도록 하고, 횡보 구간에서의 심리적 압박을 줄여줍니다.
H1 점: 주요 추세 방향을 포착하는 레이더 역할을 합니다.
M15 화살표: 정확한 진입/청산 시점을 포착하는 버튼 역할을 합니다.
2. 이중 기간 차트, 방향 및 진입/청산 시점 즉시 파악
시중의 단일 논리 지표와 달리, 이 도구는 H1과 M15 시간 프레임의 추세를 동시에 표시합니다. 추세 소진 신호를 조기에 감지하여 시장 반전 전에 "우아하게 청산"할 수 있도록 도와줍니다. 점과 화살표 방향이 일치할 때, 이는 높은 확률의 "공명 거래 영역"입니다.
3. 완벽한 호환성: 최고의 거래 조합 구축
이 지표는 스윙 트레이더를 위해 특별히 설계되었으며, 기존 지표(스토캐스틱, MACD, RSI)와 매우 상호보완적입니다. 기존 지표들이 "강도"를 파악하는 반면, 이 지표는 "방향"을 파악하여 완벽한 거래 시스템을 구축합니다.
많은 트레이더들이 손절매에 걸리는 이유는 무엇일까요? 바로 단일 시간대 차트만 보기 때문입니다. 이 지표는 AI 노이즈 감소 기술을 활용하여 H1 차트의 견고함과 M15 차트의 민감도를 결합함으로써 자동화된 추세 필터를 제공합니다.
"데이터가 말하고, AI가 길을 안내하는 대로 따라가세요. 당신은 그저 수익을 거두기만 하면 됩니다." 이 지표는 상품 차트에 H1(점)과 M15(화살표) 두 시간대의 추세 방향을 표시합니다. 다른 시간대의 계산 결과는 아래 곡선에 표시됩니다. 시장 방향, 변동성, 강도, 거래량 등은 스토캐스틱, MACD, RSI 등의 지표를 참고하시기 바랍니다. 이 지표는 파동 움직임의 방향과 적절한 진입 및 청산 시점을 정확하게 판단할 수 있습니다.
키를 요청하시려면 sellcoco0907@gmail.com으로 계정 정보를 모두 남겨주세요.
지표 주요 기능:
1. AI 다중 시간 프레임(MTF) 동적 계산
이 지표는 H1(장기 추세 모니터링)과 M15(정확한 진입 시점 파악)를 자동으로 동기화하는 AI 추세 필터링 알고리즘을 탑재하고 있습니다. AI는 수익 잠재력이 부족한 추세 내의 미세한 변동을 자동으로 걸러내어 항상 주요 추세의 올바른 방향에 있도록 하고, 횡보 구간에서의 심리적 압박을 줄여줍니다.
H1 점: 주요 추세 방향을 포착하는 레이더 역할을 합니다.
M15 화살표: 정확한 진입/청산 시점을 포착하는 버튼 역할을 합니다.
2. 이중 기간 차트, 방향 및 진입/청산 시점 즉시 파악
시중의 단일 논리 지표와 달리, 이 도구는 H1과 M15 시간 프레임의 추세를 동시에 표시합니다. 추세 소진 신호를 조기에 감지하여 시장 반전 전에 "우아하게 청산"할 수 있도록 도와줍니다. 점과 화살표 방향이 일치할 때, 이는 높은 확률의 "공명 거래 영역"입니다.
3. 완벽한 호환성: 최고의 거래 조합 구축
이 지표는 스윙 트레이더를 위해 특별히 설계되었으며, 기존 지표(스토캐스틱, MACD, RSI)와 매우 상호보완적입니다. 기존 지표들이 "강도"를 파악하는 반면, 이 지표는 "방향"을 파악하여 완벽한 거래 시스템을 구축합니다.