VWAP Edge Pro
- Indicatori
- Versione: 3.7
- Aggiornato: 30 aprile 2026

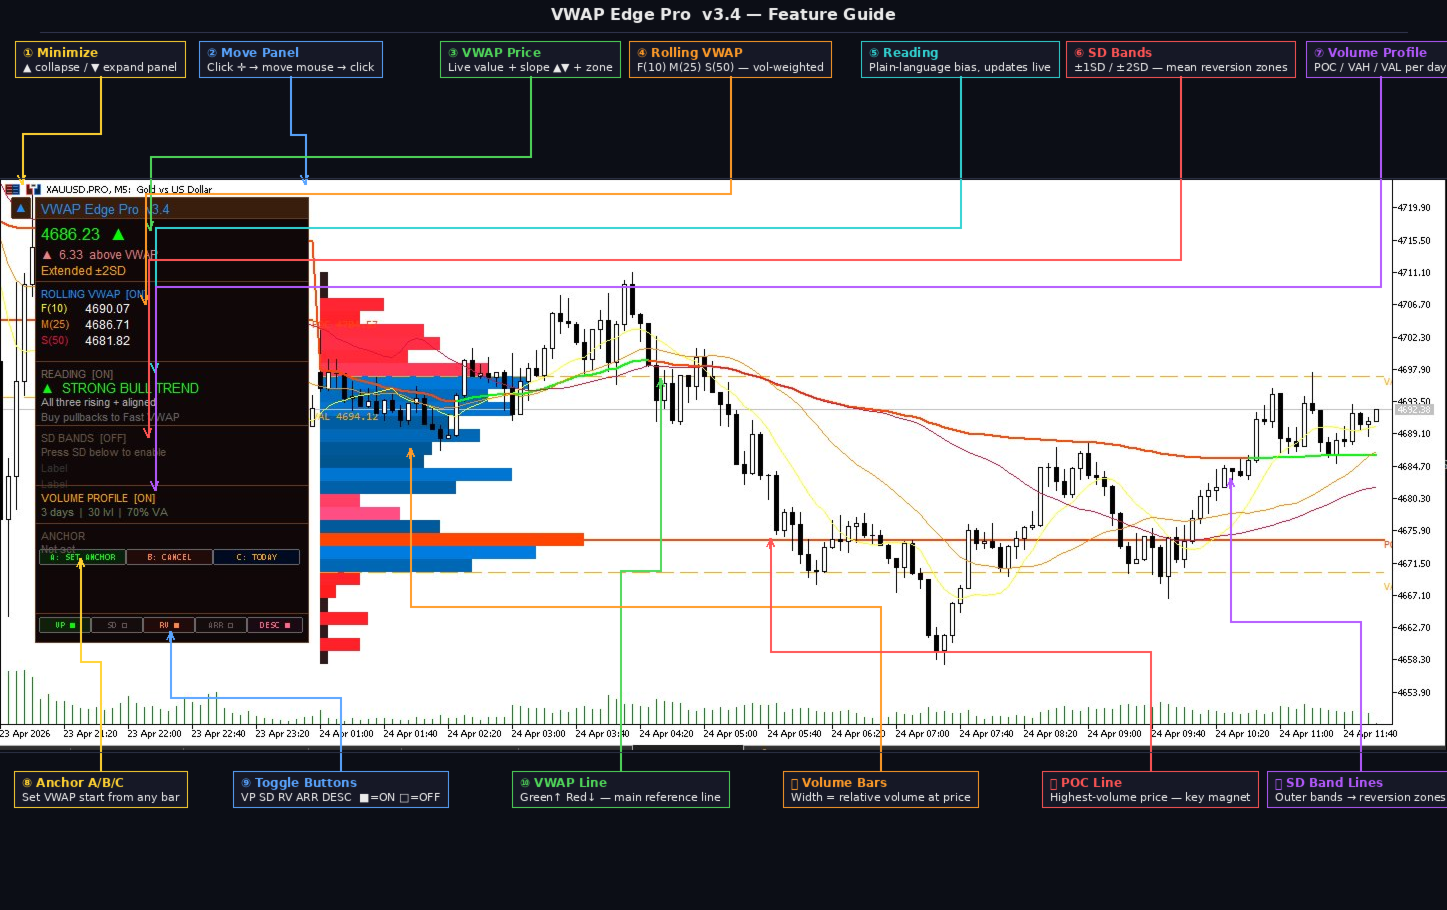
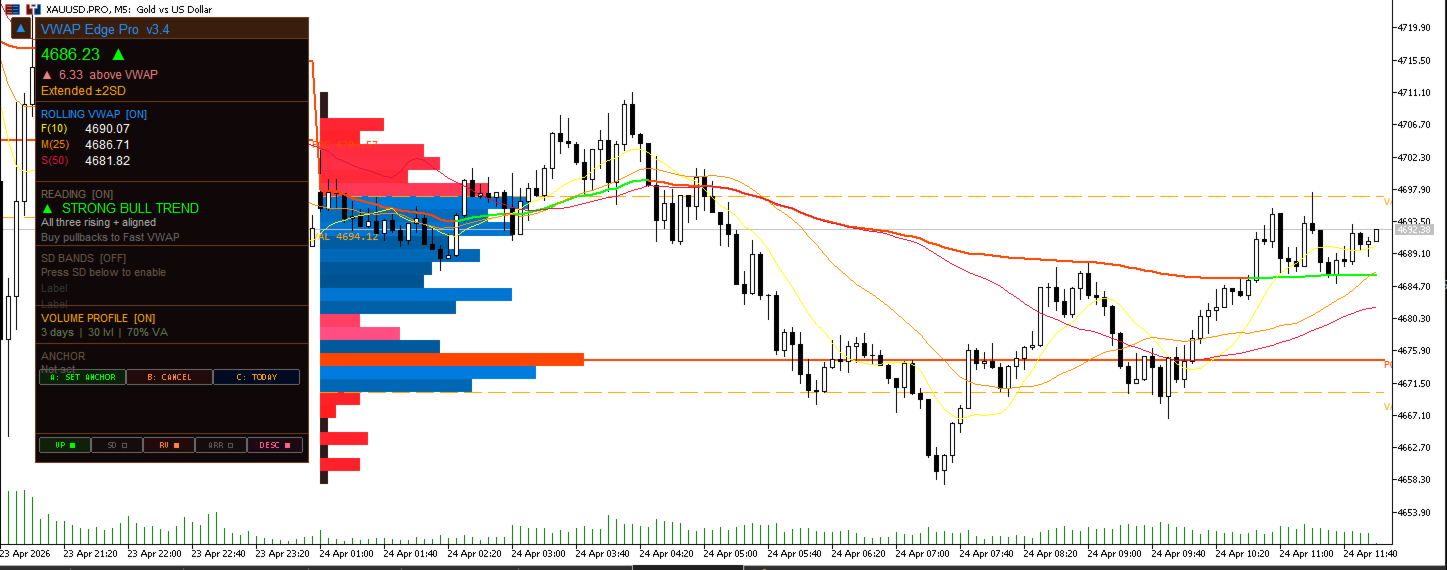
VWAP Edge Pro is a Volume Weighted Average Price indicator for MetaTrader 5 that combines session VWAP, rolling VWAPs, standard deviation bands, daily volume profile, and a live signal reading panel in a single indicator.
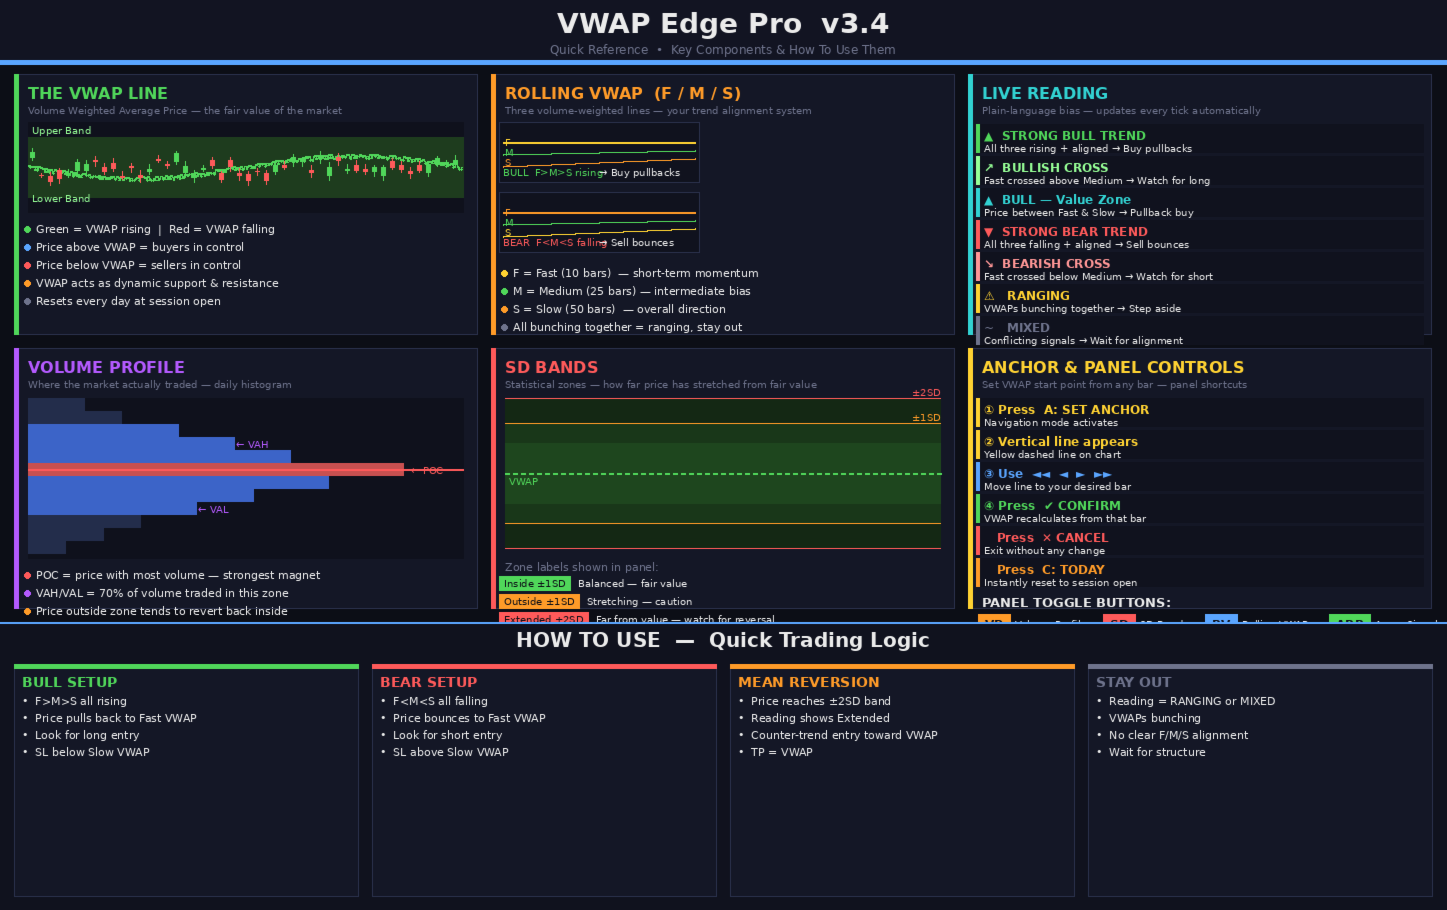
VWAP (Volume Weighted Average Price) calculates the average price of an instrument weighted by volume. It resets at the start of each session and is used by many intraday traders as a reference for fair value. Price above VWAP suggests buyers are in control. Price below VWAP suggests sellers are in control.
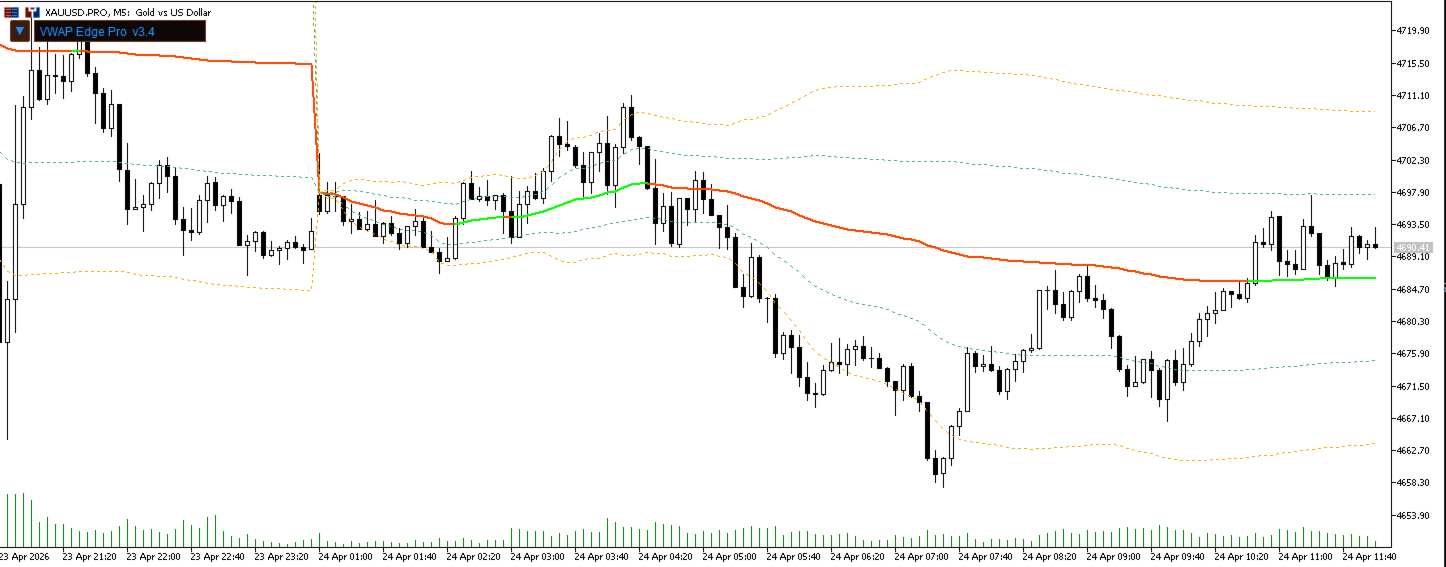
Session VWAP
The main VWAP line resets at the start of the selected period. The line changes color based on slope direction. Four reset modes are available: Daily, Weekly, Monthly, and Anchored. In Anchored mode the VWAP starts from a bar selected by the user using the navigation controls on the panel.
Standard Deviation Bands
Three pairs of bands show how far price has moved from the VWAP, calculated using volume-weighted variance. Each band pair can be set to a different multiplier (0.5x to 3.0x). The panel shows the current zone: Inside 1SD, Outside 1SD, Extended 2SD, or Extreme 3SD.
Rolling VWAP
Three independent rolling VWAPs run alongside the session VWAP. Default periods are Fast (10 bars), Medium (25 bars), and Slow (50 bars), each configurable from 5 to 100 bars. When all three are aligned in the same direction the trend is considered confirmed. When they converge the market is likely ranging.
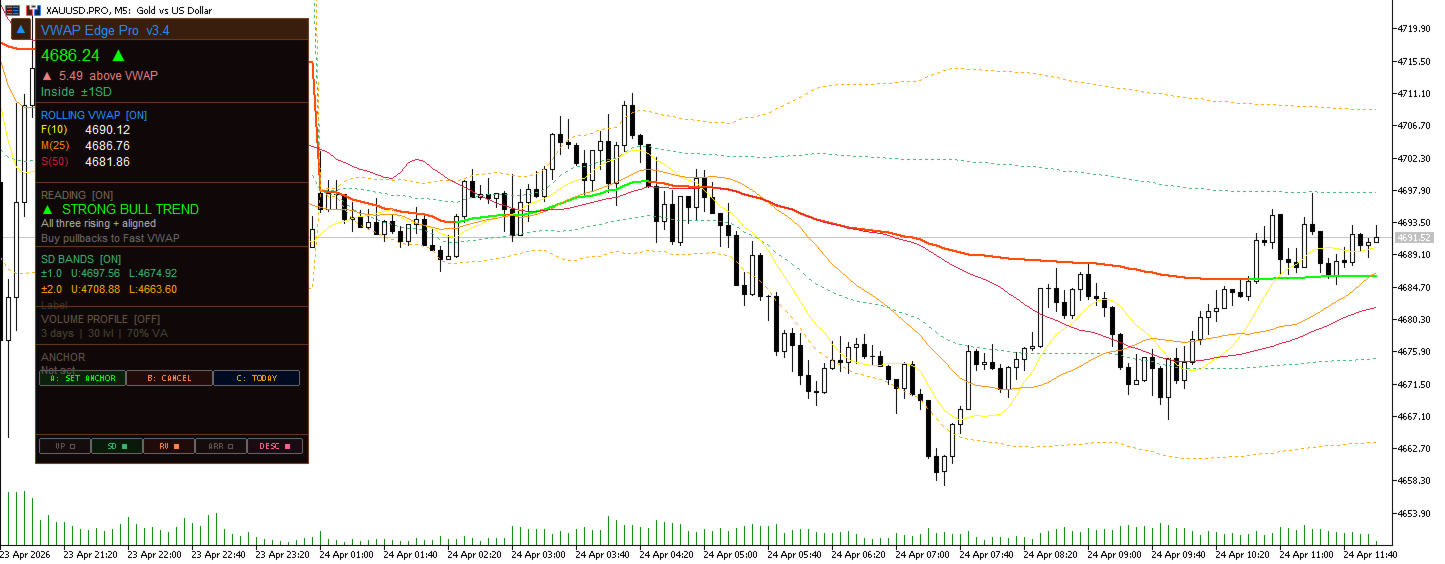
Reading Panel
The Reading section interprets the rolling VWAP configuration and displays a plain-language description of the current condition, updated on every tick. Conditions shown include: Strong Bull Trend, Bullish Cross, Bull Value Zone, Strong Bear Trend, Bearish Cross, Ranging, and Mixed.
Daily Volume Profile
A horizontal volume histogram is drawn on the left edge of each trading day. The following levels are marked:
- POC — the price level where the most volume was traded
- VAH — the upper boundary of the zone where 70% of volume was traded
- VAL — the lower boundary of that zone
- HB — the half-back level, midpoint of the day's high and low range
Up to five days of profiles can be displayed simultaneously.
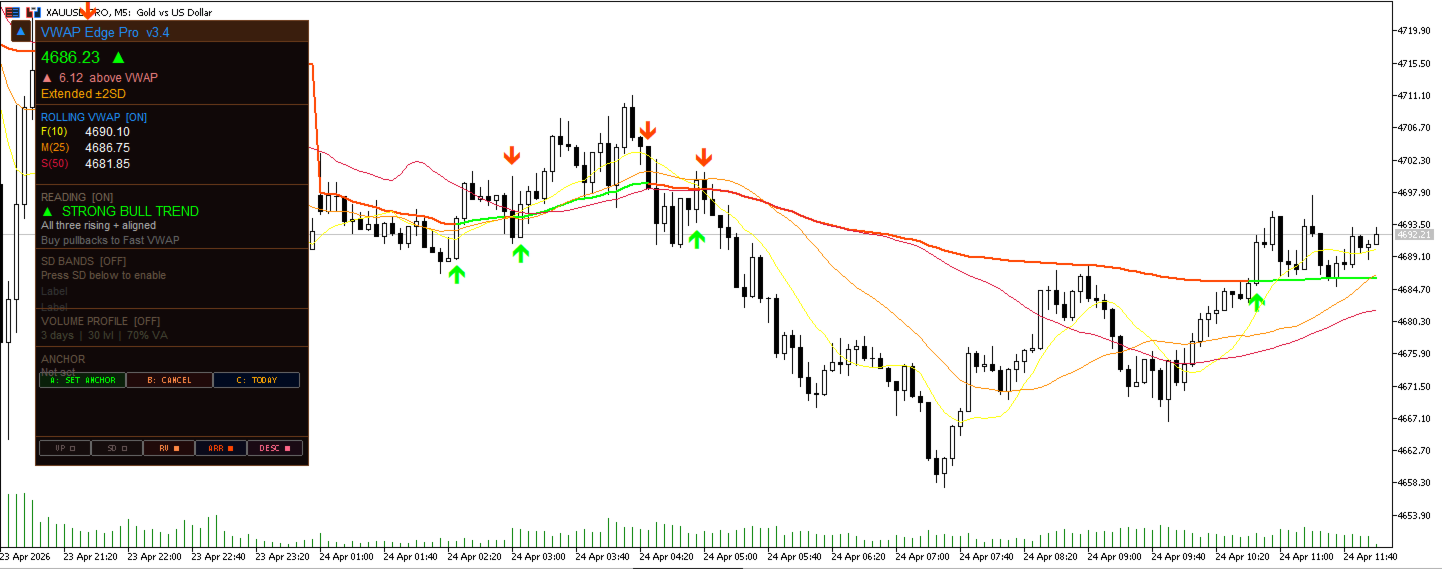
Arrow Signals
Filled triangle arrows appear on the chart when price crosses the VWAP line. A green arrow below the bar indicates a bullish cross. A red arrow above the bar indicates a bearish cross.
Alert System
Alerts can be enabled individually in the inputs. Available types: VWAP line cross, Band 1 touch, Band 2 touch, and Reading signal change. Delivery options: pop-up window, push notification, or email.
Control Panel
All features can be toggled on or off from buttons at the bottom of the panel without opening the indicator settings. The panel can be minimized and repositioned anywhere on the chart. Toggle buttons: VP (volume profile), SD (standard deviation bands), RV (rolling VWAPs), ARR (arrow signals), DESC (reading description).
Anchor Mode
In Anchored mode the VWAP calculates from a specific bar selected by the user. Navigation buttons on the panel move a marker bar by bar through history. Pressing Confirm locks the anchor and the VWAP recalculates from that point.
Compatibility
Works on all instruments in MetaTrader 5 including Forex, indices, metals, commodities, and cryptocurrencies. All timeframes from M1 to D1 are supported. Both hedging and netting account types are supported.
Settings
- Session VWAP: reset mode, price source, volume type
- SD Bands: number of bands (0 to 3), multiplier per band, color per band
- Rolling VWAP: period for each of the three lines, color per line
- Volume Profile: number of days, price levels, value area percentage, half-back toggle and color
- Signals: arrow toggle, minimum bars between signals
- Alerts: enable per event type, delivery method
- Visual: VWAP line colors, line width, panel display toggle
Version Notes
- v3.7 — Added half-back level to volume profile
- v3.6 — Added alert when reading changes to bullish or bearish state
- v3.5 — Fixed crash when editing indicator settings
- v3.4 — Panel repositioning, fixed layout, resolved text overlap
- v3.2 — Panel move feature, improved section spacing
- v3.0 — Arrow signals with panel toggle button
- v2.8 — Clean startup with all optional features off by default
- v2.3 — Initial release


This is an incredible indicator — extremely powerful and very well thought out. It really stands out compared to others I’ve used. Thank you for creating and sharing such a great tool!