SMC Structure Engine

Key Features

• Automatic Smart Money Concepts market structure detection (HH, HL, LH, LL)
• BOS (Break of Structure) and CHoCH (Change of Character) signals
• Automatic Demand and Supply Order Block detection
• Buy-Side Liquidity (BSL) and Sell-Side Liquidity (SSL) identification
• Liquidity sweep detection
• Built-in market structure info panel
• Customizable display settings
• Optional trading alerts


Overview

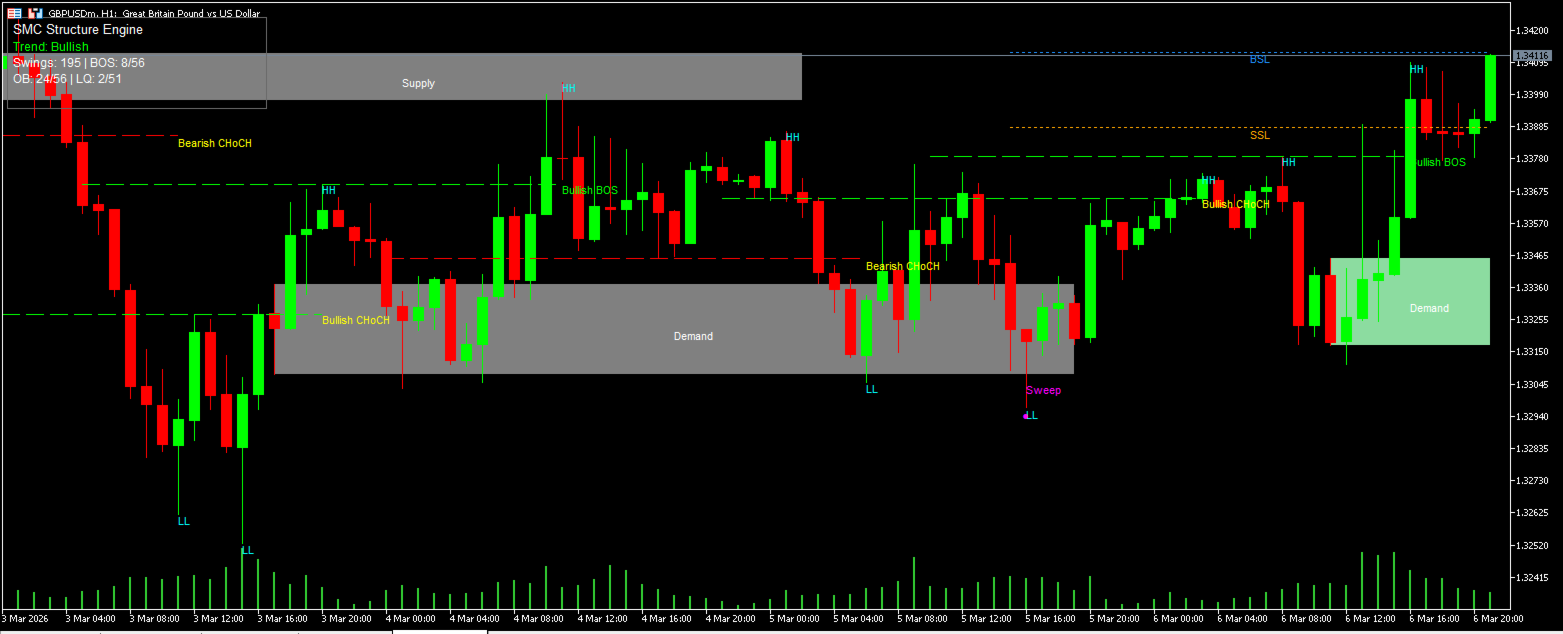
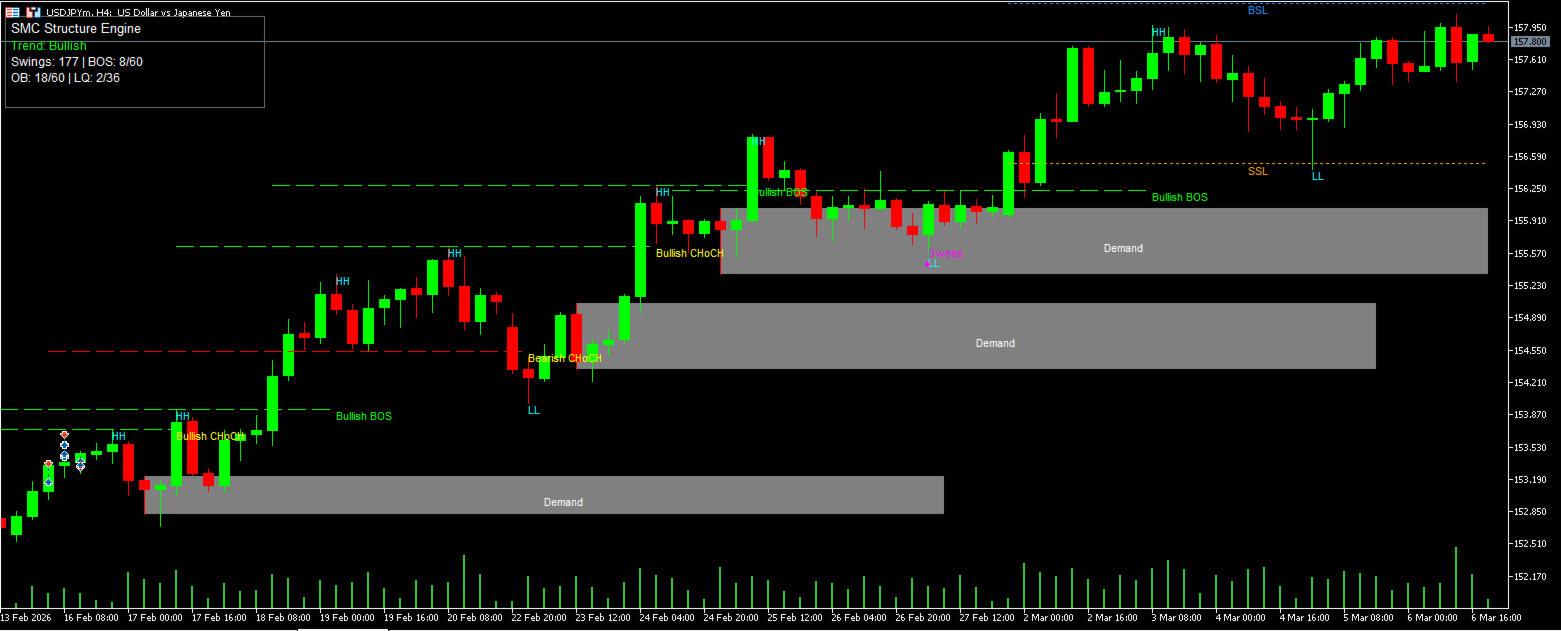
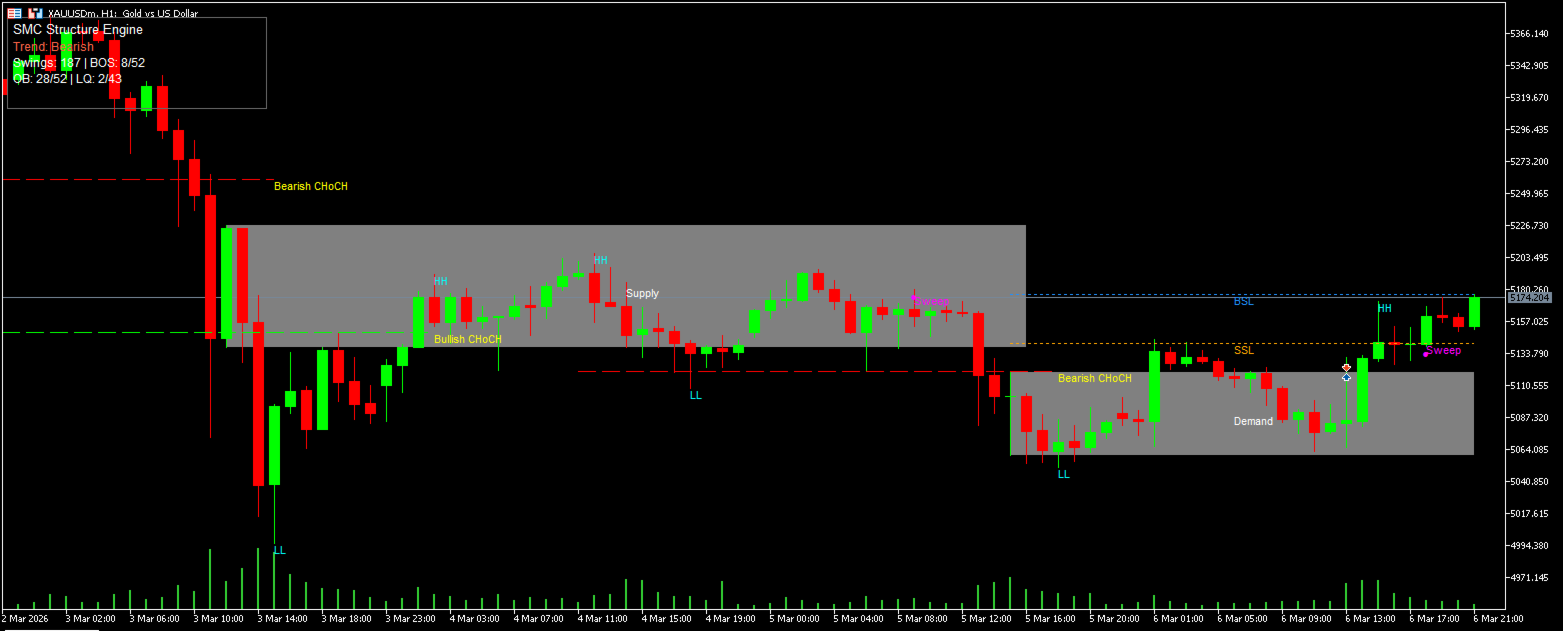
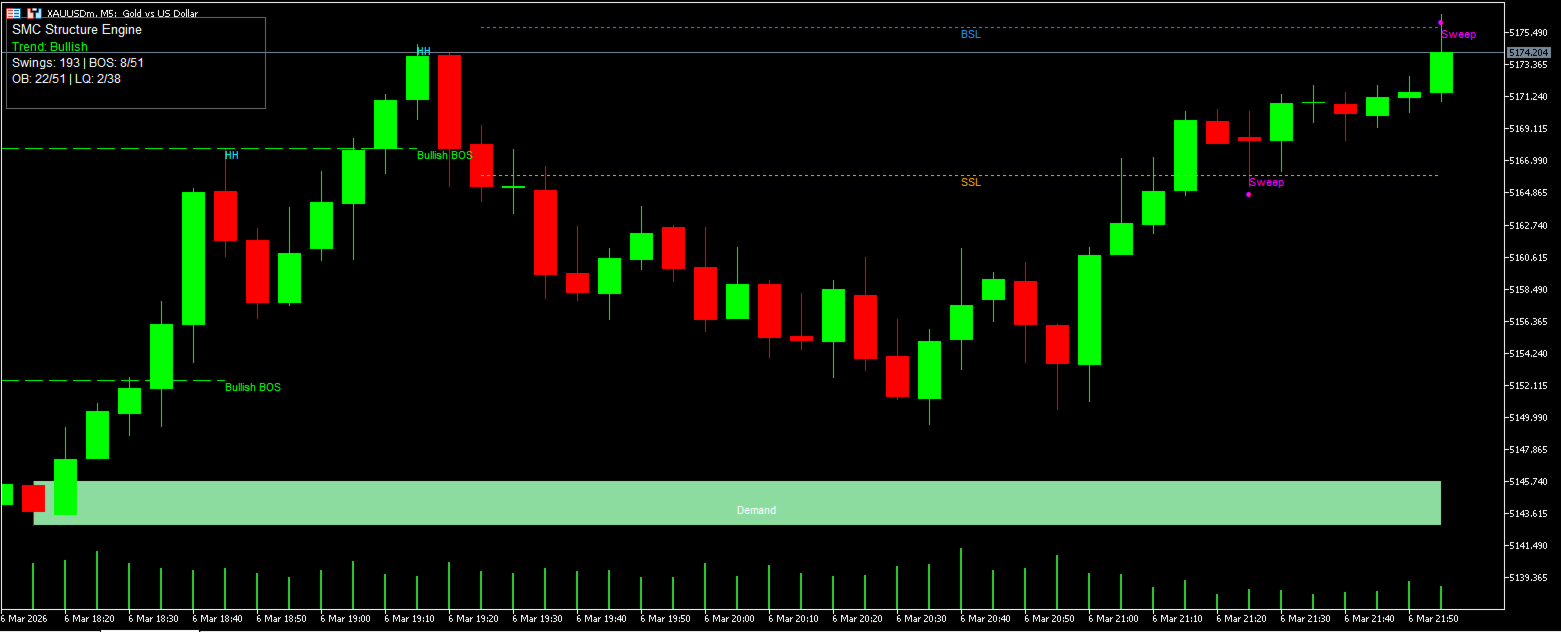
SMC Structure Engine is a Smart Money Concepts (SMC) indicator designed to automatically identify market structure and institutional-style price levels used in SMC analysis.

The indicator detects key structural events such as Break of Structure (BOS) and Change of Character (CHoCH), highlights supply and demand zones commonly referred to as order blocks, and maps liquidity levels that often act as price targets.

SMC Structure Engine helps traders quickly understand the current market structure without manually drawing levels.

The indicator works on any timeframe and supports Forex, Gold (XAUUSD), Indices and Crypto markets.

Main Features

✔ Automatic Market Structure Detection
Identifies BOS (Break of Structure) and CHoCH (Change of Character) events.

✔ Order Blocks
Automatically detects supply and demand zones commonly referred to as order blocks.

✔ Liquidity Level Mapping
Displays Buy-Side Liquidity (BSL) and Sell-Side Liquidity (SSL) where stop clusters often accumulate.

✔ Smart Money Market Bias
Displays the current trend bias directly on the chart.

✔ Equal Highs and Equal Lows Detection
Helps identify potential liquidity pools.

✔ Fully Customizable Settings
Control which elements are displayed on the chart.

✔ Built-in Alerts
Optional alerts for:

BOS

CHoCH

Liquidity sweep

New order block formation

How the Indicator Works

The indicator analyzes market swings using pivot detection and identifies structural changes in price action.

When a significant structure break occurs, the indicator marks:

• Break of Structure (BOS)
• Change of Character (CHoCH)

Order blocks are detected using price action patterns, and liquidity levels are calculated from significant highs and lows.

These elements help traders identify:

• Potential reversal zones
• Liquidity targets
• Institutional trading areas

Best Used For

SMC Structure Engine is ideal for traders using:

• Smart Money Concepts (SMC)
• ICT trading strategies
• Price Action trading
• Supply and Demand trading

Recommended Markets

The indicator works on all instruments including:

• XAUUSD (Gold)
• EURUSD
• GBPUSD
• USDJPY
• Crypto pairs
• Indices

Recommended Time Frame

Works on all timeframes.

Popular choices:

• M5 / M15 for scalping
• M15 / H1 for intraday trading
• H1 / H4 for swing trading

Alerts

The indicator can generate alerts for:

• Break of Structure (BOS)
• Change of Character (CHoCH)
• Liquidity sweeps
• New order block creation

Alerts help traders monitor multiple charts efficiently.


Quick Start Guide

1. Attach the indicator to any chart

The indicator works on all symbols and timeframes.

2. Identify market structure

Watch the structure labels:

  • HH / HL → bullish structure

  • LH / LL → bearish structure

These help determine the current market bias.

3. Watch for BOS and CHoCH

  • BOS (Break of Structure) confirms continuation of the current trend.

  • CHoCH (Change of Character) signals a possible trend reversal.

4. Use Demand and Supply zones

The indicator automatically marks institutional Order Blocks:

  • Demand zones → potential buying areas

  • Supply zones → potential selling areas

Price often reacts when revisiting these zones

5. Monitor liquidity levels

Liquidity levels show areas where stop-loss orders accumulate:

  • BSL (Buy-Side Liquidity) - located above equal highs

  • SSL (Sell-Side Liquidity) - located below equal lows

Markets frequently target these levels before reversing.

6. Watch for liquidity sweeps

A Sweep occurs when price briefly breaks a liquidity level before reversing
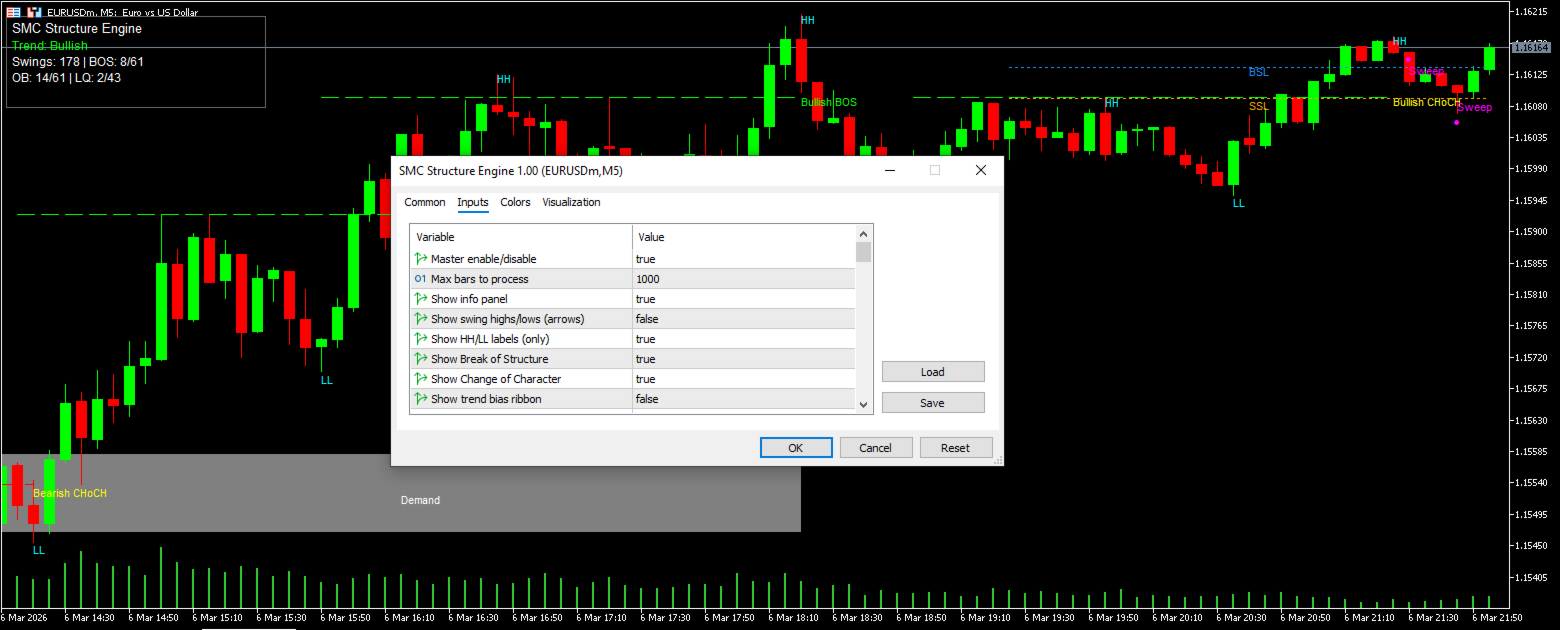
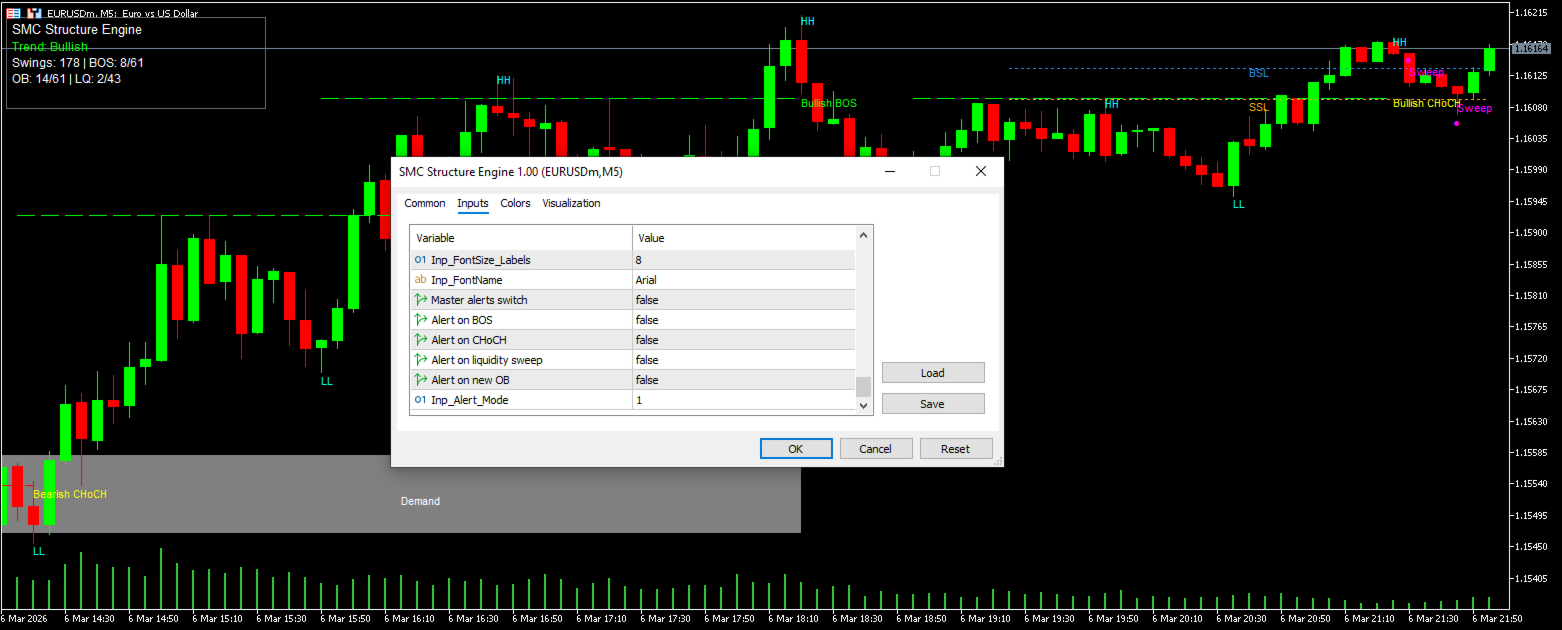

Input Settings Manual

General Settings

Master enable/disable

-Enables or disables the indicator completely.

true  = indicator active
false = indicator disabled

Max bars to process

-Limits how many historical candles the indicator analyzes.

Example:

1000 = analyze the last 1000 candles

Lower values increase performance.

Show info panel

-Displays the information panel on the chart showing current structure statistics.

Market Structure Settings

Show swing highs/lows (arrows)

-Displays arrows marking detected swing highs and swing lows.

true  = show arrows
false = hide arrows

Show HH/LL labels (only):

-Shows only Higher High (HH) and Lower Low (LL) labels without arrows.

Show Break of Structure

-Displays BOS labels when price breaks previous structural levels.

Show Change of Character

-Displays CHoCH labels when the market structure shifts direction.

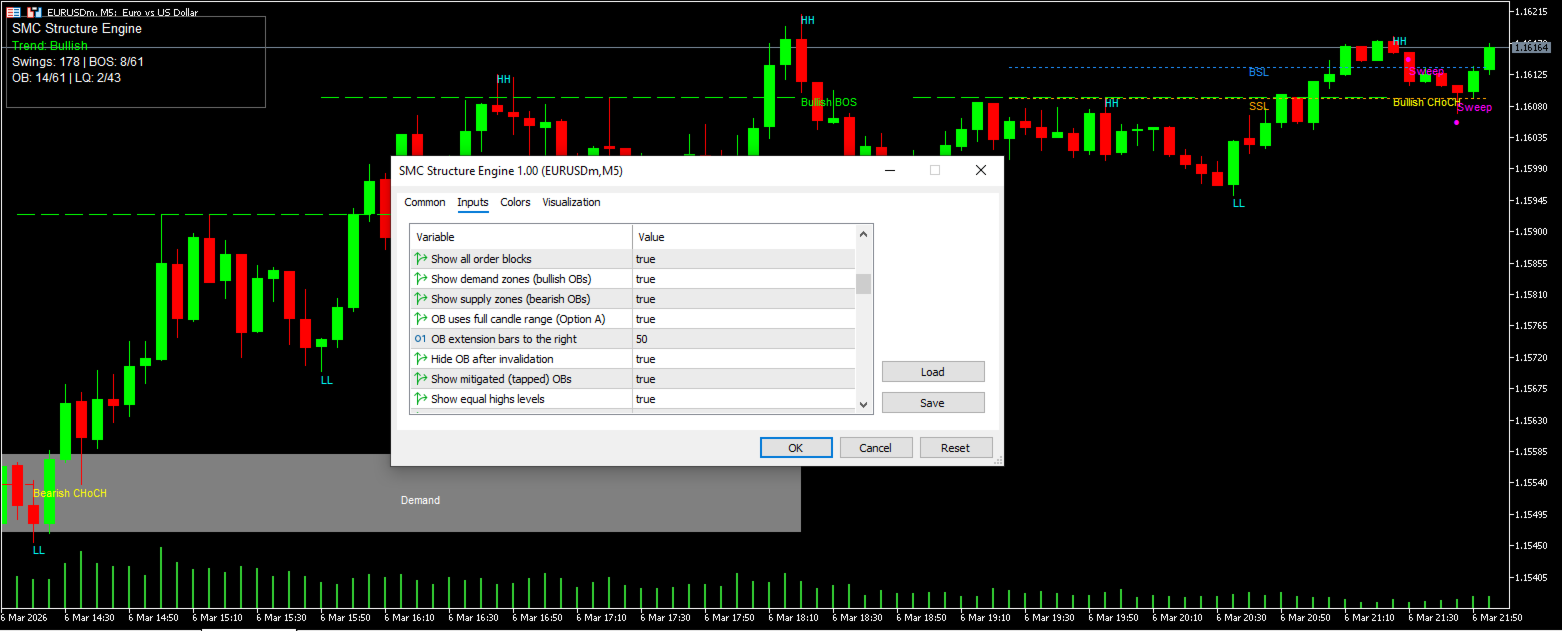
Order Block Settings

Show all order blocks

-Displays all detected order blocks.

Show demand zones (bullish OBs)

-Displays bullish order blocks.

Show supply zones (bearish OBs)

-Displays bearish order blocks.

OB uses full candle range

-Defines how order blocks are calculated.

true  = use full candle range
false = use candle body only

OB extension bars to the right

-Defines how far order blocks extend into the future.

Example:

50 = OB extends 50 candles to the right

Hide OB after invalidation

-Automatically hides order blocks once price invalidates the zone.

Show mitigated (tapped) OBs

-Displays order blocks that were already touched by price.

-Mitigated order blocks are usually considered weaker zones.

Liquidity Settings

Show equal highs levels

-Detects equal highs that represent Buy-Side Liquidity (BSL).

Show equal lows levels

-Detects equal lows that represent Sell-Side Liquidity (SSL).

Show liquidity sweeps

-Displays sweep markers when liquidity is taken.

-A sweep occurs when price temporarily breaks a liquidity level before reversing.

Alert Settings(Disabled on Default)

Master alerts switch

-Enables or disables all alerts.

Alert on BOS

-Triggers alert when Break of Structure occurs.

Alert on CHoCH

-Triggers alert when Change of Character occurs.

Alert on liquidity sweep

-Triggers alert when liquidity is swept.

Alert on new OB

-Triggers alert when a new order block is detected.

Alert mode

-Defines how alerts are delivered.

Examples:

1 = popup alert
2 = sound alert
3 = push notification

Info Panel Legend

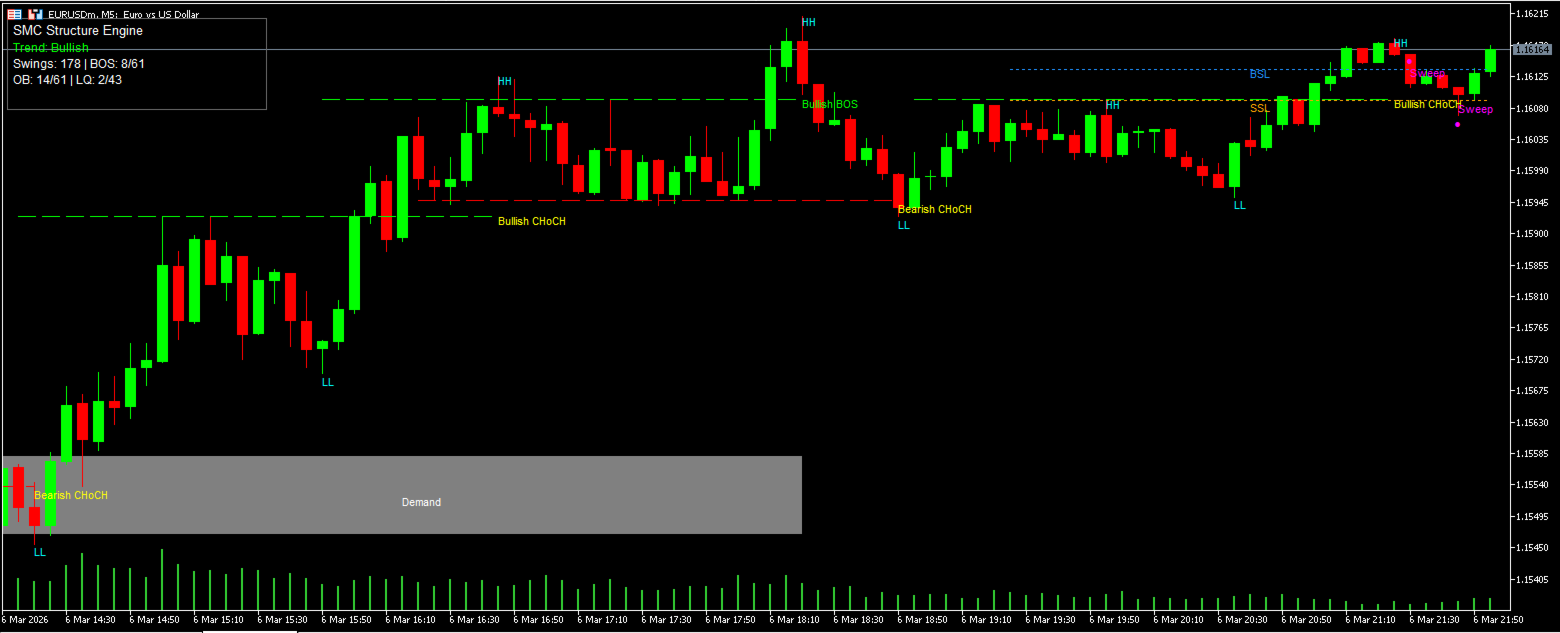
The Info Panel summarizes current market structure information.

Example:

Trend: Bullish
Swings: 178
BOS: 8/61
OB: 14/61
LQ: 2/43

Explanation:

Trend

-Current market bias determined from structure.

Bullish = market making higher highs
Bearish = market making lower lows

Swings

-Total detected swing points used to build market structure.

BOS (visible/total)

-Break of Structure events.

Example:

8 / 61
8 = currently visible BOS
61 = total detected BOS

OB (visible/total)

-Order Blocks.

Example:

14 / 61
14 = currently displayed zones
61 = total detected historically

LQ (visible/total)

-Liquidity levels.

Example:

2 / 43
2 = currently visible liquidity levels
43 = total detected internally


Notes

This indicator is a technical analysis tool designed to assist traders in identifying market structure and price levels.

This indicator should be used together with proper risk management and trading confirmation techniques.

It does not guarantee profits and should be used as part of a complete trading strategy.

Version 1.00 – Initial release

Prodotti consigliati
Offerta speciale : ALL TOOLS , solo $35 ciascuno! New tools   will be   $30   for the   first week   or the   first 3 purchases !  Trading Tools Channel on MQL5 : Join my MQL5 channel to update the latest news from me In un ambiente di trading volatile, uno strumento di analisi potente e intuitivo può aiutarti a cogliere rapidamente le opportunità. Fibonacci Trend Scanner non solo integra le funzioni tradizionali dell’indicatore Fibonacci e SuperTrend, ma amplia anche le funzionalità con la sca
NTL Pivot Lines
Northen Trading Labs
Pivot Lines (PL) User Guide Overview and Features The Pivot Lines Indicator (PL) provides traders with a powerful tool for identifying potential support and resistance levels based on well-established pivot point calculation methods. By offering insights into possible price turning points, this indicator helps traders make more informed trading decisions and refine their entry and exit strategies. With customizable settings for different timeframes and calculation methods, PL is versatile and a
Indicator Description: 5 EMA with Ichimoku-like Color Filling   is a technical analysis indicator for MetaTrader 5 that combines five Exponential Moving Averages (EMAs) with visual fill areas similar to the Ichimoku Cloud concept. Key Features: Five EMA Lines : EMA1 (13-period): Fastest moving average EMA2 (21-period): Medium-fast moving average EMA3 (34-period): Base/reference moving average EMA4 (55-period): Medium-slow moving average EMA5 (233-period): Slowest moving average (often used as a
ArcTracer
Syed Oarasul Islam
This Indicator draws Fibonacci Arc levels in two different ways. You can select whether to draw Fibonacci Arc levels based on your favourite ZigZag settings or you can let the indicator to draw Arc levels based on given number of bars or candles.  You can also set Mobile and Email notification for your favourite Arc levels individually. With this indicator you will not have to feel lonely as the it can generate Voice alerts, which will keep you focused on your trading and remove boredom.  Produc
Auto Fibonacci Retracement Indicator — Flexible and Reliable This isn’t just another Auto Fibonacci Retracement indicator. It’s one of the most flexible and dependable tools available . If you find it useful, please consider leaving a review or comment — your feedback means a lot! Check out my other helpful tools below: Smart Alert Manager   - Set up advanced alerts and send them to Mobile, Telegram, Discord, Webhook... Timeframes Trend Scanner    - Scan the trend of assets in difference timefr
FREE
Pivots Lines
Abakou Nazaire Ayelenou
5 (1)
Disegna i punti pivot Traditionnal, Fibonacci, Woodie, Classic, Demark, Camarilla per qualsiasi timeframe Supporta tutti i tipi di pivot Traditionnal, Fibonacci, Woodie, Classic, Demark, Camarilla Supporta qualsiasi timeframe (M1...H1...D1...MN1...Annuale) Supporto server ora legale Supporta la sezione giornaliera del forex dall'apertura di Sydney alla chiusura degli Stati Uniti Supporta il trading di criptovalute Riempi il divario tra il pivot e la tendenza, molto utile I punti pivot mostran
FREE
This Automatic support/resistance indicator calculates various peaks and troughs of the price action, identifies relevant levels and draws support and resistance automatically. It uses the built-in "ZigZag" indicator in Metatrader as a data source hence, very much accurate indicator.  The support and resistance lines are contineusely updated as new levels and formed. The indicator has only 5 parameters to set, and mostly it can be used with the default values:  The description of the settings is
FibExtender
Syed Oarasul Islam
This Indicator draws Fibonacci Extension levels in two different ways. You can select whether to draw Fibonacci Extension levels based on your favourite ZigZag settings or you can let the indicator to draw Fibonacci Extension  level based on given number of Bars or Candles.  You can also set Mobile and Email notification for your favourite Extension  levels individually. With this indicator you will not have to feel lonely as the it can generate Voice alerts, which will keep you focused on your
Introduction to Harmonic Pattern Scenario Planner The present state of Forex market can go through many different possible price paths to reach its future destination. Future is dynamic. Therefore, planning your trade with possible future scenario is an important step for your success. To meet such a powerful concept, we introduce the Harmonic Pattern Scenario Planner, the first predictive Harmonic Pattern Tool in the world among its kind. Main Features Predicting future patterns for scenario
Auto Fib Retracements
Ross Adam Langlands Nelson
4.2 (5)
Automatic Fibonacci Retracement Line Indicator. This indicator takes the current trend and if possible draws Fibonacci retracement lines from the swing until the current price. The Fibonacci levels used are: 0%, 23.6%, 38.2%, 50%, 61.8%, 76.4%, 100%. This indicator works for all charts over all timeframes. The Fibonacci levels are also recorded in buffers for use by other trading bots. Any comments, concerns or additional feature requirements are welcome and will be addressed promptly. 
FREE
The   DailyWeeklyMarkers   indicator helps traders visualize trading weeks by clearly marking the start of each day and week on the chart. It draws vertical separator lines for each day (including weekends if enabled) and highlights the beginning of new trading weeks with double lines for better clarity. This makes it easier to analyze price action within daily and weekly contexts. Who Is This Indicator For? Swing Traders   – Helps identify weekly opening gaps and key levels. Day Traders   – Vis
FREE
This is a well-known ZigZag indicator. But it differs by the fact that its plot is based on values of the middle line which is set by a user. It can display Andrews’ Pitchfork and standard or Bobokus Fibo levels. NO REPAINTING. Parameters Period МА — middle line period. Default value is 34. Minimum value is 4. Maximum value is set at your discretion. Used to calculate price — type of price used for the midline calculations. The averaging method — type of smoothing for the middle line. Turning p
Sequential Lock Fibo (v19) For sensitivity:Default is level is 80/20 make 65/35,65/40 Sequential Lock Fibo is a precision trend-trading tool designed for the MetaTrader 5 platform. It solves the two most common problems in Fibonacci trading: "repainting" (signals that disappear) and "freezing" (missing re-entry opportunities in long trends). This indicator combines a strict Trend Filter , a mechanical Setup Identifier , and a unique Sequential Logic engine to provide high-probability, non-repain
Introduction Harmonic Patterns are best used to predict potential turning point. Traditionally, Harmonic Pattern was identified manually connecting peaks and troughs points in the chart. Manual harmonic pattern detection is painfully tedious and not suitable for everyone. You are often exposed under subjective pattern identification with manual pattern detection. To avoid these limitations, Harmonic Pattern Plus was designed to automate your harmonic pattern detection process. The functionality
A ready-made trading system based on automatic plotting and tracking of Fibonacci levels for buying and selling any symbol on any timeframe. Advantages Determines the trend direction (14 indicators) Displays the trend strength and the values of indicators comprising the trend direction Plotting horizontal levels, support and resistance lines, channels Selection of the Fibonacci levels calculation type (6 different methods) Alert system On-screen Email Push notifications Buttons Changing the co
The utility draws pivot levels for the selected timefram in classic method. Pivot = (high + close + low) / 3 R1 = ( 2 * Pivot) - low S1 = ( 2 * Pivot) - high R2 = Pivot + ( high - low ) R3 = high + ( 2 * (Pivot - low)) S2 = Pivot - (high - low) S3 = low - ( 2 * (high - Pivot)) you can change the timeframe, colors and fontsize. also you can change the text for the levels. Have fun and give feedback...
FREE
If you like this product, please give it a  5 star rating as a token of appreciation. This indicator calculates and draws pivot points and support/resistance levels for both daily and weekly timeframes: Pivot (central) level Support levels S1, S2, S3 Resistance levels R1, R2, R3 It allows showing daily, weekly, or both sets of pivots , giving traders visual references for potential support/resistance areas. Pivot mode: Choose which pivots to display (weekly, daily, or both). Colors and style: C
FREE
NEXA Pivot Rebound Basic 1. Panoramica NEXA Pivot Rebound Basic è un Expert Advisor progettato per identificare possibili inversioni di prezzo in prossimità dei livelli Pivot giornalieri (S1 e R1). Il sistema funziona sulla piattaforma MetaTrader 5 ed è ottimizzato per il timeframe M15. I livelli Pivot giornalieri vengono calcolati sulla base del massimo, minimo e prezzo di chiusura del giorno precedente. Tali livelli sono combinati con gli indicatori RSI e Stochastic per generare segnali di ing
Introduction to X3 Chart Pattern Scanner X3 Cherart Pattern Scanner is the non-repainting and non-lagging indicator detecting X3 chart patterns including Harmonic pattern, Elliott Wave pattern, X3 patterns, and Japanese Candlestick patterns. Historical patterns match with signal patterns. Hence, you can readily develop the solid trading strategy in your chart. More importantly, this superb pattern scanner can detect the optimal pattern of its kind. In addition, you can switch on and off individu
Fibonacci sequence is defined by integer sequence: 0, 1, 1, 2, 3, 5, 8, 13, 21, 34, 55, 89, 144, ... By definition, it starts from 0 and 1, the next number is calculated as a sum of two previous numbers. Instead of the standard moving average, the indicator uses the following calculation of average price: Bar0 + Bar1 + Bar2 + Bar3 + Bar5 + Bar8 + Bar13 + Bar21 + ... This indicator shows 2 moving Fibonacci lines and arrows when 2 these lines crossing each other. If an Aqua line is crossing a Yell
Historical Pivot Zones - Fibonacci Indicator MT5 Automatically draws Fibonacci retracement and projection zones based on historical price pivots. This MT5 indicator intelligently selects pivot points from different timeframes (weekly, monthly, or 6-month ranges) and creates visual Fibonacci zones around key levels. Features include: Smart Mode Selection - Auto-adjusts based on your chart timeframe Clean Visual Zones - Highlighted areas instead of just lines Essential Fib Levels - 9 retrace
Read Elliott wave principle automatically. With the Swing Reader, you can easily read the Elliott Wave Principle through an automatic system. With swing, we mean a ZigZag market that is created by a breakout of its standard deviation. You can set the deviation manually, or you can let the indicator do it automatically (setting the deviation to zero). Advantages you get Never repaints. Points showing a horizontal line, in which statistically a long wave ends. Candles showing a vertical line in w
Cybertrade Auto Fibonacci
Emanuel Andriato
4.9 (10)
Cybertrade Auto Fibonacci retraction and projection  - MT5 Auto Fibonacci is an indicator that automatically plots the Fibonacci retracement and projection based on the number of bars you select in the indicator setting. You can customize nine different levels of retraction and three levels of projection. It works on periods longer than the period visible on the chart. All values ​​are available in the form of buffers to simplify possible automations. This indicator is the same one we use in ou
FREE
The Swing High Low and Fibonacci Retracement Indicator is a powerful technical analysis tool designed to identify key price levels and potential reversal zones in the market. It automatically detects recent swing highs and swing lows on the chart and overlays Fibonacci retracement levels based on these points. This indicator helps traders: Visualize market structure by highlighting recent swing points. Identify support and resistance zones using Fibonacci ratios (e.g., 38.2%, 50%, 61.8%). Adapt
Fibonacci Auto Levels Pro MT5 – Ritracciamenti, Estensioni e Punti Pivot (Pivot Points) Fibonacci Auto Levels Pro MT5 è uno strumento avanzato di analisi tecnica che rileva automaticamente i punti di swing del mercato e disegna strutture complete di Ritracciamento (Retracement), Estensione (Extension) e Punti Pivot (Pivot Point) di Fibonacci sul grafico. Questo indicatore combina diversi sistemi indipendenti in un unico strumento analitico unificato: Punti Pivot (Modalità Fibonacci) I Punti Pivo
Volumatic VIDyA MT5
Duc Hoan Nguyen
5 (2)
Special offer : ALL TOOLS , just $35 each! New tools   will be   $30   for the   first week   or the   first 3 purchases !  Trading Tools Channel on MQL5 : Join my MQL5 channel to update the latest news from me Volumatic VIDYA (Variable Index Dynamic Average) è un indicatore avanzato progettato per monitorare le tendenze e analizzare la pressione di acquisto e vendita in ogni fase di una tendenza. Utilizzando il Variable Index Dynamic Average come tecnica principale di smorzamento dinamico, que
Questo indicatore ti consente di mostrare le etichette dei livelli di Fibonacci con caratteri di grandi dimensioni . Supporta fino a 25 livelli di Fibonacci - Non appena disegni Fibonacci mostra i livelli che hai aggiunto come parametro di input con caratteri di grandi dimensioni con il colore e il carattere che scegli. Opzioni personalizzabili: 1. Carattere testo Fibo 2. Dimensioni del testo Fibo 3. Colore del testo Fibo 3. Aggiungi una descrizione a ciascun livello 4. Altre opzioni com
Versione MT4: https://www.mql5.com/en/market/product/90395 Versione MT5: https://www.mql5.com/en/market/product/99545 Ti presentiamo l'Expert Advisor (EA) "No Marti No Party": l'epitome delle strategie di trading aggressive. Questo EA non è per i deboli di cuore, poiché funziona secondo un principio ad alto rischio e alta ricompensa che può portare a guadagni sostanziali o perdite significative. Il nome dice tutto: la strategia Martingale è al centro di questo EA. È progettato per raddoppiar
MERAVITH SCANNER è un indicatore professionale per i mercati finanziari su MetaTrader 5, che integra più strumenti di analisi in un unico sistema. Esegue tutti i calcoli automaticamente utilizzando una metodologia proprietaria basata sul prezzo medio ponderato per il volume (VWAP), eliminando completamente l’interpretazione soggettiva. L’indicatore funziona su tutte le classi di asset (Forex, Azioni, Indici, Commodities, Criptovalute) e su tutti i timeframe, da M1 a Mensile. Il principio fondame
Pattern Trader No Repaint Indicator MT5 Version Indicator searches for 123 Pattern, 1234 Pattern, Double Top, Double Bottom Patterns , Head and Shoulders, Inverse Head and Shoulders, ZigZag 1.618 and Father Bat Pattern. Pattern Trader indicator uses Zig Zag Indicator and Improved Fractals to determine the patterns. Targets and Stop Loss Levels are defined by Fibonacci calculations.  Those levels must be taken as a recommendation. The trader may use different tools like Moving Avarages,
Gli utenti di questo prodotto hanno anche acquistato
SuperScalp Pro
Van Minh Nguyen
5 (9)
SuperScalp Pro – Sistema avanzato di indicatore per scalping con filtri multipli SuperScalp Pro è un sistema avanzato di indicatore per scalping che combina il classico Supertrend con molteplici filtri di conferma intelligenti. L’indicatore funziona in modo efficiente su tutti i timeframe da M1 a H4 ed è particolarmente adatto per XAUUSD, BTCUSD e le principali coppie Forex. Può essere utilizzato come sistema stand-alone o integrato in modo flessibile nelle strategie di trading esistenti. L’indi
Se acquisti questo indicatore, riceverai il mio Trade Manager Professionale + EA  GRATUITAMENTE. Innanzitutto è importante sottolineare che questo sistema di trading è un indicatore Non-Repainting, Non-Redrawing e Non-Lagging, il che lo rende ideale sia per il trading manuale che per quello automatico. Corso online, manuale e download di preset. Il "Sistema di Trading Smart Trend MT5" è una soluzione completa pensata sia per i trader principianti che per quelli esperti. Combina oltre 10 indicat
FX Trend MT5 NG
Daniel Stein
5 (4)
FX Trend NG: La Nuova Generazione di Intelligenza di Trend Multi-Mercato Panoramica FX Trend NG è uno strumento professionale di analisi del trend multi-timeframe e monitoraggio dei mercati. Ti consente di comprendere la struttura completa del mercato in pochi secondi. Invece di passare tra numerosi grafici, puoi identificare immediatamente quali strumenti sono in trend, dove il momentum sta diminuendo e dove esiste un forte allineamento tra i timeframe. Offerta di Lancio – Ottieni FX Trend NG
Market Flow Pro
Gabriele Sabatino
4 (1)
Market Flow Pro Market Flow Pro is an intelligent trading advisor for the MetaTrader 5 platform, designed for automatic trading on financial markets using algorithmic analysis and strict risk management. -Key features: - Fully automatic trading 24/5 - Adaptive trend and momentum entry algorithm -  Built-in risk management - Flexible lot settings (fixed/auto-calculation) - Support for major currency pairs and indices - Optimised for operation on various timeframes  How it works Market
Divergence Bomber
Ihor Otkydach
4.89 (83)
Ogni acquirente dell’indicatore riceverà inoltre gratuitamente: L’utilità esclusiva “Bomber Utility”, che gestisce automaticamente ogni operazione, imposta i livelli di Stop Loss e Take Profit e chiude le posizioni secondo le regole della strategia I file di configurazione (set file) per adattare l’indicatore a diversi asset I set file per configurare il Bomber Utility in tre modalità: “Rischio Minimo”, “Rischio Bilanciato” e “Strategia di Attesa” Una guida video passo-passo per installare, conf
Entry In The Zone and SMC Multi Timeframe is a real-time market analysis tool developed based on Smart Money Concepts (SMC). It is designed to analyze market structure, price direction, reversal points, and key zones across multiple timeframes in a systematic way. The system displays Points of Interest (POI) and real-time No Repaint signals, with instant alerts when price reaches key zones or when signals occur within those zones. It functions as both an Indicator and a Signal System (2-in-1), c
ARICoins
Temirlan Kdyrkhan
ARICoin is a powerful trading companion designed to generate high-probability entry signals with dynamic TP/SL/DP levels based on volatility. Built-in performance tracking shows win/loss stats, PP1/PP2 hits, and success rates all updated live. Key Features: Buy/Sell signals with adaptive volatility bands Real-time TP/SL/DP levels based on ATR Built-in MA Filter with optional ATR/StdDev volatility Performance stats panel (Success, Profit/Loss, PP1/PP2) Alerts via popup, sound, push, or email Cust
Grabber System MT5
Ihor Otkydach
4.82 (22)
Ti presento un eccellente indicatore tecnico: Grabber, che funziona come una strategia di trading "tutto incluso", pronta all’uso. In un solo codice sono integrati strumenti potenti per l’analisi tecnica del mercato, segnali di trading (frecce), funzioni di allerta e notifiche push. Ogni acquirente di questo indicatore riceve anche gratuitamente: L’utility Grabber: per la gestione automatica degli ordini aperti Video tutorial passo dopo passo: per imparare a installare, configurare e utilizzare
Atomic Analyst MT5
Issam Kassas
4.03 (30)
Innanzitutto, vale la pena sottolineare che questo indicatore di trading non è repaint, non è ridisegno e non presenta ritardi, il che lo rende ideale sia per il trading manuale che per quello automatico. Manuale utente: impostazioni, input e strategia. L'Analista Atomico è un indicatore di azione del prezzo PA che utilizza la forza e il momentum del prezzo per trovare un miglior vantaggio sul mercato. Dotato di filtri avanzati che aiutano a rimuovere rumori e segnali falsi, e aumentare il pote
Quantum TrendPulse
Bogdan Ion Puscasu
5 (22)
Ecco   Quantum TrendPulse   , lo strumento di trading definitivo che combina la potenza di   SuperTrend   ,   RSI   e   Stocastico   in un unico indicatore completo per massimizzare il tuo potenziale di trading. Progettato per i trader che cercano precisione ed efficienza, questo indicatore ti aiuta a identificare con sicurezza le tendenze di mercato, i cambiamenti di momentum e i punti di entrata e uscita ottimali. Caratteristiche principali: Integrazione SuperTrend:   segui facilmente l'andame
AriX
Temirlan Kdyrkhan
1 (4)
AriX Indicator for MT5 A powerful trend-following and signal-evaluation tool AriX is a custom MT5 indicator that combines Moving Averages and ATR-based risk/reward logic to generate clear buy/sell signals. It visualizes dynamic SL/TP levels, evaluates past trade outcomes, and displays win/loss statistics in a clean on-chart panel. Key features include: Buy/Sell signals based on MA crossovers ATR-based SL/TP1/TP2/TP3 levels with visual lines and labels Signal outcome tracking with real-time stat
Game Changer è un indicatore di tendenza rivoluzionario, progettato per essere utilizzato su qualsiasi strumento finanziario, per trasformare il tuo MetaTrader in un potente analizzatore di trend. Funziona su qualsiasi intervallo temporale e aiuta a identificare i trend, segnala potenziali inversioni, funge da meccanismo di trailing stop e fornisce avvisi in tempo reale per risposte tempestive del mercato. Che tu sia un professionista esperto o un principiante in cerca di un vantaggio, questo st
Top indicator for MT5   providing accurate signals to enter a trade without repainting! It can be applied to any financial assets:   forex, cryptocurrencies, metals, stocks, indices .  Watch  the video  (6:22) with an example of processing only one signal that paid off the indicator! MT4 version is here It will provide pretty accurate trading signals and tell you when it's best to open a trade and close it. Most traders improve their trading results during the first trading week with the help of
RFI levels PRO MT5
Roman Podpora
3.67 (3)
L'indicatore mostra accuratamente i punti di inversione e le zone di ritorno dei prezzi in cui il       Principali attori   . Vedi dove si formano le nuove tendenze e prendi decisioni con la massima precisione, mantenendo il controllo su ogni operazione. VERSION MT4     -    Rivela il suo massimo potenziale se combinato con l'indicatore   TREND LINES PRO Cosa mostra l'indicatore: Strutture di inversione e livelli di inversione con attivazione all'inizio di un nuovo trend. Visualizzazione dei li
Trend Screener Pro MT5
STE S.S.COMPANY
4.84 (101)
Indicatore di tendenza, soluzione unica rivoluzionaria per il trading di tendenze e il filtraggio con tutte le importanti funzionalità di tendenza integrate in un unico strumento! È un indicatore multi-timeframe e multi-valuta al 100% non ridipingibile che può essere utilizzato su tutti i simboli/strumenti: forex, materie prime, criptovalute, indici e azioni. Trend Screener è un indicatore di tendenza che segue un indicatore efficiente che fornisce segnali di tendenza a freccia con punti nel gra
Trend Lines PRO MT5
Roman Podpora
5 (1)
LINEE DI TENDENZA PRO  Aiuta a capire dove il mercato sta realmente cambiando direzione. L'indicatore mostra reali inversioni di tendenza e punti in cui i principali operatori rientrano. Vedi   Linee BOS   Cambiamenti di tendenza e livelli chiave su timeframe più ampi, senza impostazioni complesse o rumore inutile. I segnali non vengono ridisegnati e rimangono sul grafico dopo la chiusura della barra. VERSIONE MT4   -   Svela il suo massimo potenziale se abbinato all'indicatore   RFI LEVELS PRO
Order Block Pro MT5
N'da Lemissa Kouame
Order Block Pro (MQL5) – Versione 1.0 Autore: KOUAME N'DA LEMISSA Piattaforma: MetaTrader 5 Descrizione: Order Block Pro è un indicatore avanzato progettato per rilevare automaticamente Order Block rialzisti e ribassisti sul tuo grafico. Analizzando candele di consolidamento seguite da candele impulsive forti, l’indicatore evidenzia le aree chiave dove il prezzo è destinato a muoversi rapidamente. Ideale per trader che vogliono: Identificare punti di ingresso e uscita precisi. Rilevare zone din
FX Power MT5 NG
Daniel Stein
5 (31)
FX Power: Analizza la Forza delle Valute per Decisioni di Trading Più Intelligenti Panoramica FX Power è lo strumento essenziale per comprendere la reale forza delle principali valute e dell'oro in qualsiasi condizione di mercato. Identificando le valute forti da comprare e quelle deboli da vendere, FX Power semplifica le decisioni di trading e rivela opportunità ad alta probabilità. Che tu segua le tendenze o anticipi inversioni utilizzando valori estremi di Delta, questo strumento si adatta
ARIPoint
Temirlan Kdyrkhan
ARIPoint is a powerful trading companion designed to generate high-probability entry signals with dynamic TP/SL/DP levels based on volatility. Built-in performance tracking shows win/loss stats, PP1/PP2 hits, and success rates all updated live. Key Features: Buy/Sell signals with adaptive volatility bands Real-time TP/SL/DP levels based on ATR Built-in MA Filter with optional ATR/StdDev volatility Performance stats panel (Success, Profit/Loss, PP1/PP2) Alerts via popup, sound, push, or email Cu
Azimuth Pro
Ottaviano De Cicco
5 (4)
LAUNCH PROMO Azimuth Pro price is initially set at 299$ for the first 100 buyers. Final price will be 499$ . THE DIFFERENCE BETWEEN RETAIL AND INSTITUTIONAL ENTRIES ISN'T THE INDICATOR — IT'S THE LOCATION. Most traders enter at arbitrary price levels, chasing momentum or reacting to lagging signals. Institutions wait for price to reach structured levels where supply and demand actually shift. Azimuth Pro maps these levels automatically: swing-anchored VWAP, multi-timeframe structure lines, an
Presentazione       Quantum Breakout PRO   , l'innovativo indicatore MQL5 che sta trasformando il modo in cui scambi le zone di breakout! Sviluppato da un team di trader esperti con un'esperienza di trading di oltre 13 anni,       Quantum Breakout PRO       è progettato per spingere il tuo viaggio di trading a nuovi livelli con la sua strategia innovativa e dinamica della zona di breakout. Quantum Breakout Indicator ti fornirà frecce di segnalazione sulle zone di breakout con 5 zone target di
RelicusRoad Pro: Sistema Operativo Quantitativo di Mercato 70% DI SCONTO ACCESSO A VITA (TEMPO LIMITATO) - UNISCITI A 2.000+ TRADER Perché la maggior parte dei trader fallisce anche con indicatori "perfetti"? Perché operano su Singoli Concetti isolati. Un segnale senza contesto è una scommessa. Per vincere serve CONFLUENZA . RelicusRoad Pro non è un semplice indicatore. È un Ecosistema Quantitativo completo . Mappa la "Fair Value Road", distinguendo tra rumore e rotture strutturali. Smetti di in
Trend indicator AI mt5
Ramil Minniakhmetov
5 (15)
Trend Ai indicator è un ottimo strumento che migliorerà l'analisi di mercato di un trader combinando l'identificazione della tendenza con punti di ingresso utilizzabili e avvisi di inversione. Questo indicatore consente agli utenti di navigare nelle complessità del mercato forex con fiducia e precisione Oltre ai segnali primari, l'indicatore Ai di tendenza identifica i punti di ingresso secondari che si presentano durante i pullback o i ritracciamenti, consentendo ai trader di capitalizzare le
Trend Hunter MT5
Andrey Tatarinov
5 (3)
Trend Hunter è un indicatore di tendenza per lavorare nei mercati Forex, criptovaluta e CFD. Una caratteristica speciale dell'indicatore è che segue con sicurezza la tendenza, senza cambiare il segnale quando il prezzo supera leggermente la linea di tendenza. L'indicatore non viene ridisegnato; un segnale per entrare nel mercato appare dopo la chiusura della barra. Quando ci si sposta lungo un trend, l'indicatore mostra ulteriori punti di ingresso nella direzione del trend. Sulla base di quest
Ultimate SMC Indicator
Hicham Mahmoud Almoustafa
1 (1)
Ultimate SMC PRO – Smart Money Concepts Indicator (Order Blocks, FVG, Liquidity, BOS) for MetaTrader 5 Ultimate SMC PRO is a professional trading indicator designed to visualize Smart Money Concepts directly on the chart. The indicator combines several institutional trading tools in one system to help traders identify potential high-probability trading zones. The indicator analyzes market structure, liquidity behavior and price imbalance to highlight areas where institutional activity may occu
Algo Pumping
Ihor Otkydach
4.76 (21)
PUMPING STATION – La tua strategia personale "all inclusive" Ti presentiamo PUMPING STATION — un indicatore Forex rivoluzionario che trasformerà il tuo modo di fare trading in un’esperienza efficace ed entusiasmante. Non si tratta solo di un assistente, ma di un vero e proprio sistema di trading completo con potenti algoritmi che ti aiuteranno a operare in modo più stabile. Acquistando questo prodotto, riceverai GRATUITAMENTE: File di configurazione esclusivi: per un'impostazione automatica e pr
Dark Absolute Trend MT5
Marco Solito
4.69 (13)
Dark Absolute Trend   is an Indicator for intraday trading. This Indicator is based on   Trend Following  strategy but use also candlestick patterns and Volatility. We can enter in good price with this Indicator, in order to follow the main trend on the current instrument. It is advised to use low spread ECN brokers. This Indicator does   Not repaint   and   N ot lag . Recommended timeframes are M5, M15 and H1. Recommended working pairs: All. I nstallation and  Update Guide   -  Troubleshooting
Support And Resistance Screener è in un indicatore di livello per MetaTrader che fornisce più strumenti all'interno di un indicatore. Gli strumenti disponibili sono: 1. Screener della struttura del mercato. 2. Zona di ritiro rialzista. 3. Zona di ritiro ribassista. 4. Punti pivot giornalieri 5. Punti pivot settimanali 6. Punti pivot mensili 7. Forte supporto e resistenza basati sul modello e sul volume armonici. 8. Zone a livello di banca. OFFERTA A TEMPO LIMITATO: il supporto HV e l'indicatore
Candle Smart Range
Gianny Alexander Lugo Sanchez
Candle Smart Range (CSR) per MetaTrader 5 Candle Smart Range è un indicatore tecnico progettato per l'identificazione automatica dei range di prezzo su più timeframe. Questo strumento analizza la struttura del mercato basandosi sulle formazioni delle candele e sull'interazione del prezzo con i massimi e i minimi precedenti. Caratteristiche principali: Rilevamento Range: Identifica le zone di consolidamento prima dei movimenti impulsivi. Identificazione Falsi Breakout: Segnala quando il prezzo su
La soluzione migliore per ogni principiante o trader esperto! Questo indicatore è uno strumento di trading unico, di alta qualità e conveniente perché abbiamo incorporato una serie di caratteristiche proprietarie e una nuova formula. Con un solo grafico è possibile leggere la forza delle valute per 28 coppie Forex! Immaginate come migliorerà il vostro trading perché sarete in grado di individuare l'esatto punto di innesco di una nuova tendenza o di un'opportunità di scalping? Manuale d'uso:  
Filtro:
Nessuna recensione
Rispondi alla recensione