TwapvVwap

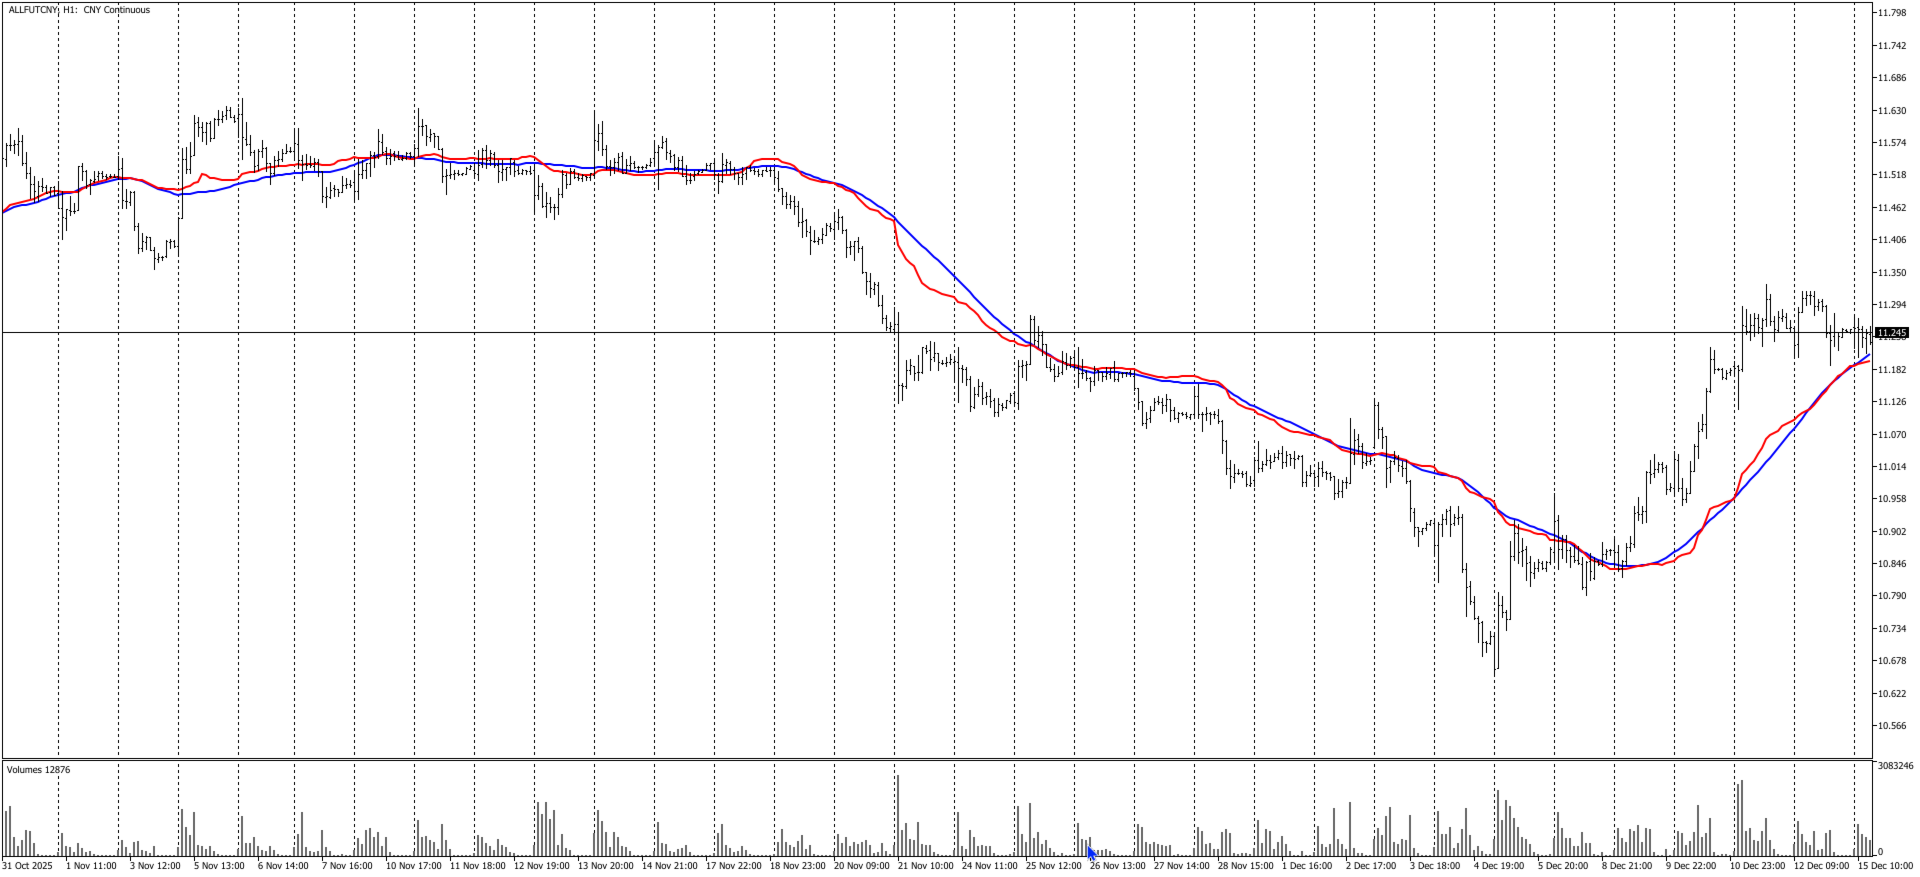
TWAP/VWAP Indicator - a professional technical analysis tool that displays two important moving averages on the chart:

  1. TWAP (Time Weighted Average Price) - calculated as a simple arithmetic average of closing prices over the specified period.

  2. VWAP (Volume Weighted Average Price) - calculated using the typical price (high+low+close)/3 weighted by trading volume.

Key Features:

  • Dual indicator in one window

  • Adjustable calculation period

  • Clear visualization (blue line - TWAP, red line - VWAP)

  • Efficient calculation algorithm with minimal system load

Parameters:

  • PeriodBars (50) - number of bars for calculating averages

Applications:

  • Determining average market price over a period

  • Identifying support/resistance levels

  • Analyzing supply/demand balance

  • Confirming trend movements


Prodotti consigliati
Il Tenet Support & Resistance Pro è un indicatore avanzato per MetaTrader 5, progettato per aiutare i trader a identificare con precisione le principali aree di supporto e resistenza del mercato. Basandosi sulla cronologia dei prezzi, l'indicatore traccia automaticamente linee orizzontali che evidenziano zone strategiche. Inoltre, evidenzia in tempo reale l'area attuale in cui la candela viene negoziata , fornendo una visione chiara delle aree critiche di decisione. Una caratteristica esclusi
FREE
Smetti di cercare manualmente i fair value gap. Institutional Imbalance Scanner è uno strumento di analisi altamente ottimizzato che identifica le inefficienze di mercato (squilibri) con precisione istituzionale, senza rallentare il tuo MetaTrader. Perché questo indicatore? La maggior parte degli indicatori FVG sovraccaricano il tuo grafico con dati obsoleti e consumano preziosa potenza della CPU. Il nostro scanner utilizza un algoritmo di aggiornamento intelligente che calcola solo i cambiamen
FREE
VFI Quantum
Nikita Berdnikov
5 (1)
Introducing VFI (Volume Flow Indicator) – a trading indicator that analyzes the relationship between volume and price movement to identify key trading opportunities. The indicator displays the strength and direction of volume flow, providing clear signals about potential entry and exit points. Signals are formed based on zero line crossovers, crossovers between the VFI line and its exponential moving average (EMA), and when the indicator exits overbought and oversold zones. Attention! This stra
FREE
Zigzag Price Arrows
Aiman Saeed Salem Dahbag
The Zigzag Price Arrow indicator is an enhanced version of the classic Zigzag indicator, combining the traditional zigzag pattern with advanced visual features. It not only identifies major market turning points but also provides clear trading signals through: • Directional arrows: Displays colored arrows (green for buy, magenta for sell) indicating potential trend directions. • Price labels: Shows the exact price values at each pivot point directly on the chart. • Improved visual clarity: Make
FREE
Free automatic Fibonacci is an indicator that automatically plots a Fibonacci retracement based on the number of bars you select on the BarsToScan setting in the indicator. The Fibonacci is automatically updated in real time as new highest and lowest values appears amongst the selected bars. You can select which level values to be displayed in the indicator settings. You can also select the color of the levels thus enabling the trader to be able to attach the indicator several times with differe
FREE
Reversal Composite Candles
MetaQuotes Ltd.
3.67 (15)
The idea of the system is to indentify the reversal patterns using the calculation of the composite candle. The reversal patterns is similar to the "Hammer" and "Hanging Man" patterns in Japanese candlestick analysis. But it uses the composite candle instead the single candle and doesn't need the small body of the composite candle to confirm the reversal. Input parameters: Range - maximal number of bars, used in the calculation of the composite candle. Minimum - minimal size of the composite can
FREE
Dynamic Supply and Demand indicator automatically identifies and displays Supply and Demand Zones on your chart based on price action patterns and market structure.  These zones represent areas where institutional buying or selling pressure has historically occurred, making them key levels for potential price reactions. This form of indicator takes inspiration from ICT as well as traditional Support & Resistance formation. **For the first 50 candles (number depends on LookBackCandles) when indic
FREE
Bounce Zone MT5
Nguyen Thanh Cong
4.56 (9)
Introduction The Bounce Zone indicator is a cutting-edge non-repainting technical tool built to identify key areas on the price chart where market sentiment is likely to cause a significant price reversal. Using advanced algorithms and historical price data analysis, this indicator pinpoints potential bounce zones. Combined with other entry signal, this indicator can help forex traders place the best trades possible Signal A possible buy signal is generated when price is in the green zone an
FREE
The "Support Resistance Dynamic" indicator is a powerful technical analysis tool for the MetaTrader 5 platform, designed to automatically identify and plot dynamic Support and Resistance zones on price charts. This indicator helps traders easily recognize important price levels, potential reversal points, or breakout areas, thereby enabling more informed trading decisions. 2. Key Features Dynamic S/R Identification : Automatically identifies support and resistance zones based on an advanced Pivo
FREE
PZ Penta O MT5
PZ TRADING SLU
3.5 (4)
The Penta-O is a 6-point retracement harmonacci pattern which usually precedes big market movements. Penta-O patterns can expand and repaint quite a bit. To make things easier this indicator implements a twist: it waits for a donchian breakout in the right direction before signaling the trade. The end result is an otherwise repainting indicator with a very reliable trading signal. The donchian breakout period is entered as an input. [ Installation Guide | Update Guide | Troubleshooting | FAQ | A
FREE
RSI abcd
Francisco Gomes Da Silva
3 (1)
RSI ABCD Pattern Finder: Strategia Tecnica 1. Come Funziona l'Indicatore Combina il RSI classico con il rilevamento automatico di pattern armonici ABCD . Componenti Principali RSI standard (periodo regolabile) Marcatori di massimi e minimi (frecce) Pattern ABCD (linee verdi/rosse) Filtri ipercomprato (70) e ipervenduto (30) 2. Configurazione su MT5 period = 14 ; // Periodo RSI size = 4 ; // Dimensione massima del pattern OverBought = 70 ; // Livello ipercomprato OverSold = 30 ; // Livello iperve
FREE
Coral Indi
Dinh Duong Luong
Coral trend is   a trend-following indicator that is widely popular among FOREX traders . It is usually used as a confluence with other indicators. It uses combinations of moving averages with complex smoothing formulas! It has two configurable parameters: Coefficient   - smoothing ratio (*) Applied price Calculation: Coral = (-0.064) * B6 + 0.672 * B5 - 2.352 * B4 + 2.744 * B3
FREE
Donchian Pro
Paulo Henrique Faquineli Garcia
5 (3)
The Donchian Channel Channels are among the most popular tools of technical analysis, as they visually convey to the analyst the limits within which most price movement tends to occur. Channel users know that valuable information can be obtained at any time, whether prices are in the central region of a band or close to one of the border lines. One of the best known techniques to explore these concepts is Bollinger Bands. However, John Bollinger was not the only one to research the application
FREE
SuperTrend Indicator – Description & Important Notice The SuperTrend is a composite technical indicator designed to help you identify the primary trend, measure its strength, and assess signal quality. However, an indicator is only a tool —it’s never 100% accurate and cannot replace sound risk management. 1. Core Formula & Components ATR (Average True Range): measures price volatility; customize sensitivity via Periods and Multiplier . Upper/Lower Bands: derived from ATR and your chosen source p
FREE
Unlock Consistent Results with the MACD Indicator Across Multiple Markets Experience the power of our advanced MACD indicator, designed to deliver reliable buy and sell signals on a wide range of trading pairs and timeframes. Whether you trade forex, stocks, or cryptocurrencies, our indicator adapts seamlessly to your strategy. Multi-Chart Compatibility: The MACD indicator works effortlessly across various currency pairs, stocks, and assets, providing clear entry and exit signals on every chart.
FREE
PZ Three Drives MT5
PZ TRADING SLU
2.83 (6)
This indicator finds Three Drives patterns. The Three Drives pattern is a 6-point reversal pattern characterised by a series of higher highs or lower lows that complete at a 127% or 161.8% Fibonacci extension. It signals that the market is exhausted and a reversal can happen. [ Installation Guide | Update Guide | Troubleshooting | FAQ | All Products ] Customizable pattern sizes Customizable colors and sizes Customizable breakout periods Customizable 1-2-3 and 0-A-B ratios It implements visual/s
FREE
Indicator and Expert Adviser  EA Available in the comments section of this product. Download with Indicator must have indicator installed for EA to work. Mt5 indicator alerts for bollinger band and envelope extremes occurring at the same time. Buy signal alerts occur when A bullish candle has formed below both the lower bollinger band and the lower envelope  Bar must open and close below both these indicators. Sell signal occur when A bear bar is formed above the upper bollinger band and upper
FREE
Certainly! Let me introduce you to a powerful tool for MetaTrader 5 (MT5) that can automatically identify and draw support and resistance (S&R) levels on your trading charts. This tool is called the “Support and Resistance Levels Guru” . Support Resistance Levels Guru  The Support & Resistance Indicator automatically displays essential S&R levels on your chart. These levels are crucial for technical analysis and are used by many traders. Resistance levels (zones) are shown in R ed , while suppo
FREE
PZ Turtle Trading EA MT5
PZ TRADING SLU
2 (4)
This expert advisor implements the original Dennis and Eckhardt trading system, commonly known as The Turtle Trader. It trades exactly like the original turtles did, and can be used by experienced traders to capture trends in up or down markets. [ Installation Guide | Update Guide | Troubleshooting | FAQ | All Products ] Easy to use and supervise Fully configurable strategy settings Fully configurable trading settings Works for ECN/Non-ECN brokers and 2-3-4-5 digit symbols Works for CFDs and for
FREE
Necessary for traders: tools and indicators Waves automatically calculate indicators, channel trend trading Perfect trend-wave automatic calculation channel calculation , MT4 Perfect trend-wave automatic calculation channel calculation , MT5 Local Trading copying Easy And Fast Copy , MT4 Easy And Fast Copy , MT5 Local Trading copying For DEMO Easy And Fast Copy , MT4 DEMO Easy And Fast Copy , MT5 DEMO The homeopathic indicator is also called the CCI indicator. The CCI indicator was proposed
FREE
LT Force
Thiago Duarte
5 (5)
For those who like trend the Force will be a very useful indicator. This is because it is based on the famouse ADX, which measure the strenght of a trend, but without its 3 confusing lines. Force has its very simple interpretation: if the histogram is above zero level the trend is up, otherwise it is down. You can use it to find divergences too, which is very profitable. Thanks to Andre Sens for the version 1.1 idea. If you have any doubt or suggestion, please, contact me. Enjoy! MT4 version: 
FREE
Easy Correlations Indicator The Easy Correlations Indicator is designed to help traders analyze the relationship between two correlated instruments. By monitoring the distance between their Relative Strength Index (RSI) values, the indicator highlights situations where one instrument has moved significantly further than the other. This creates potential trading opportunities: Sell the stronger instrument (overstretched RSI) Buy the weaker instrument (lagging RSI) Because the positions are opened
FREE
Virtual Targets MT5
Hoang Van Dien
4.63 (8)
This indicator is very useful for day traders or short term traders. (MT5 version) No need to calculate the number of pips manually, just look at the chart and you will see the Virtual Take Profit / Virtual Stop Loss target line and evaluate whether the entry point is feasible to reach the intended target or not. Enter the intended   Take Profit / Stop Loss   pips for your trade. The indicator will display   Virtual Take Profit / Virtual Stop Loss   lines for you to easily see if the target is
FREE
Follow The Line MT5
Oliver Gideon Amofa Appiah
4.6 (35)
This indicator obeys the popular maxim that: "THE TREND IS YOUR FRIEND" It paints a GREEN line for BUY and also paints a RED line for SELL. (you can change the colors). It gives alarms and alerts of all kinds. IT DOES NOT REPAINT and can be used for all currency pairs and timeframes. Yes, as easy and simple as that. Even a newbie can use it to make great and reliable trades. NB: For best results, get my other premium indicators for more powerful and reliable signals. Get them here: https://www.m
FREE
MACD Enhanced
Nikita Berdnikov
5 (3)
Introducing the MACD  Enhanced – an advanced MACD (Moving Average Convergence Divergence) indicator that provides traders with extended capabilities for trend and momentum analysis in financial markets. The indicator uses the difference between the fast and slow exponential moving averages to determine momentum, direction, and strength of the trend, creating clear visual signals for potential entry and exit points. Attention! To achieve the best results, it is recommended to adapt the indicator
FREE
Market Shift and FVG MT5
Cruz Molina William Alberto
Market Structure Shift with FVG Indicator for MT5 This MT5 indicator from the   apexfintech.net   suite identifies market structure shifts and fair value gaps (FVGs) to provide traders with potential trading opportunities. It alerts users on these events via mobile notifications, enabling them to react quickly to changing market conditions. Key Features: Market Structure Shift Detection:   Identifies bullish and bearish market structure shifts based on swing high/low breaks and significant candl
FREE
Daily Support and Resistance Levels è un indicatore professionale che calcola e mostra automaticamente i livelli chiave di prezzo per il trading intraday basato sui Punti Pivot classici. Caratteristiche: Calcolo automatico Pivot (PP) 3 resistenze (R1–R3) 3 supporti (S1–S3) Massimo/Minimo del giorno precedente Pannello informativo in tempo reale Bias di mercato (Rialzista/Ribassista) Distanza ai livelli più vicini Colori e stile personalizzabili Aggiornamento automatico giornaliero Funziona su tu
FREE
Realized Volatility Indicator Description The Realized Volatility Indicator measures the actual volatility observed in the market over a specified period. Unlike implied volatility (which is based on options pricing), realized volatility is based directly on historical price movements, offering a pure and objective view of market turbulence. This indicator can be used to: Assess market conditions, Optimize risk management, Fine-tune trading strategies based on volatility behavior. Key Features
FREE
Babel Assistant
Iurii Bazhanov
4.33 (9)
Babel assistant 1     The MT5 netting “Babel_assistant_1” robot uses the ZigZag indicator to generate Fibonacci levels on M1, M5, M15, H1, H4, D1, W1  periods of the charts , calculates the strength of trends for buying and selling. It opens a position with "Lot for open a position" if the specified trend level 4.925 is exceeded. Then Babel places pending orders at the some Fibonacci levels and places specified Stop Loss , Take Profit. The screen displays current results of work on the position
FREE
Gli utenti di questo prodotto hanno anche acquistato
SuperScalp Pro
Van Minh Nguyen
5 (2)
SuperScalp Pro – Sistema avanzato di indicatore per scalping con filtri multipli SuperScalp Pro è un sistema avanzato di indicatore per scalping che combina il classico Supertrend con molteplici filtri di conferma intelligenti. L’indicatore funziona in modo efficiente su tutti i timeframe da M1 a H4 ed è particolarmente adatto per XAUUSD, BTCUSD e le principali coppie Forex. Può essere utilizzato come sistema stand-alone o integrato in modo flessibile nelle strategie di trading esistenti. L’indi
Se acquisti questo indicatore, riceverai il mio Trade Manager Professionale + EA  GRATUITAMENTE. Innanzitutto è importante sottolineare che questo sistema di trading è un indicatore Non-Repainting, Non-Redrawing e Non-Lagging, il che lo rende ideale sia per il trading manuale che per quello automatico. Corso online, manuale e download di preset. Il "Sistema di Trading Smart Trend MT5" è una soluzione completa pensata sia per i trader principianti che per quelli esperti. Combina oltre 10 indicat
ARIPoint
Temirlan Kdyrkhan
ARIPoint is a powerful trading companion designed to generate high-probability entry signals with dynamic TP/SL/DP levels based on volatility. Built-in performance tracking shows win/loss stats, PP1/PP2 hits, and success rates all updated live. Key Features: Buy/Sell signals with adaptive volatility bands Real-time TP/SL/DP levels based on ATR Built-in MA Filter with optional ATR/StdDev volatility Performance stats panel (Success, Profit/Loss, PP1/PP2) Alerts via popup, sound, push, or email Cu
FX Trend MT5 NG
Daniel Stein
5 (1)
FX Trend NG: La Nuova Generazione di Intelligenza di Trend Multi-Mercato Panoramica FX Trend NG è uno strumento professionale di analisi del trend multi-timeframe e monitoraggio dei mercati. Ti consente di comprendere la struttura completa del mercato in pochi secondi. Invece di passare tra numerosi grafici, puoi identificare immediatamente quali strumenti sono in trend, dove il momentum sta diminuendo e dove esiste un forte allineamento tra i timeframe. Offerta di Lancio – Ottieni FX Trend NG
Azimuth Pro
Ottaviano De Cicco
5 (4)
LAUNCH PROMO Azimuth Pro price is initially set at 299$ for the first 100 buyers. Final price will be 499$ . THE DIFFERENCE BETWEEN RETAIL AND INSTITUTIONAL ENTRIES ISN'T THE INDICATOR — IT'S THE LOCATION. Most traders enter at arbitrary price levels, chasing momentum or reacting to lagging signals. Institutions wait for price to reach structured levels where supply and demand actually shift. Azimuth Pro maps these levels automatically: swing-anchored VWAP, multi-timeframe structure lines, an
Entry In The Zone and SMC Multi Timeframe is a real-time market analysis tool developed based on Smart Money Concepts (SMC). It is designed to analyze market structure, price direction, reversal points, and key zones across multiple timeframes in a systematic way. The system displays Points of Interest (POI) and real-time No Repaint signals, with instant alerts when price reaches key zones or when signals occur within those zones. It functions as both an Indicator and a Signal System (2-in-1), c
Divergence Bomber
Ihor Otkydach
4.89 (81)
Ogni acquirente dell’indicatore riceverà inoltre gratuitamente: L’utilità esclusiva “Bomber Utility”, che gestisce automaticamente ogni operazione, imposta i livelli di Stop Loss e Take Profit e chiude le posizioni secondo le regole della strategia I file di configurazione (set file) per adattare l’indicatore a diversi asset I set file per configurare il Bomber Utility in tre modalità: “Rischio Minimo”, “Rischio Bilanciato” e “Strategia di Attesa” Una guida video passo-passo per installare, conf
Game Changer è un indicatore di tendenza rivoluzionario, progettato per essere utilizzato su qualsiasi strumento finanziario, per trasformare il tuo MetaTrader in un potente analizzatore di trend. Funziona su qualsiasi intervallo temporale e aiuta a identificare i trend, segnala potenziali inversioni, funge da meccanismo di trailing stop e fornisce avvisi in tempo reale per risposte tempestive del mercato. Che tu sia un professionista esperto o un principiante in cerca di un vantaggio, questo st
Power Candles MT5
Daniel Stein
5 (6)
Power Candles – Segnali di ingresso basati sulla forza per tutti i mercati Power Candles porta l’analisi di forza collaudata di Stein Investments direttamente sul grafico dei prezzi. Invece di reagire solo al prezzo, ogni candela viene colorata in base alla reale forza di mercato, consentendo di identificare immediatamente accumuli di momentum, accelerazioni della forza e transizioni di trend pulite. Un’unica logica per tutti i mercati Power Candles funziona automaticamente su tutti i simboli di
FX Power MT5 NG
Daniel Stein
5 (31)
FX Power: Analizza la Forza delle Valute per Decisioni di Trading Più Intelligenti Panoramica FX Power è lo strumento essenziale per comprendere la reale forza delle principali valute e dell'oro in qualsiasi condizione di mercato. Identificando le valute forti da comprare e quelle deboli da vendere, FX Power semplifica le decisioni di trading e rivela opportunità ad alta probabilità. Che tu segua le tendenze o anticipi inversioni utilizzando valori estremi di Delta, questo strumento si adatta
Atomic Analyst MT5
Issam Kassas
4.07 (28)
Innanzitutto, vale la pena sottolineare che questo indicatore di trading non è repaint, non è ridisegno e non presenta ritardi, il che lo rende ideale sia per il trading manuale che per quello automatico. Manuale utente: impostazioni, input e strategia. L'Analista Atomico è un indicatore di azione del prezzo PA che utilizza la forza e il momentum del prezzo per trovare un miglior vantaggio sul mercato. Dotato di filtri avanzati che aiutano a rimuovere rumori e segnali falsi, e aumentare il pote
Top indicator for MT5   providing accurate signals to enter a trade without repainting! It can be applied to any financial assets:   forex, cryptocurrencies, metals, stocks, indices .  Watch  the video  (6:22) with an example of processing only one signal that paid off the indicator! MT4 version is here It will provide pretty accurate trading signals and tell you when it's best to open a trade and close it. Most traders improve their trading results during the first trading week with the help of
Ogni giorno, molti trader affrontano una sfida comune: il prezzo sembra rompere un livello chiave, entrano in un'operazione, e poi il mercato si inverte, attivando il loro stop loss. Questo è noto come falsa rottura (false breakout) — un movimento di prezzo che supera brevemente un livello di supporto o resistenza prima di invertire la direzione. Questi movimenti possono causare l'attivazione degli stop loss prima che la direzione effettiva del prezzo diventi chiara. Nell'analisi tecnica, questo
Trend Screener Pro MT5
STE S.S.COMPANY
4.84 (100)
Indicatore di tendenza, soluzione unica rivoluzionaria per il trading di tendenze e il filtraggio con tutte le importanti funzionalità di tendenza integrate in un unico strumento! È un indicatore multi-timeframe e multi-valuta al 100% non ridipingibile che può essere utilizzato su tutti i simboli/strumenti: forex, materie prime, criptovalute, indici e azioni. Trend Screener è un indicatore di tendenza che segue un indicatore efficiente che fornisce segnali di tendenza a freccia con punti nel gra
L'indicatore " Dynamic Scalper System MT5 " è progettato per il metodo di scalping, ovvero per il trading all'interno di onde di trend. Testato sulle principali coppie di valute e sull'oro, è compatibile con altri strumenti di trading. Fornisce segnali per l'apertura di posizioni a breve termine lungo il trend, con ulteriore supporto al movimento dei prezzi. Il principio dell'indicatore. Le frecce grandi determinano la direzione del trend. Un algoritmo per generare segnali per lo scalping sott
L’indicatore evidenzia le zone in cui viene dichiarato interesse sul mercato , per poi mostrare la zona di accumulo degli ordini . Funziona come un book degli ordini su larga scala . Questo è l’indicatore per i grandi capitali . Le sue prestazioni sono eccezionali. Qualsiasi interesse ci sia nel mercato, lo vedrai chiaramente . (Questa è una versione completamente riscritta e automatizzata – non è più necessaria un’analisi manuale.) La velocità di transazione è un indicatore concettualmente nuo
Super Signal – Skyblade Edition Sistema professionale di segnali di tendenza senza repaint / senza ritardo con tasso di vincita eccezionale | Per MT4 / MT5 Funziona meglio su timeframe più bassi, come 1 minuto, 5 minuti e 15 minuti. Caratteristiche principali: Super Signal – Skyblade Edition è un sistema intelligente di segnali progettato specificamente per il trading di tendenza. Utilizza una logica di filtraggio multilivello per identificare esclusivamente i movimenti direzionali forti, supp
Grabber System MT5
Ihor Otkydach
4.82 (22)
Ti presento un eccellente indicatore tecnico: Grabber, che funziona come una strategia di trading "tutto incluso", pronta all’uso. In un solo codice sono integrati strumenti potenti per l’analisi tecnica del mercato, segnali di trading (frecce), funzioni di allerta e notifiche push. Ogni acquirente di questo indicatore riceve anche gratuitamente: L’utility Grabber: per la gestione automatica degli ordini aperti Video tutorial passo dopo passo: per imparare a installare, configurare e utilizzare
Smart Stop Indicator – Precisione intelligente dello stop-loss direttamente sul grafico Panoramica Smart Stop Indicator è la soluzione ideale per i trader che desiderano posizionare il loro stop-loss in modo chiaro e metodico, senza dover indovinare o affidarsi all’intuizione. Questo strumento combina la logica classica del price action (massimi e minimi strutturali) con un moderno riconoscimento dei breakout per identificare il prossimo livello di stop realmente logico. In trend, in range o i
Gold Entry Sniper
Tahir Mehmood
5 (3)
Gold Entry Sniper – Dashboard ATR Multi-Timeframe per Scalping e Swing Trading sull’Oro Gold Entry Sniper è un indicatore avanzato per MetaTrader 5 che offre segnali di acquisto/vendita precisi per XAUUSD e altri strumenti, basato sulla logica ATR Trailing Stop e l' analisi multi-timeframe . Caratteristiche e Vantaggi Analisi Multi-Timeframe – Visualizza trend su M1, M5, M15 in un'unica dashboard. Trailing Stop Basato su ATR – Stop dinamici che si adattano alla volatilità. Dashboard Professional
Quantum TrendPulse
Bogdan Ion Puscasu
5 (20)
Ecco   Quantum TrendPulse   , lo strumento di trading definitivo che combina la potenza di   SuperTrend   ,   RSI   e   Stocastico   in un unico indicatore completo per massimizzare il tuo potenziale di trading. Progettato per i trader che cercano precisione ed efficienza, questo indicatore ti aiuta a identificare con sicurezza le tendenze di mercato, i cambiamenti di momentum e i punti di entrata e uscita ottimali. Caratteristiche principali: Integrazione SuperTrend:   segui facilmente l'andame
Quantum Entry   è un potente sistema di trading basato sull'azione del prezzo, costruito su una delle strategie più popolari e conosciute tra i trader: la strategia di   Breakout ! Questo indicatore genera segnali di acquisto e vendita chiari e cristallini basati sulla rottura di aree chiave di supporto e resistenza. A differenza dei tipici indicatori di breakout, utilizza calcoli avanzati per confermare con precisione la rottura! Quando si verifica una rottura, ricevi avvisi immediati. Nessun r
FX Levels MT5
Daniel Stein
5 (13)
FX Levels: Supporti e Resistenze di Precisione Eccezionale per Tutti i Mercati Panoramica Rapida Cercate un modo affidabile per individuare livelli di supporto e resistenza in ogni mercato—coppie di valute, indici, azioni o materie prime? FX Levels fonde il metodo tradizionale “Lighthouse” con un approccio dinamico all’avanguardia, offrendo una precisione quasi universale. Basato sulla nostra esperienza reale con i broker e su aggiornamenti automatici giornalieri più quelli in tempo reale, FX
Bill Williams Advanced
Siarhei Vashchylka
5 (10)
Bill Williams Advanced is designed for automatic chart analysis using Bill Williams' "Profitunity" system. The indicator analyzes four timeframes at once. Manual (Be sure to read before purchasing) Advantages 1. Analyzes the chart using Bill Williams' "Profitunity" system. Signals are displayed in a table in the corner of the screen and on the price chart. 2. Finds all known AO and AC signals, as well as zone signals. Equipped with a trend filter based on the Alligator. 3. Finds "Divergence Bar
Support And Resistance Screener è in un indicatore di livello per MetaTrader che fornisce più strumenti all'interno di un indicatore. Gli strumenti disponibili sono: 1. Screener della struttura del mercato. 2. Zona di ritiro rialzista. 3. Zona di ritiro ribassista. 4. Punti pivot giornalieri 5. Punti pivot settimanali 6. Punti pivot mensili 7. Forte supporto e resistenza basati sul modello e sul volume armonici. 8. Zone a livello di banca. OFFERTA A TEMPO LIMITATO: il supporto HV e l'indicatore
Trend indicator AI mt5
Ramil Minniakhmetov
5 (15)
Trend Ai indicator è un ottimo strumento che migliorerà l'analisi di mercato di un trader combinando l'identificazione della tendenza con punti di ingresso utilizzabili e avvisi di inversione. Questo indicatore consente agli utenti di navigare nelle complessità del mercato forex con fiducia e precisione Oltre ai segnali primari, l'indicatore Ai di tendenza identifica i punti di ingresso secondari che si presentano durante i pullback o i ritracciamenti, consentendo ai trader di capitalizzare le
Questo cruscotto mostra gli ultimi   pattern armonici   disponibili per i simboli selezionati, in modo da risparmiare tempo ed essere più efficienti /   versione MT4 . Indicatore gratuito:   Basic Harmonic Pattern Colonne dell'indicatore Symbol :   vengono visualizzati i simboli selezionati Trend:   rialzista o ribassista Pattern:   tipo di pattern (gartley, butterfly, bat, crab, shark, cypher o ABCD) Entry:   prezzo di ingresso SL:   prezzo di stop loss TP1:   1 prezzo di take profit TP2:
Dark Support Resistance  is an Indicator for intraday trading. This Indicator is programmed to identify  Support and Resistance Lines , providing a high level of accuracy and reliability. Key benefits Easily visible lines Only the most important levels will be displayed Automated adjustment for each timeframe and instrument Easy to use even for beginners Never repaints, never backpaints, Not Lag 100% compatible with Expert Advisor development All types of alerts available: Pop-up, Email, Push
Innanzitutto, vale la pena sottolineare che questo Strumento di Trading è un Indicatore Non-Ridipingente, Non-Ridisegnante e Non-Laggante, il che lo rende ideale per il trading professionale. Corso online, manuale utente e demo. L'Indicatore Smart Price Action Concepts è uno strumento molto potente sia per i nuovi che per i trader esperti. Racchiude più di 20 utili indicatori in uno solo, combinando idee di trading avanzate come l'Analisi del Trader del Circolo Interno e le Strategie di Tradin
[ Il mio canale ] , [ I miei prodotti ] Il Lorentzian Distance Classifier è un indicatore di trading basato sul machine learning che utilizza la distanza di Lorentz come metrica principale all’interno del framework degli Approximate Nearest Neighbors (ANN). Invece di fare affidamento sulla tradizionale distanza euclidea, tratta l’azione dei prezzi finanziari come se avvenisse in uno spazio “distorto” prezzo-tempo (simile al modo in cui gli oggetti massicci curvano lo spazio-tempo nella relativit
Altri dall’autore
TrendChange
Dmitrii Skandalov
The "Price change from zero" indicator is designed to display price changes over a selected period in points.  1. The basic idea The indicator calculates the difference between the closing price on the current bar and the opening price on the bar set back by the Candle Period. The result is displayed as a line in a separate window. 2. Interpretation Positive value: The price has increased over the period. Negative value: The price decreased during the period. Zero value: The price has retur
FREE
Filtro:
Nessuna recensione
Rispondi alla recensione