ZScore Mean Reversion Indicator
- Indicatori
-
Diego Vinicius Righetti Sa
 About Frequência do Mercado
Knowledge, Research, and Technology for the Financial Market
Frequência do Mercado was born from a passion for understanding financial markets and transforming complex knowledge into content that is accessible, practical, and grounded in evidence. - Versione: 1.0
Z-Score Mean Reversion Indicator
INTRODUCTION
Financial markets are constantly shifting between periods of equilibrium and disequilibrium.
At certain moments, price can move significantly away from its normal behavior, creating conditions that deserve special attention.
The Z-Score Mean Reversion Indicator was developed to identify these situations objectively, transforming complex market movements into a clear reading of market imbalance.
Designed for traders who value quantitative analysis and data-driven decision making, the indicator offers a unique perspective on market behavior.
Every market experiences periods of normal behavior and periods of extreme behavior.
While most price movements occur within expected conditions, there are times when price reaches regions that represent unusual behavior compared to its recent history.
The Z-Score Mean Reversion Indicator was designed to monitor these shifts and highlight when the market is operating under balanced conditions or within statistically uncommon environments.
This approach allows traders to analyze market movements through a quantitative perspective while reducing the subjectivity often associated with visual chart analysis.
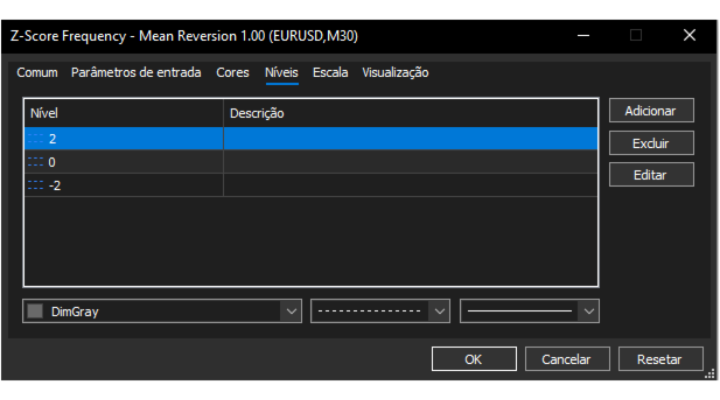
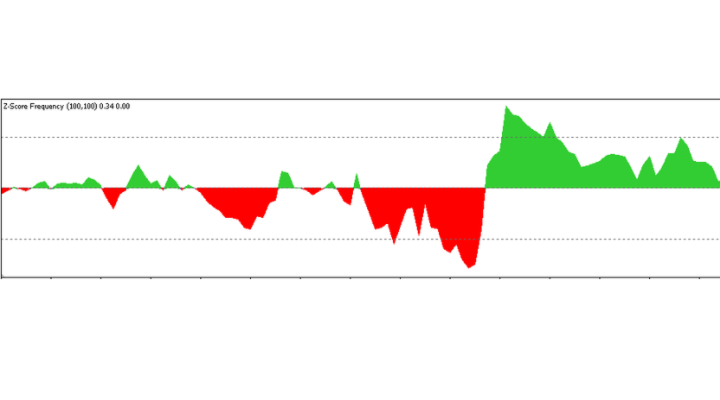
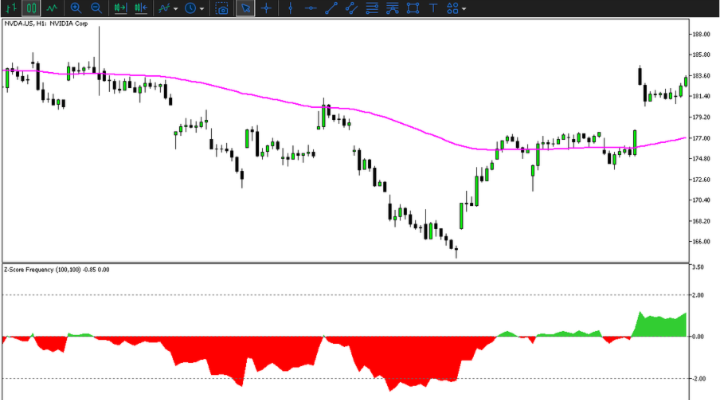
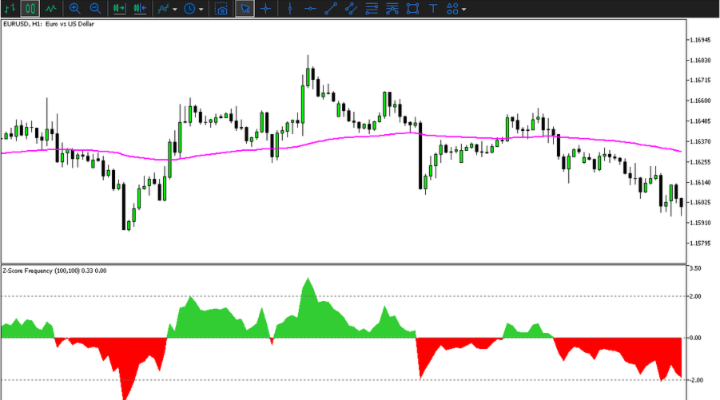
Values Between -2 and +2
Represent statistically normal conditions.
The market is operating within its expected behavioral range.
Values Above +2
Indicate a significant expansion condition.
Price is trading in an unusually extended region compared to its recent behavior.
Values Below -2
Indicate a significant compression condition.
Price is trading in an unusually extended region below its normal operating range.
The greater the reading, the greater the level of imbalance identified by the model.
- Objective identification of market extremes.
- Detection of statistically uncommon conditions.
- Standardized interpretation of market behavior.
- Automatic adaptation to changing volatility conditions.
- Applicable across multiple markets and timeframes.
- Supports quantitative and systematic trading approaches.
- Assists in identifying market imbalance zones.
- Ideal for mean reversion research and analysis.
- Reduces subjectivity in chart interpretation.
The indicator offers flexibility for different trading styles and market conditions.
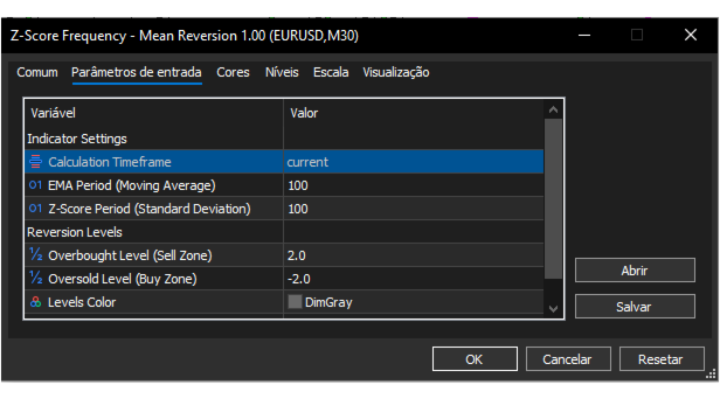
Key parameters can be adjusted by the user, allowing the model to adapt to the characteristics of specific assets, timeframes, and analytical approaches.
This flexibility makes the indicator suitable for both short-term trading and long-term quantitative market research.
- Quantitative Traders
- Mean Reversion Traders
- Systematic Traders
- Algorithmic Strategy Developers
- Market Researchers
- Technical Analysts
- Portfolio Managers and Statistical Model Enthusiasts
While most oscillators are designed to measure momentum, acceleration, or traditional overbought and oversold conditions, the Z-Score Mean Reversion Indicator takes a different approach.
Its primary objective is to identify and quantify market imbalance, providing an objective reading of the intensity behind market movements.
This perspective adds an additional layer of analysis that can complement both discretionary trading and advanced quantitative models.
CONCLUSION
Markets do not remain in equilibrium forever.
The Z-Score Mean Reversion Indicator was developed to help identify when that equilibrium is being challenged, transforming complex market behavior into a clear, objective, and consistent quantitative reading.
Transforming market imbalance into objective quantitative analysis.