Double Edge Forex Indicator
- Indicatori
-
Elias Mtwenge
 Elias Mtwenge is an Entrepreneur, Innovator and A philanthropist. He is a founder and CEO of Piptera Digital Solutions.
He is creative in nature and probably a genius of our generation! - Versione: 1.0
- Attivazioni: 5
“Master both sides of the market with precision and clarity.”
🗡️ Introduction
Welcome to the Double Edge Forex Indicator — your trading companion designed to simplify market analysis and amplify trading confidence. This tool empowers traders to visualize trend strength, direction, and reversal zones across multiple timeframes — all from one elegant chart panel.
Whether you’re a scalper, swing trader, or day trader, Double Edge helps you identify key market conditions at a glance — allowing you to act swiftly and accurately.
⚙️ Installation & Chart Setup
To ensure optimal performance, please follow these setup steps carefully:
-
Open Your Chart
-
Recommended: Use the Bar Chart view.
(Although candlesticks are supported, bar charts display cleaner signals.)
-
-
Add the Indicator
-
Load the Double Edge Forex Indicator from your indicator library.
-
Once applied, you’ll see the main layout consisting of:
-
🕓 Timeframe Panel (Top Section)
-
📦 Colored Signal Boxes (Main Section)
-
🏷️ Indicator Label (Bottom Section — “Double Edge Forex Indicator”)
-
-
-
Chart Colors
-
Use blue for bullish bars and red for bearish bars to maintain clarity.
-
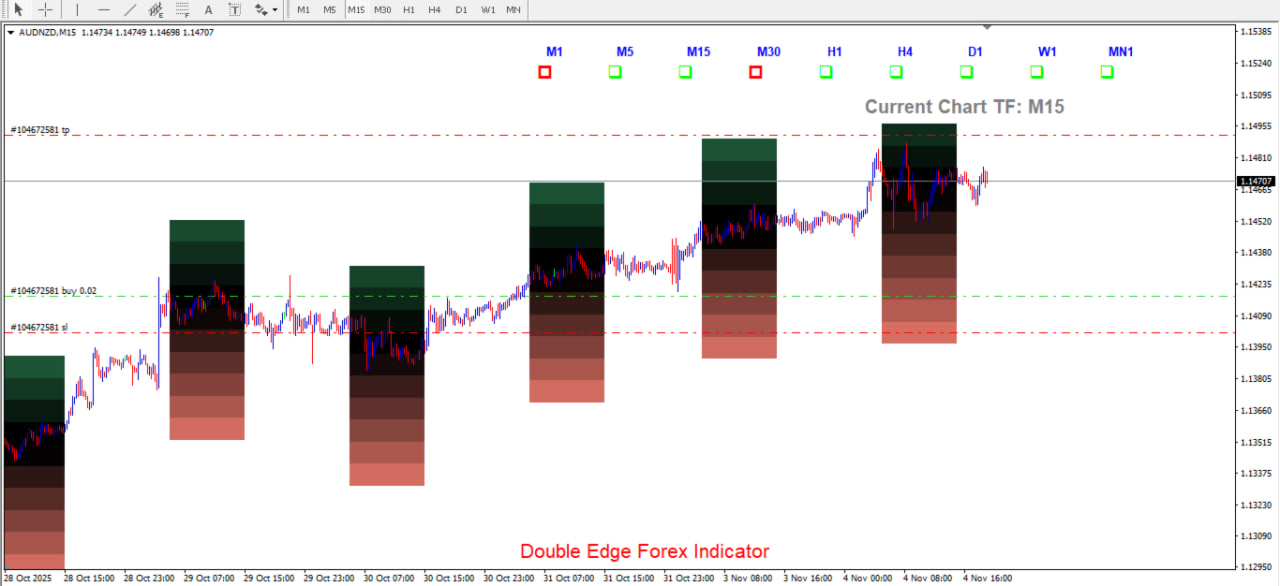
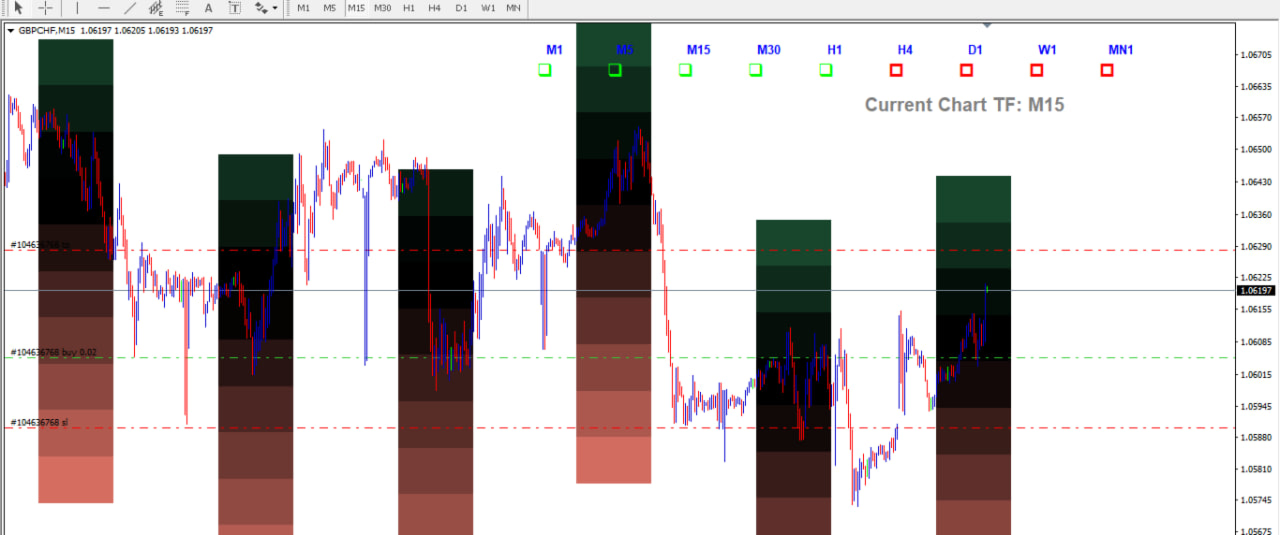
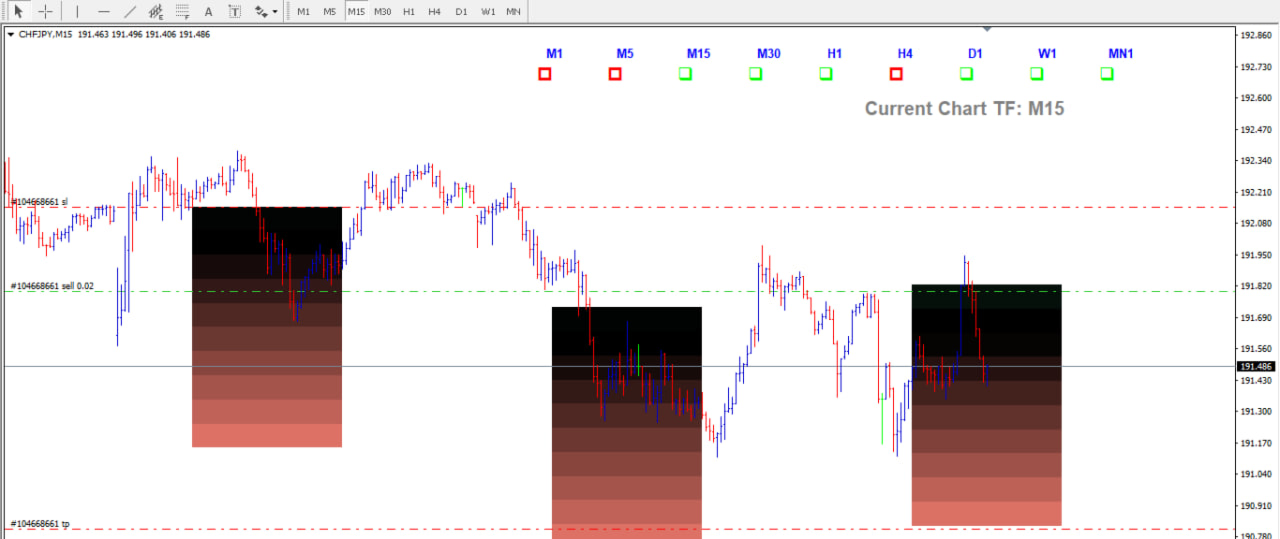
🧭 Understanding the Layout
1. Timeframe Panel
Located at the top, this panel displays signals across multiple periods:
M1 | M5 | M15 | M30 | H1 | H4 | D1 | W1 | MN
-
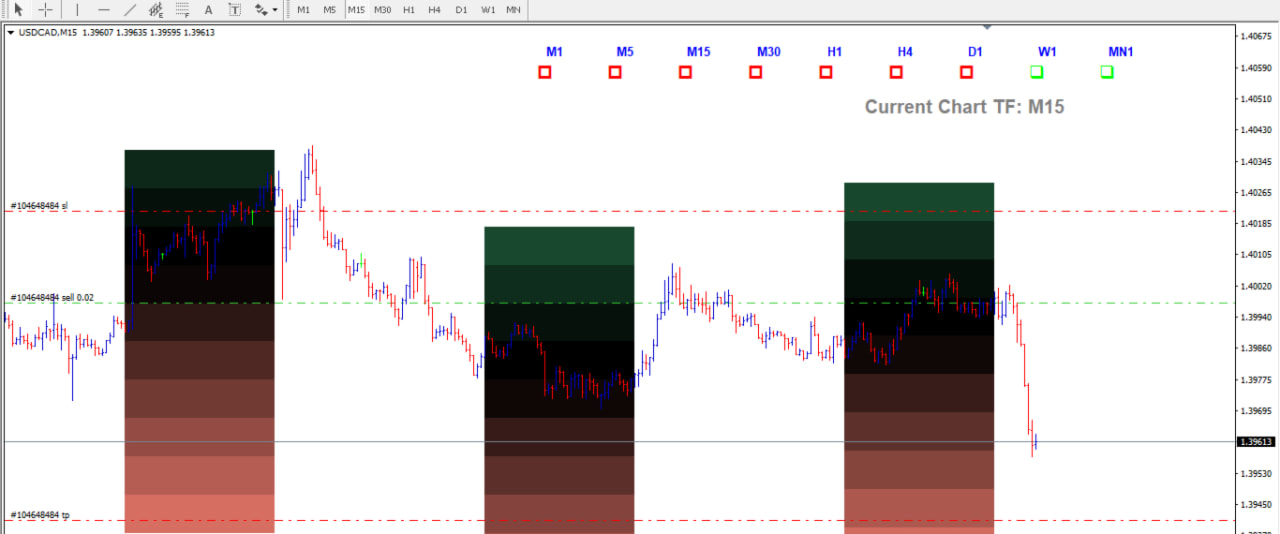
Each timeframe displays trend direction signals (lime for bullish, red for bearish).
-
A highlighted label shows your current working timeframe.
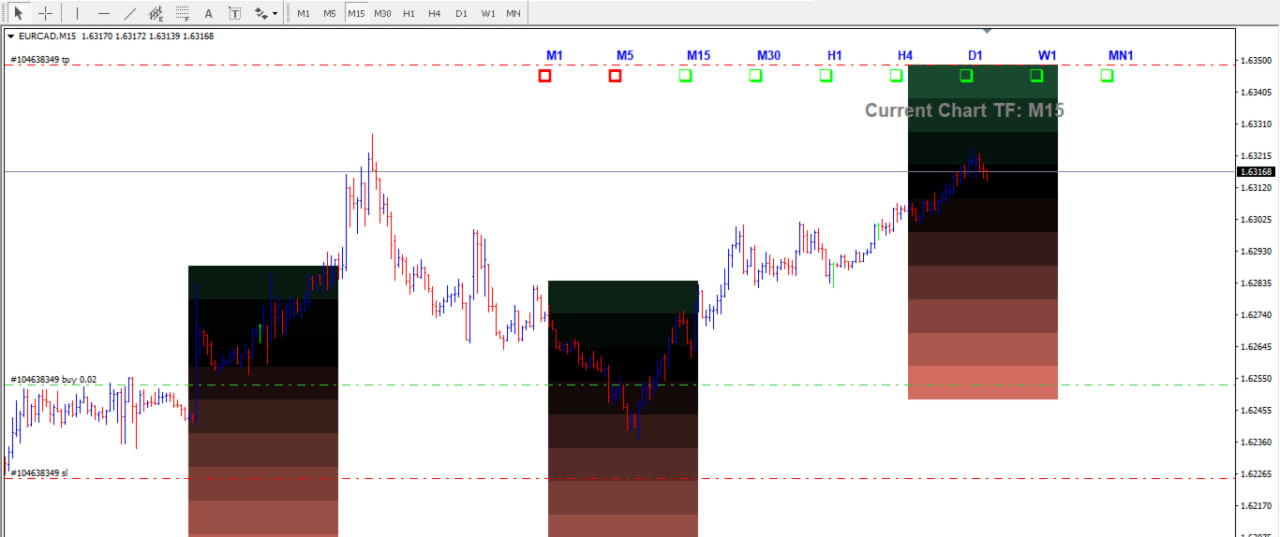
2. Color Boxes Section
These represent market activity zones, helping visualize potential breakout or reversal areas.
-
Black Zone: Neutral or breakout zone (central focus).
-
Upper/Lower Zones: Overbought and oversold regions for potential reversals.
3. Custom Visibility Options
Choose what to display:
-
Show only the Timeframe Panel
-
Show only the Color Boxes
-
Or show both (recommended)
💡 This flexibility lets you manage chart space efficiently, especially if using other tools.
⏱️ Recommended Timeframe
While the indicator works on all timeframes, the 15-minute chart (M15) provides the best clarity and signal accuracy, offering a balanced view of short-term and mid-term price behavior.
💡 Signal Colors & Meaning
-
Lime Arrow: Bullish trend or upward momentum
-
Red Arrow: Bearish trend or downward momentum
-
Black Zone: Key breakout or decision area
-
Dark Green Zone: Reversal or correction potential
These visual cues help traders identify when the market may be overbought, oversold, or preparing for a trend continuation.
📊 User Interaction & Preferences
The Double Edge Forex Indicator allows you to customize your visual experience:
-
✅ Toggle Timeframe Panel Visibility
-
✅ Toggle Signal Boxes Visibility
-
✅ Adjust Chart Colors
-
✅ Zoom in/out for clear zone analysis
Each trader has unique preferences — customize the layout that enhances your personal trading flow.
🧩 Basic Usage Steps
-
Select Your Chart & Load the Indicator
-
Confirm you are in Bar Chart mode.
-
-
Observe the Timeframe Panel
-
Identify whether the overall sentiment is bullish or bearish.
-
-
Locate the Black Zone
-
This acts as your main decision zone — where breakouts or reversals occur.
-
-
Monitor Zone Interaction
-
Price moving above or below the black zone indicates potential action areas.
-
-
Align with Trend
-
Always confirm entries in the direction of the major trend shown on higher timeframes.
-
🎯 Practical Tips
-
💼 Use higher timeframes (H1, H4, D1) to confirm your major trend.
-
🕒 Apply M15 for entries and M5/M1 for fine-tuning.
-
🧠 Watch for big momentum bars around the box zones — they often signal strength or reversals.
-
🔁 If price enters the box from the top, it may suggest a sell opportunity.
-
🔁 If price enters the box from the bottom, it may suggest a buy opportunity.
-
⚖️ Adjust your stop loss and take profit based on recent swing levels or box boundaries.
🧱 Example Workflow
-
Apply indicator → select M15 chart
-
Identify black zone → watch for breakout or rejection
-
Check timeframe panel → confirm majority trend
-
Enter trade → align with higher trend
-
Set stop loss → just outside the previous swing
-
Set take profit → near the opposite side of the black zone
Repeat the process consistently to build trading discipline.
🪄 Key Features Recap
-
Multi-timeframe trend dashboard
-
Real-time breakout and reversal zones
-
Color-coded clarity for quick analysis
-
Flexible visibility options
-
Works across all pairs and timeframes
-
Simple, intuitive, and trader-friendly interface
⚠️ Disclaimer
Disclaimer:
The Double Edge Forex Indicator is a technical analysis tool designed to assist traders in identifying market patterns. It does not guarantee profits or predict future market movements. Trading in the foreign exchange market involves significant risk and may result in the loss of your invested capital.Always use proper risk management, test strategies on demo accounts, and consult a financial advisor before live trading.
The creators of this indicator and this manual assume no responsibility for any trading losses incurred.
🏆 Final Note
The Double Edge Forex Indicator gives traders the edge to see both sides of the market — trend and reversal — with visual simplicity and power.
Take time to learn it, practice consistently, and you’ll soon experience the precision of trading with the Double Edge.
“Trade smart. Trade sharp. Trade with the Double Edge.”
Note: Please let me know incase you need any extra help related to this tool. Send a private message and I will be glad to help.