Multi Asset Technical Analysis Tool
- Indicatori
- Versione: 1.1
- Aggiornato: 10 ottobre 2025
- Attivazioni: 5

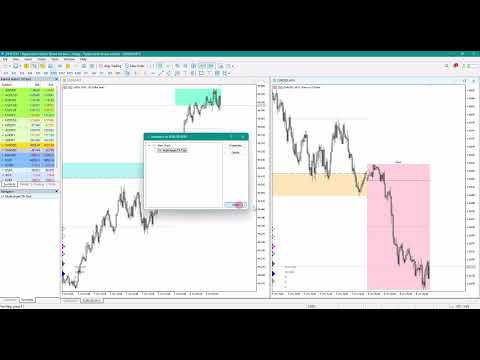
Multi-Asset Technical Analysis Tool: Better focus/analysis of the price chart in many timeframes and symbols [MTF/Correlation analysis ].
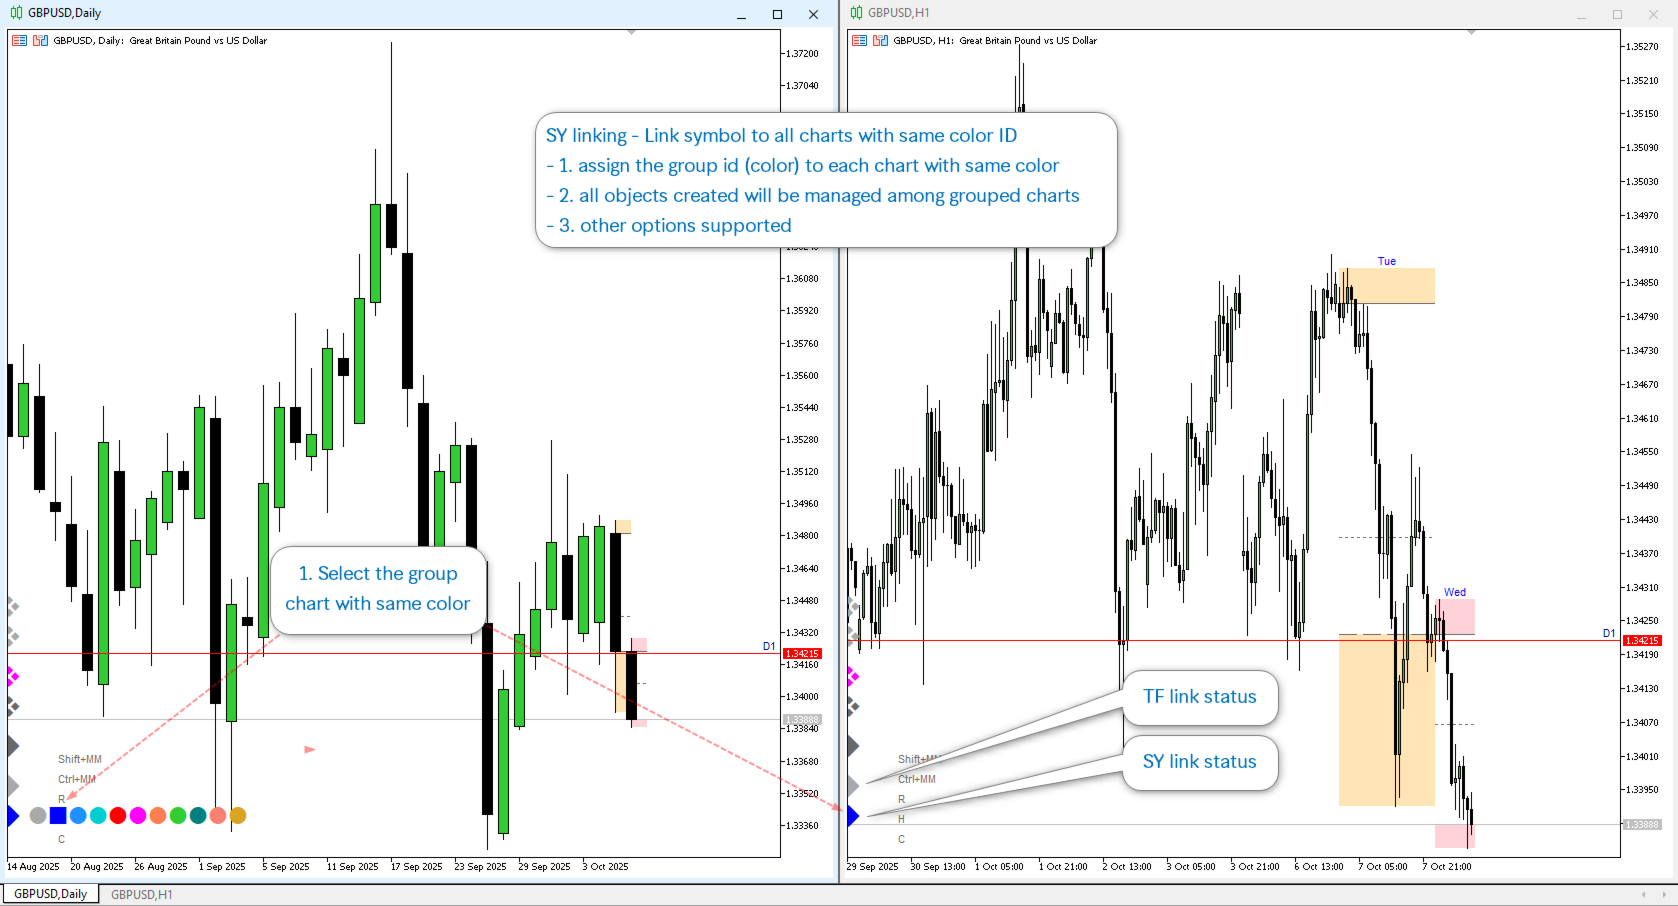
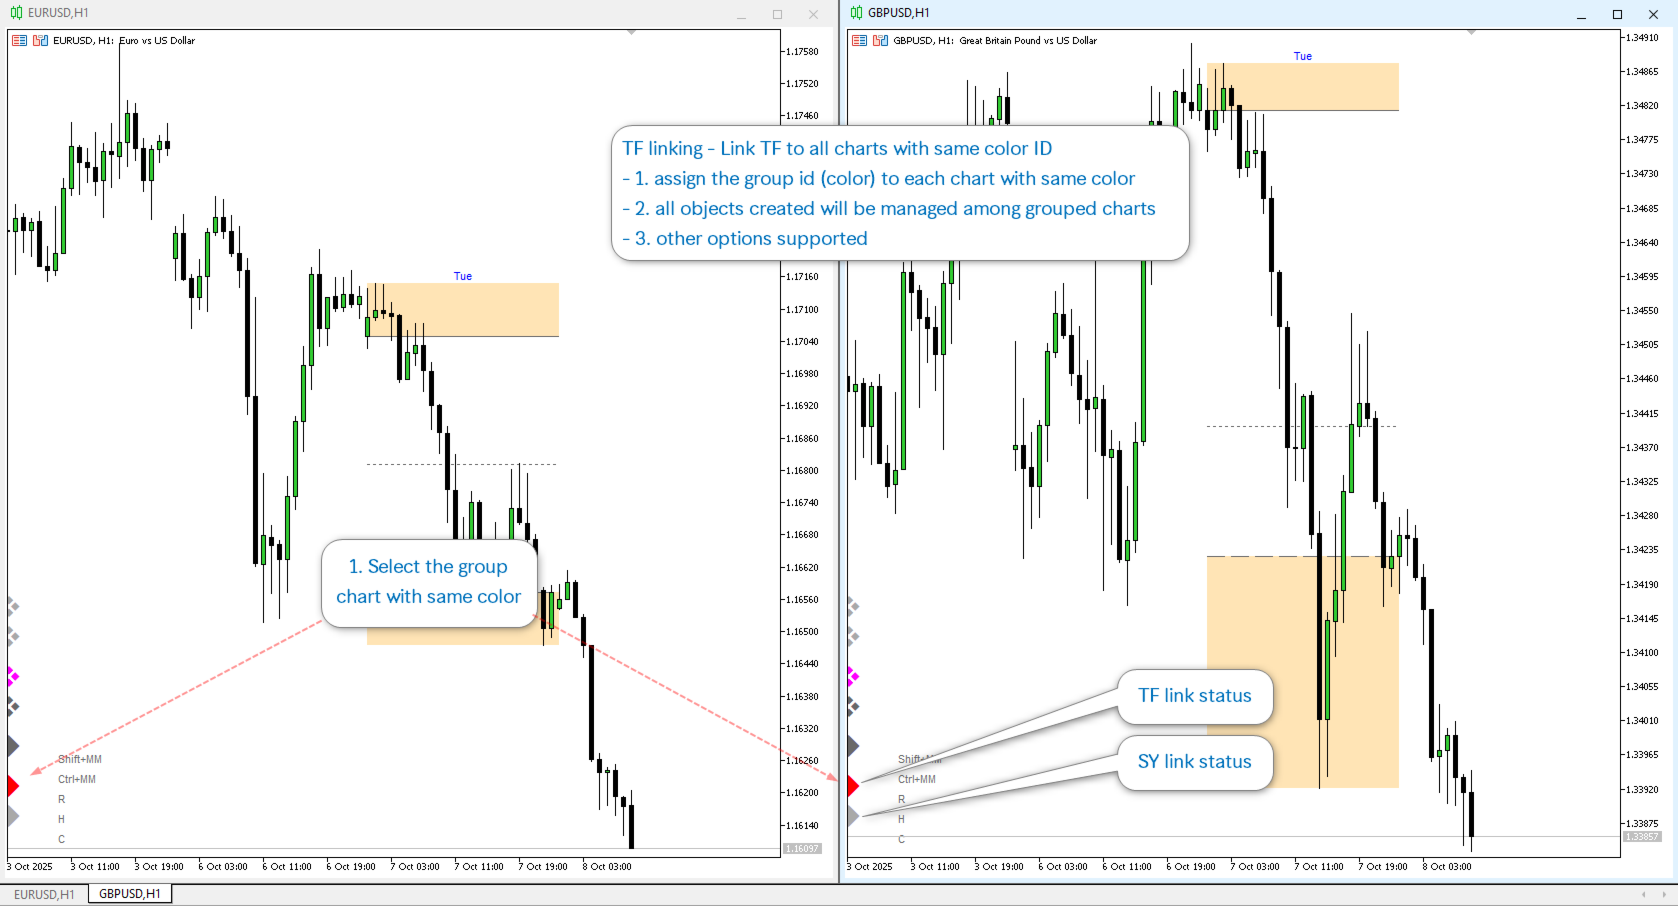
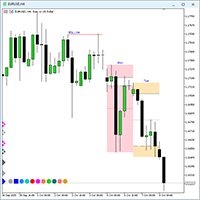
The Multi Asset Technical Analysis Tool indicator is designed for pure technical analysis based on standard Metatrader 5 objects (Rectangle, Trend line, Horizontal line, Vertical line, Fibonacci). You can manage objects among grouped charts (linked with Symbol or Period). You can manage objects in charts with same symbols/assets or even different symbols/assets. So, you can make technical analysis in many timeframes in charts with same symbols, or make correlation technical analysis among charts with different symbols (DXY-EURUSD/GBPUSD/AUDUSD, US500-US100-US30, EURJPY-GBPJPY, etc.).
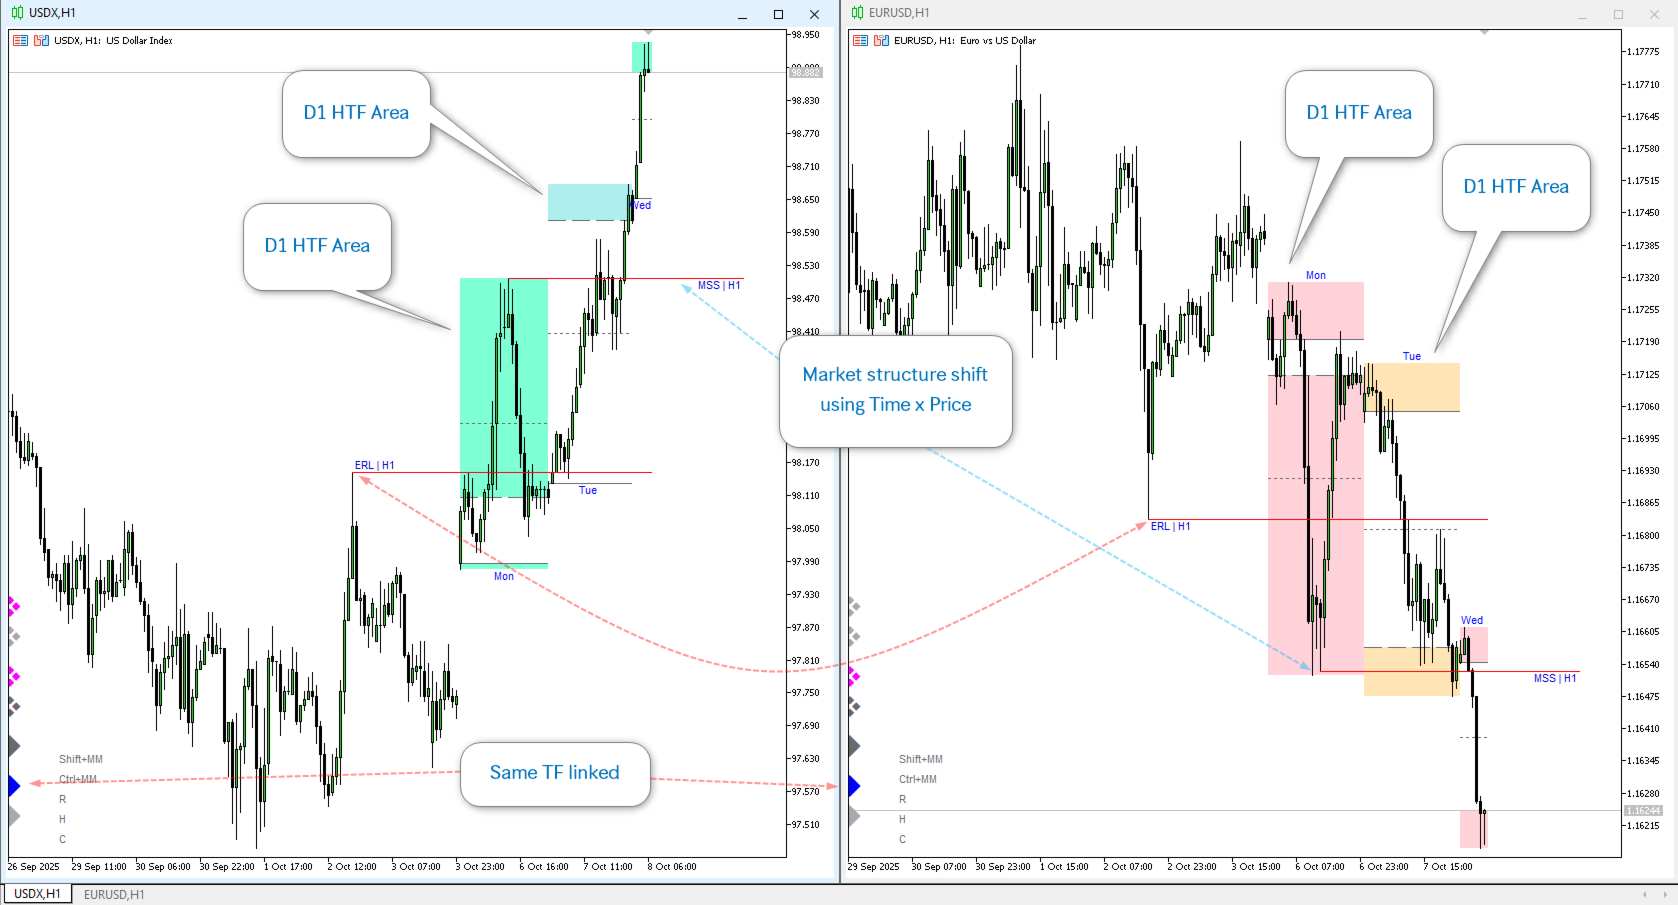
For different symbols, the indicator will create/manage the object with the calculation of Time and Price among different chart symbols.
With this indicator, you enjoy creating objects across many charts with same or differrent symbols, you can modify the same object in any chart, you can delete the same object in any chart. All objects you created/modified are always synchronized across all chart windows (with the same symbol or different symbol). Save your time, you can focus better on what you are looking for in many timeframes. No matter which your technical analysis is MTF analysis for many charts with same symbols or even asset/symbol correlation.
Supported objects: Horizontal line, Trendline, Vertical line, Rectangle, Fibonacci retracement, and chart objects.
Other features :
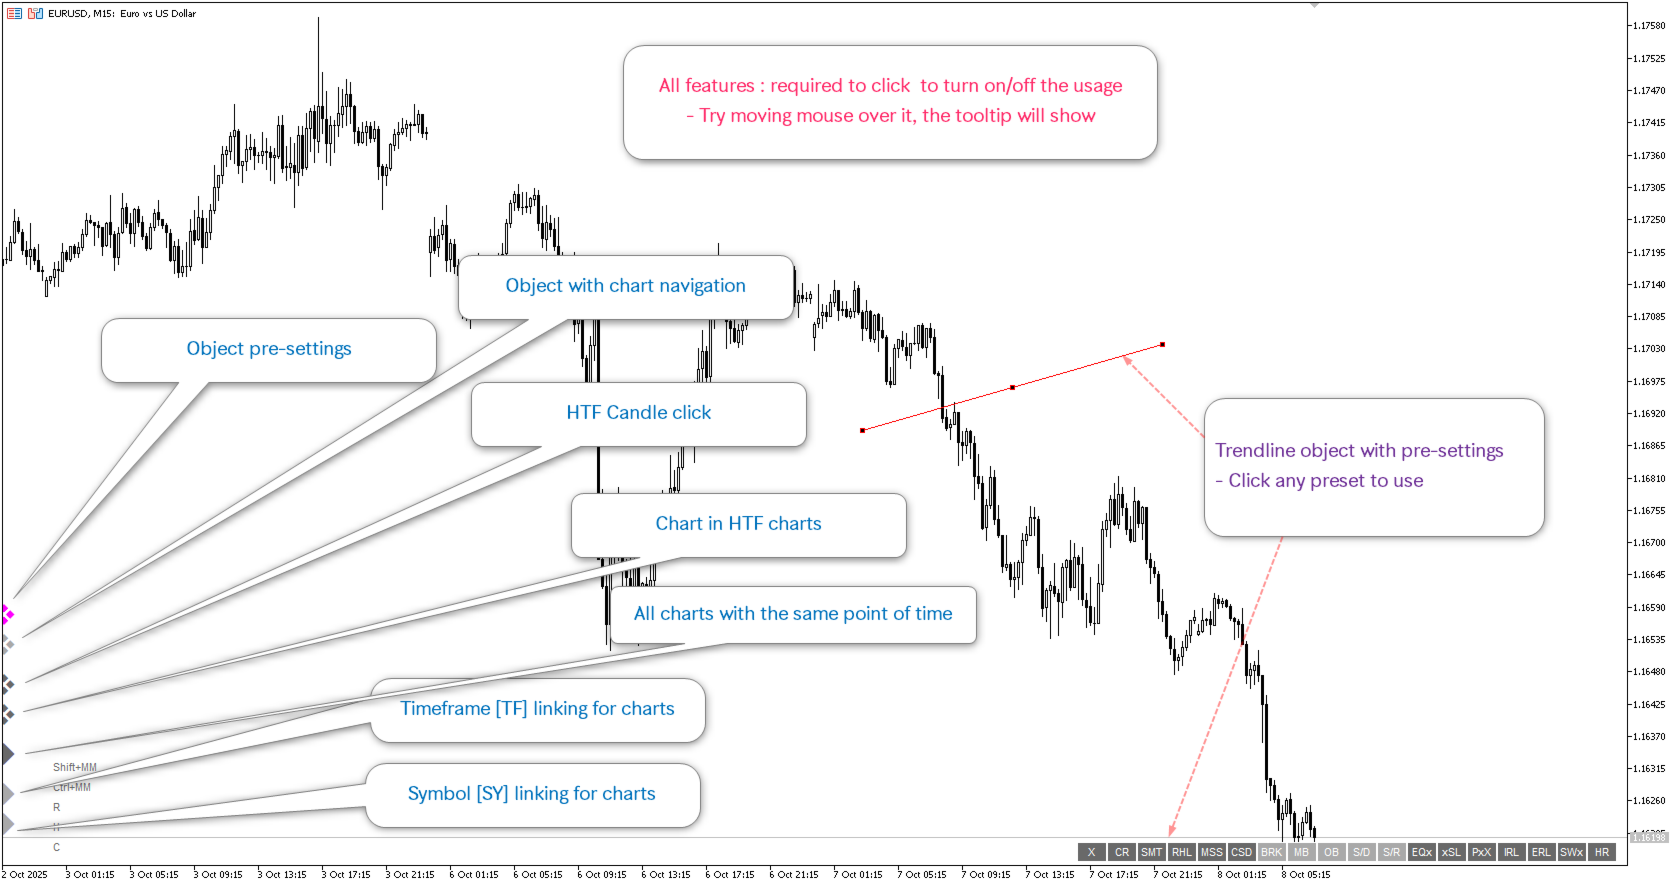
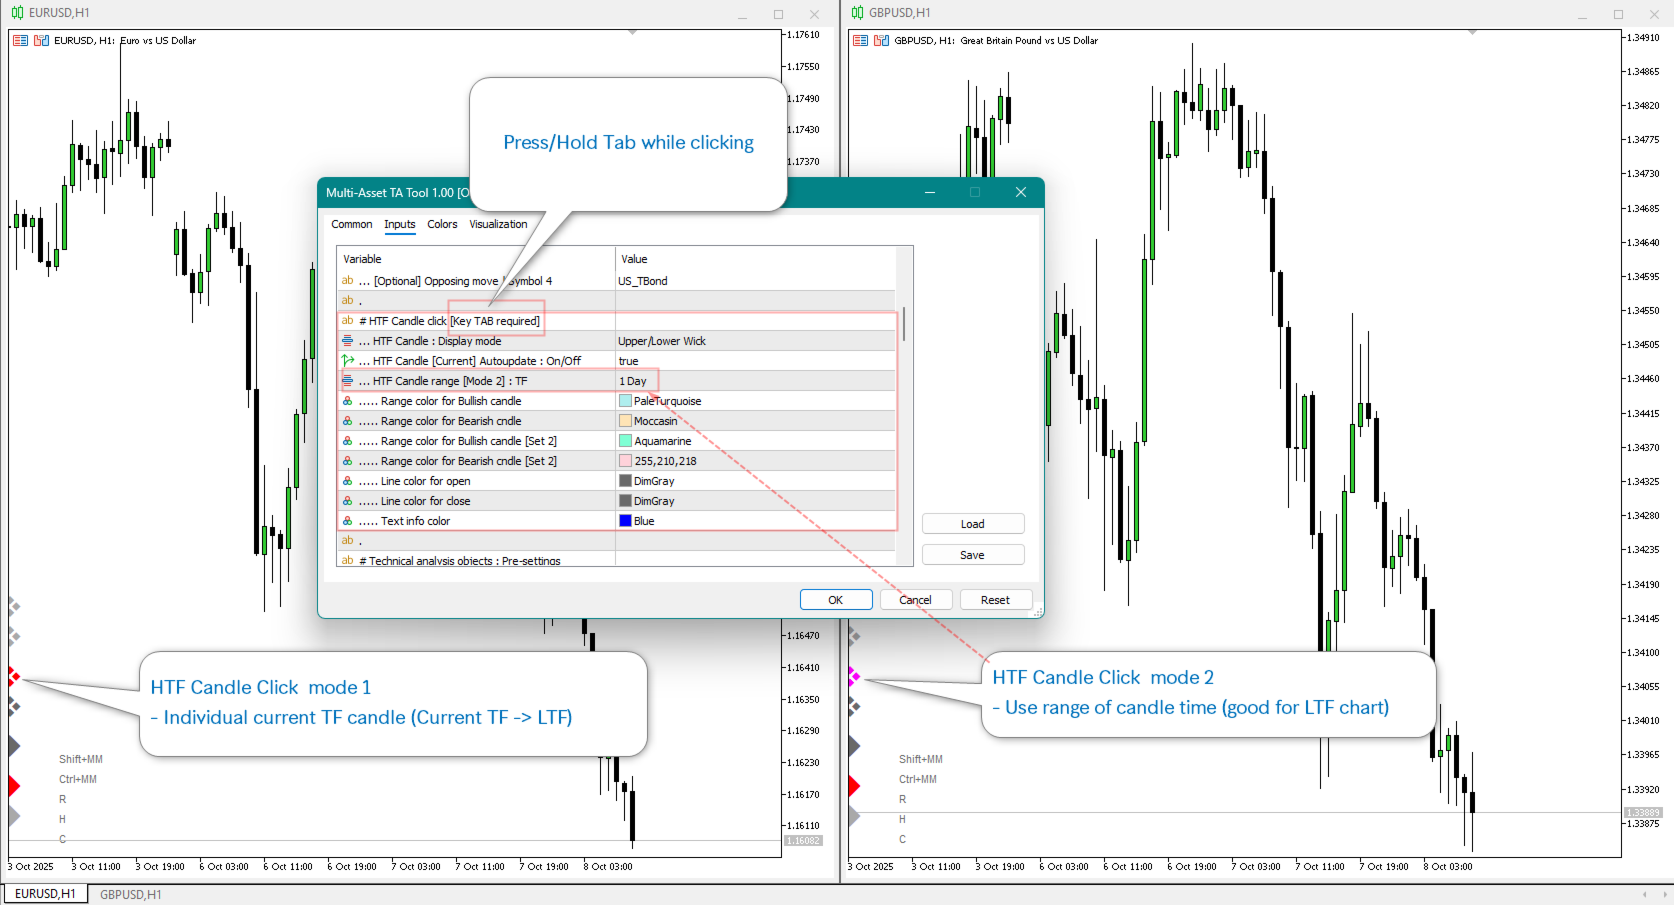
- HTF Candle click. You can click individual candles or defined-TF candle area on chart to create the HTF candle area on the current chart.
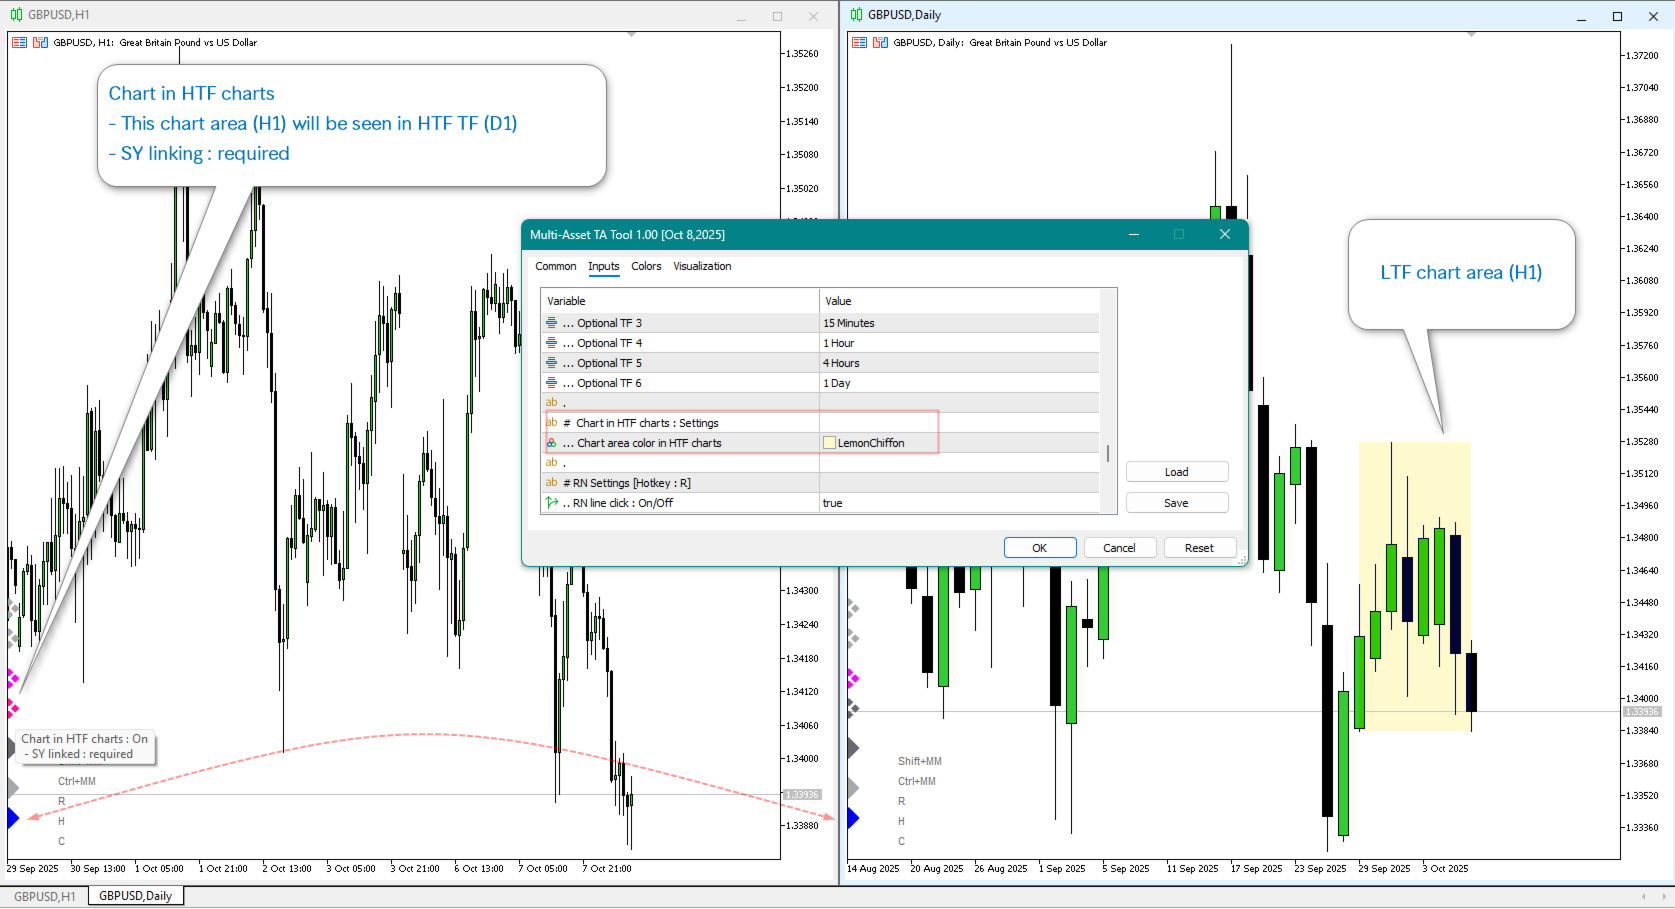
- LTF chart in HTF charts. You can see the active chart area (LTF) in among HTF charts with same symbol.
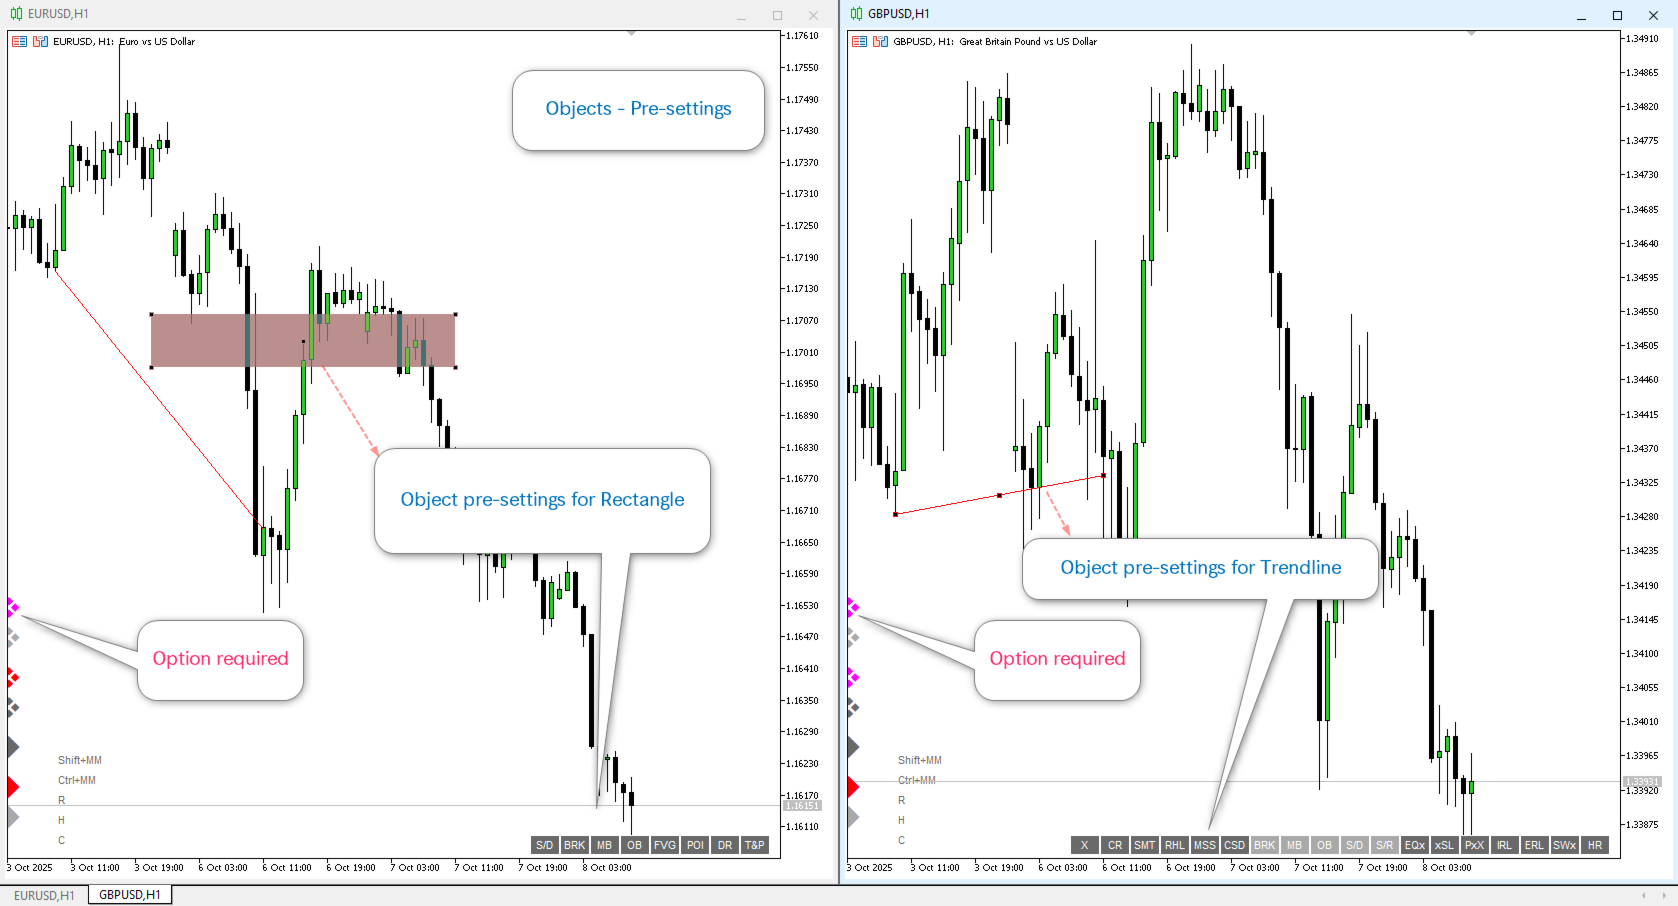
- Objects with pre-settings. Most TA objects are based on ICT concepts.
- Round numbers suppported. Press R to create/remove RNs on the current chart.
- Crosshair among charts. Press/Hold Ctrl and move mouse.
- Mouse move for Horizontal line and Vertical line. Select a object and Press/Hold Shift and move mouse.
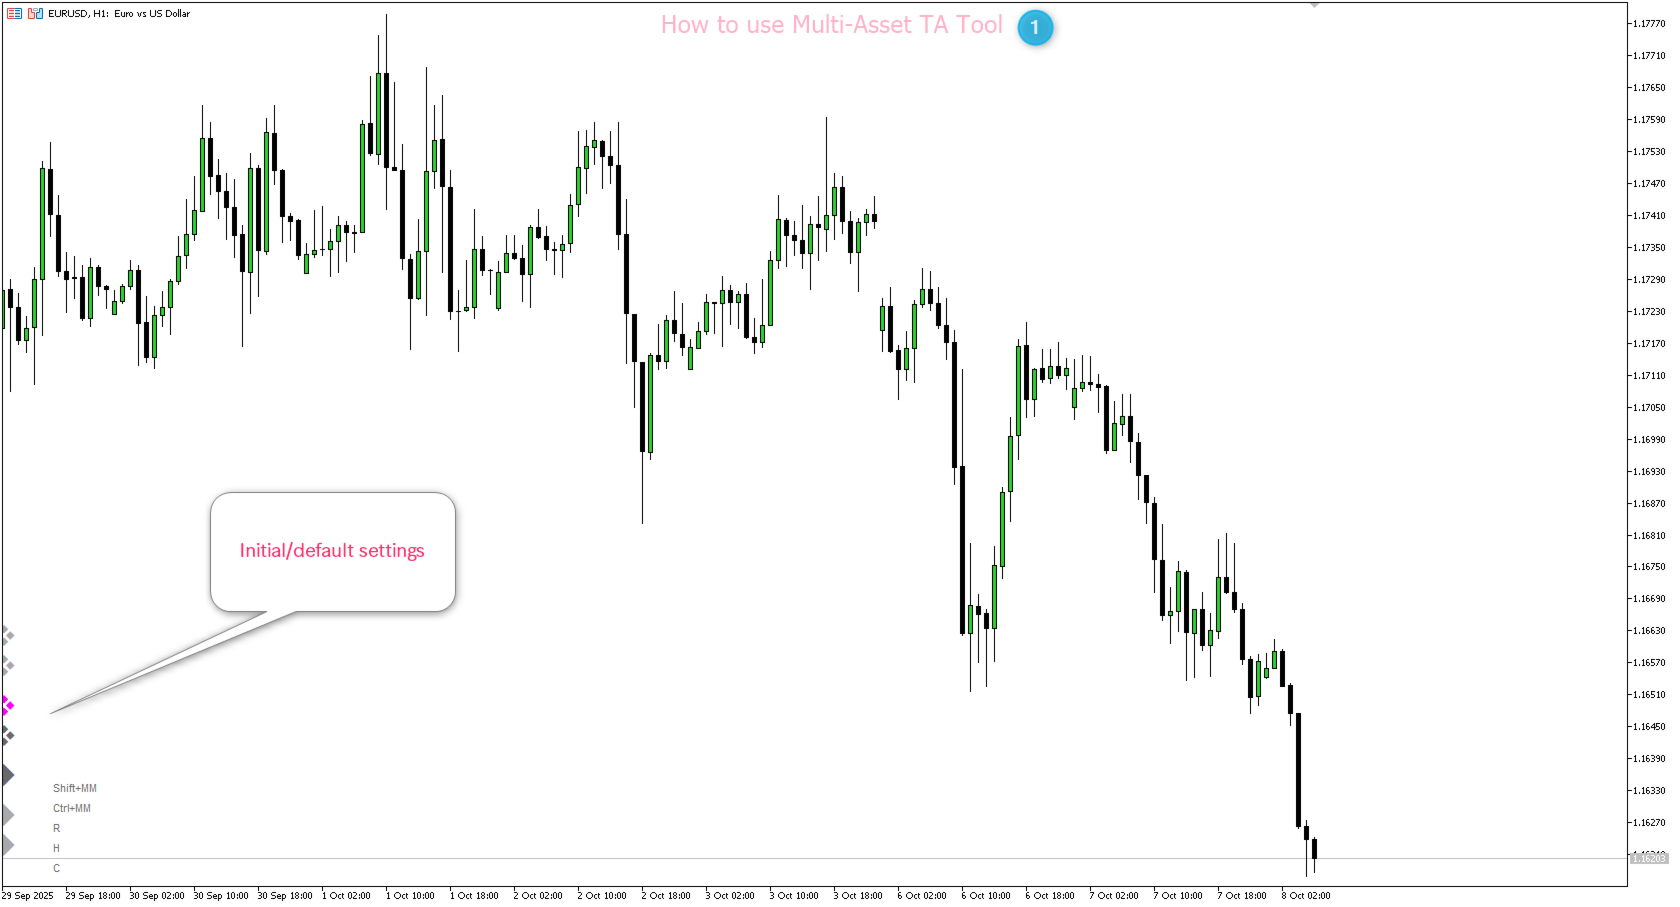
- Hotkeys R = Round Numbers, C = Clear all drawings, H = High/Unhide all drawings.
- Chart Same Time - when a chart is clicked, all charts display the same point of time.
- Object with chart navigation among grouped charts.
- Custoimized chart objects
Advantages [tracking and synchronizing objects across all charts with the same/different symbol]
- Easy to use. Just attach this indicator to your chart with customized values and save as a template. Load all charts with the template. Now, it is very easy to create new objects/modify objects from any chart timeframe
- There are 10 chart groups available, just select the group for each chart
- There are two window linking modes: Symbol or Timeframe - define how the grouped charts are linked/synchronized
- Auto time-and-price based calculation is object reference in different symbols (Symbol Correlation)
- Some pre-setting objects based on ICT concept are available
- Save your time
- Help you better focus on price action trade in many timeframes/many assets
- Clear information for each object.
Parameters [for default settings]
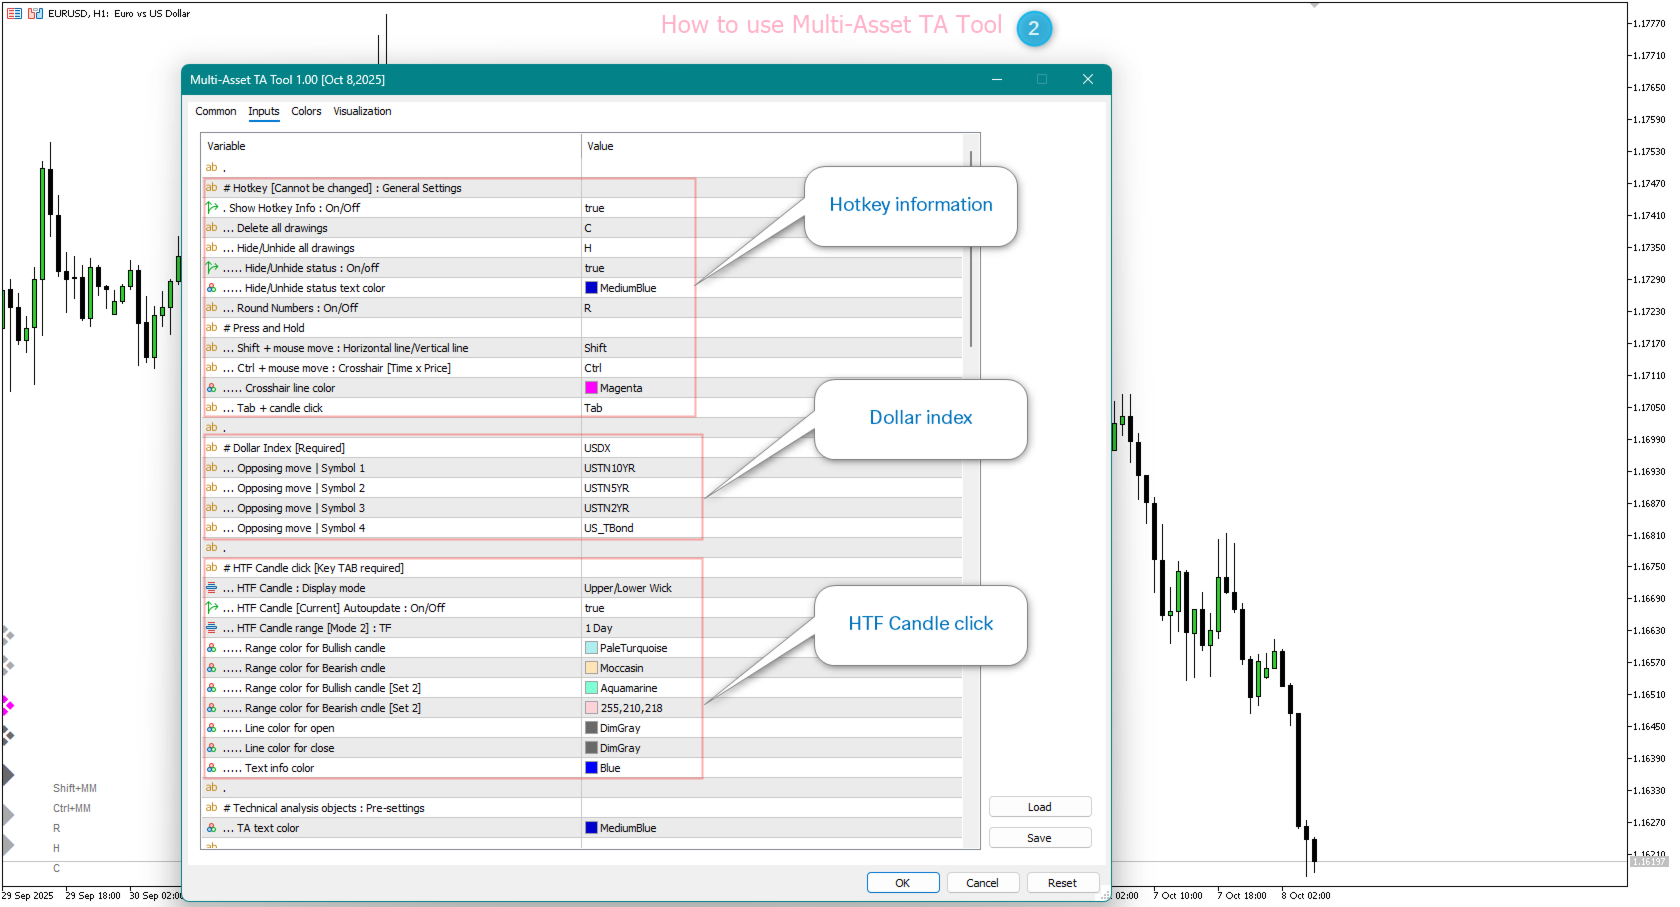
# Hotkeys [Cannot be changed]
# Dollar Index [Required]
# HTF Candle Click
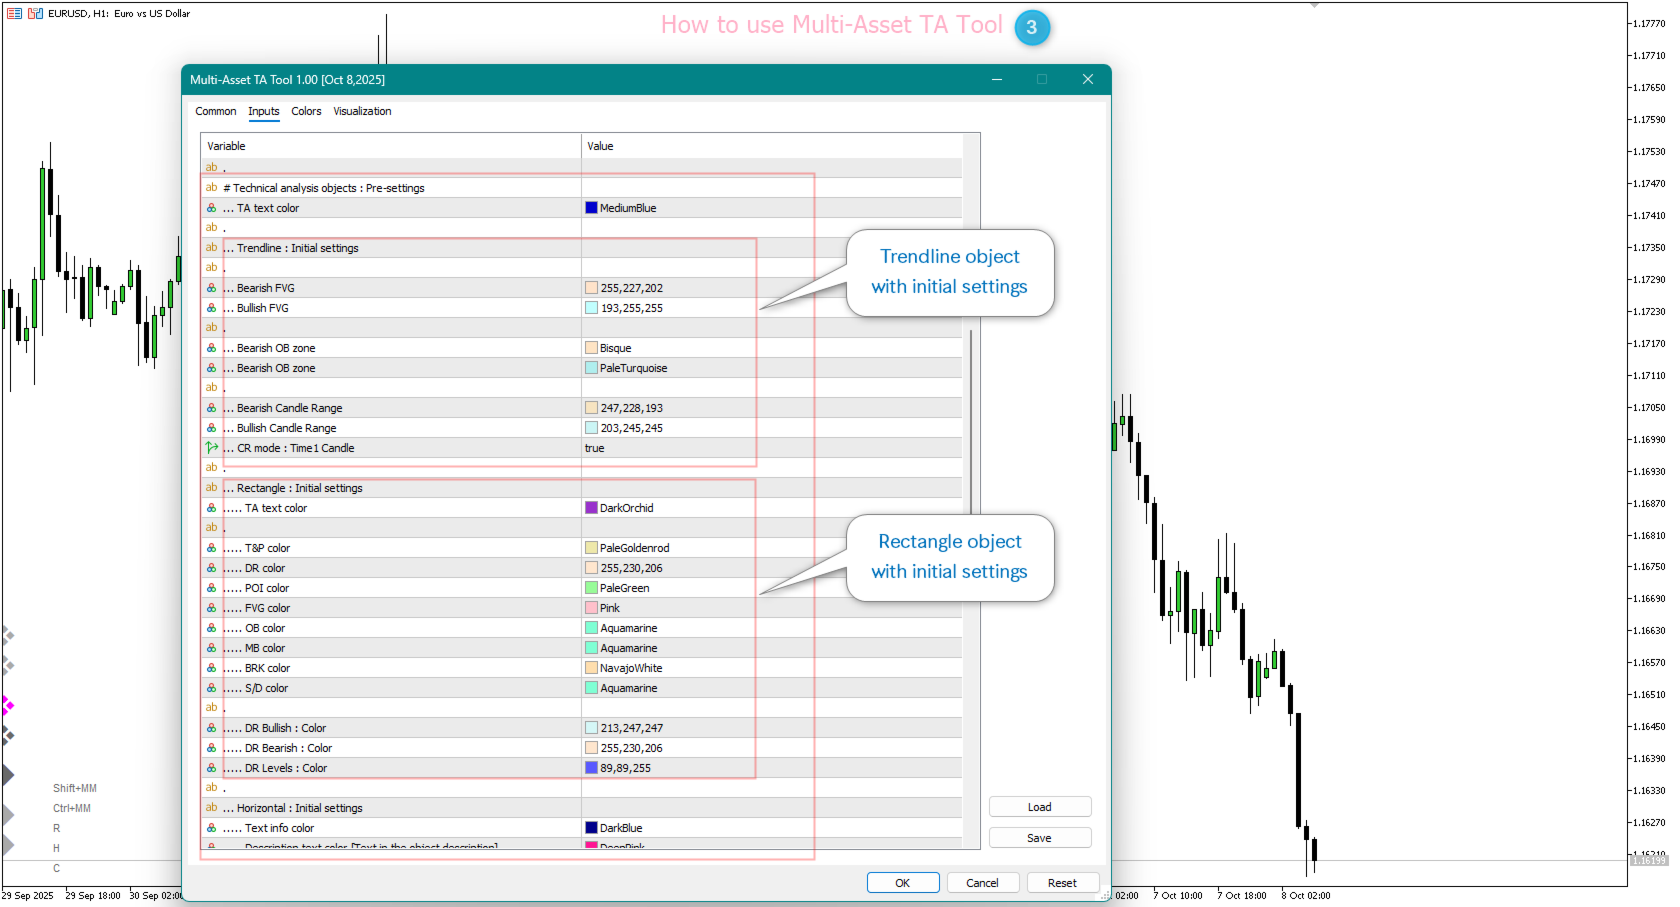
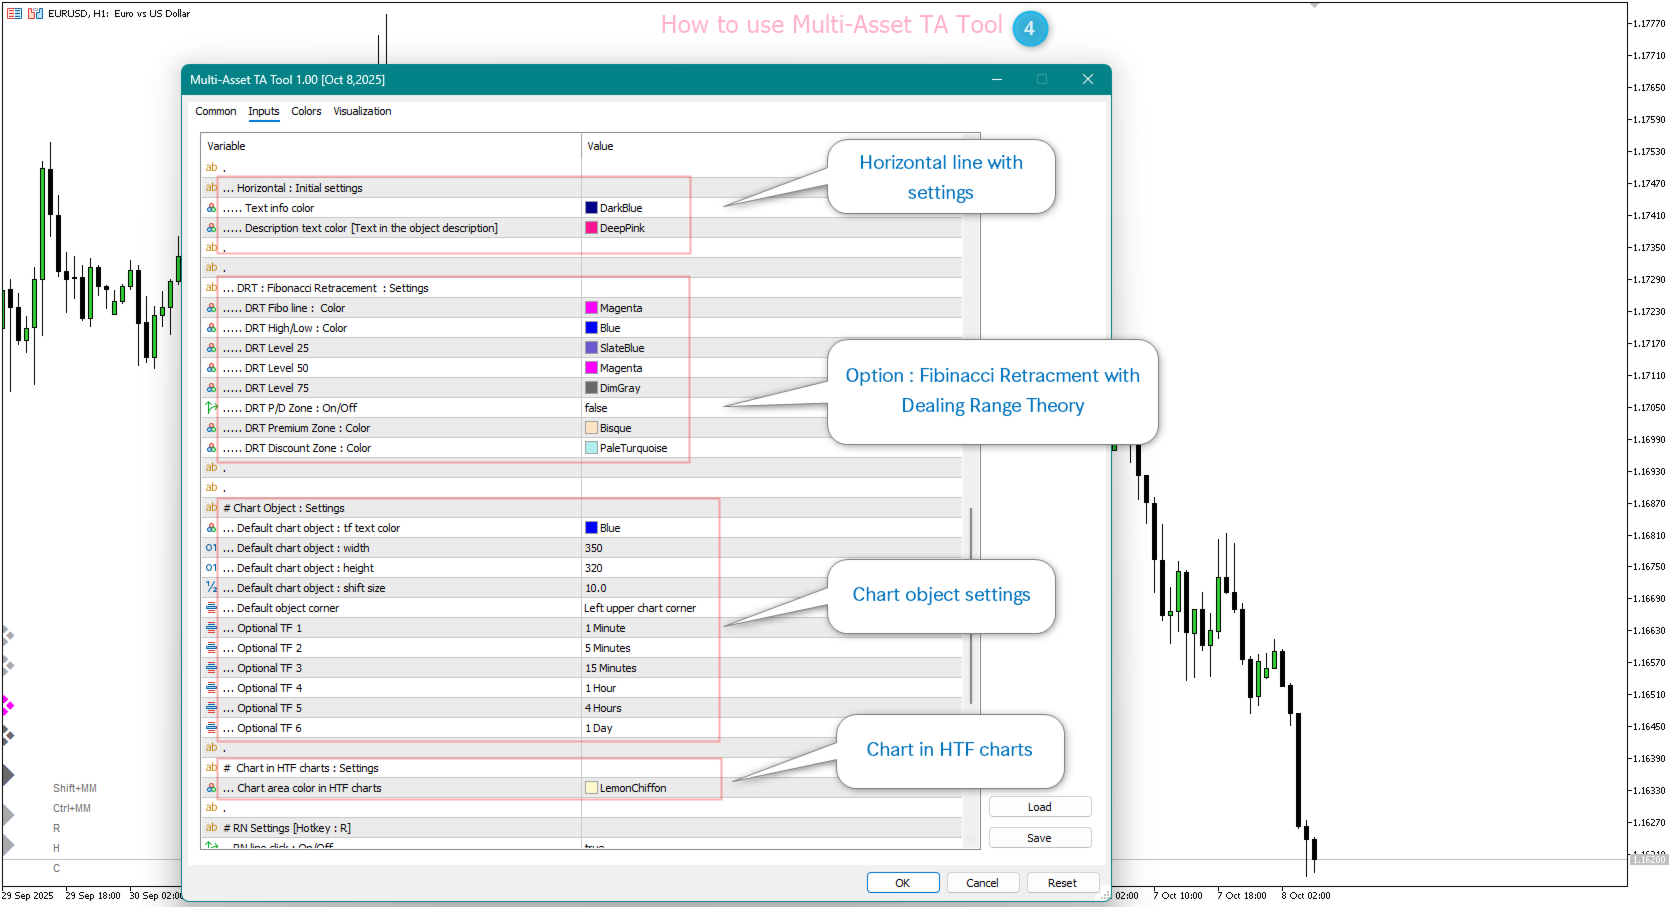
# Technical Analysis Objects [initial settings]
# Chart Object : Settings
# Chart in HTF Charts
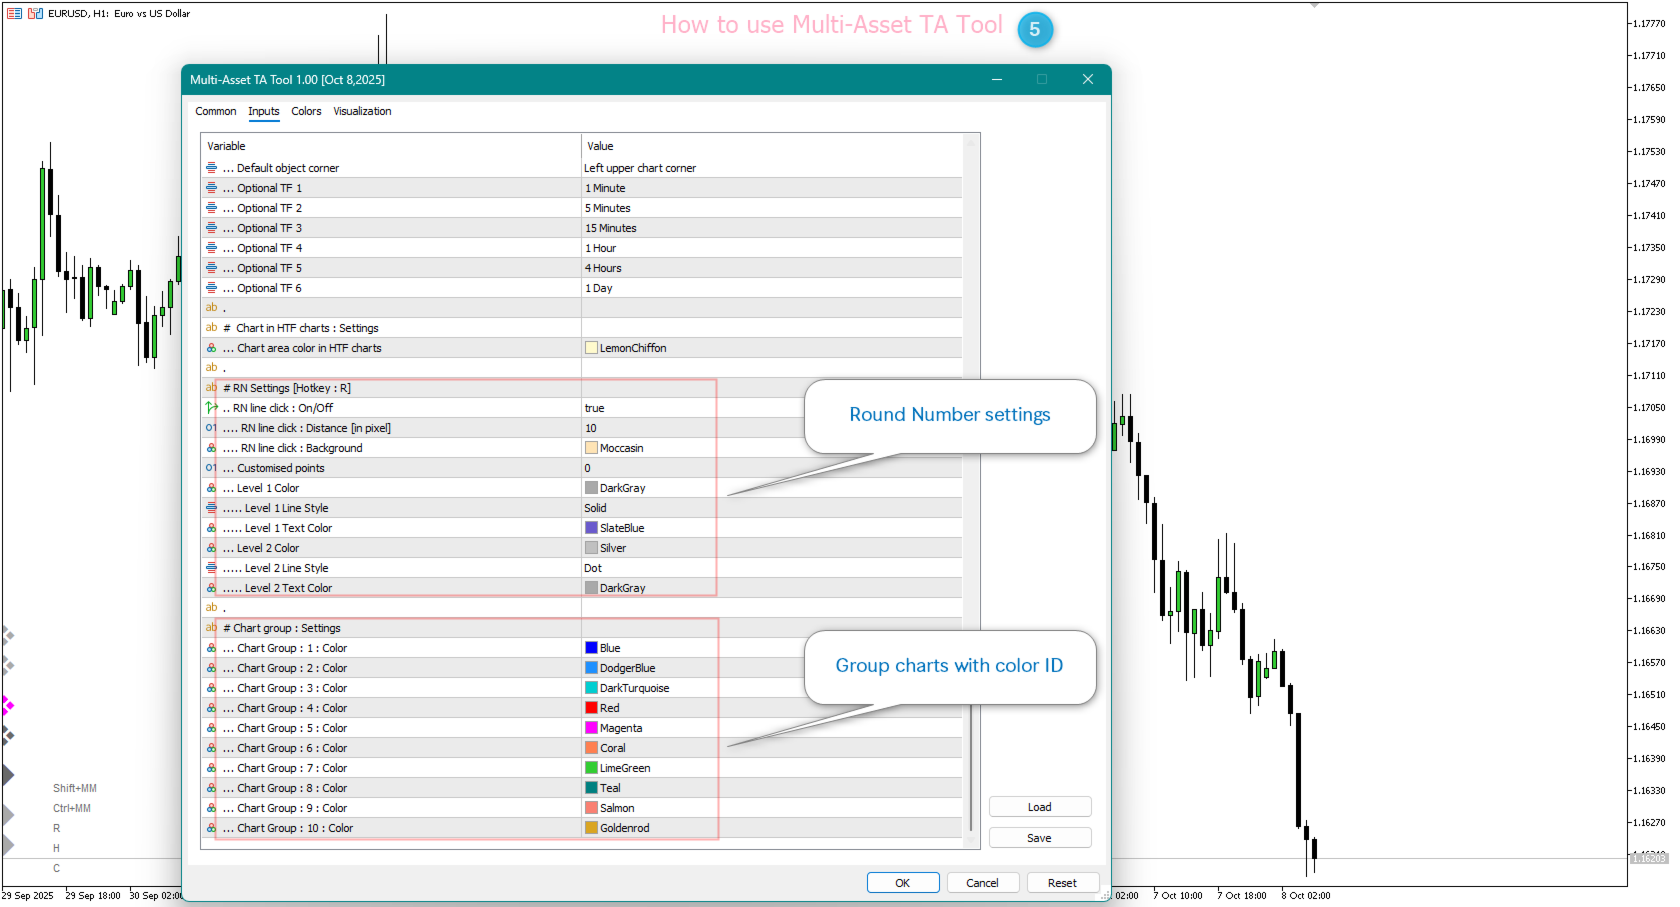
# Round Numbers : Settings
# Chart group : Settings
Settings | Chart group: Button color - settings for chart group (make sure you use the same color)- Chart group: NONE - do not define chart group
- Chart group: 1 - define color for the group 1
- Chart group: 2 - define color for the group 2
- Chart group: 3 - define color for the group 3
- Chart group: 4 - define color for the group 4
- Chart group: 5 - define color for the group 5
- Chart group: 6 - define color for the group 6
- Chart group: 7 - define color for the group 7
- Chart group: 8 - define color for the group 8
- Chart group: 9 - define color for the group 9
- Chart group: 10 - define color for the group 10
Settings | Chart window linking: Button color - settings for linking chart windows
- Window linking: Symbol - symbol link for the groupped windows
- Window linking: Timeframe - timeframe link for the groupped windows