AT Break
- Indicatori
-
Zaha Feiz
 Sono Zaha.
Sono interessato ai mercati finanziari e alla creazione di esperti di trading. Puoi seguirmi tramite i seguenti link.
🔻🤖 EXPERTS: - Versione: 1.0
- Attivazioni: 12
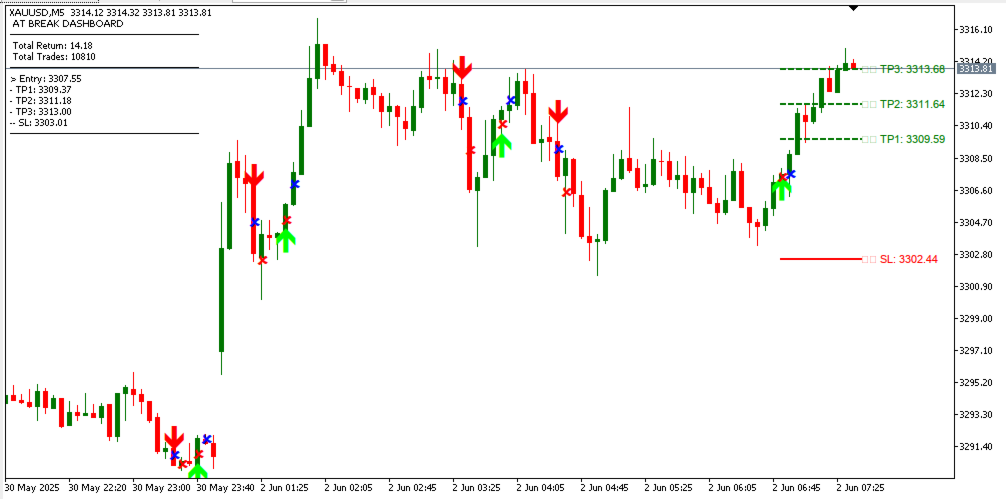
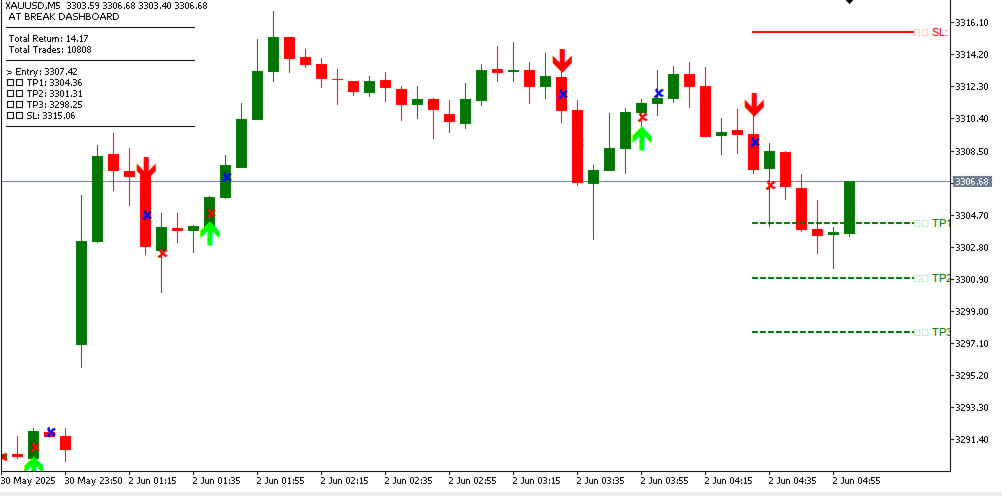
AT Break - Smart Breakout Points Indicator
General Description
The AT Break indicator is an advanced technical analysis tool for the MetaTrader 5 platform, designed based on detecting breakouts of resistance and support levels. This indicator uses sophisticated algorithms to identify potential entry and exit points and displays them visually on the chart.
Main Settings
| Parameter | Description | Range/Options | Default |
|---|---|---|---|
| Price Type | Determines the price type used for calculations | Close, Open, High, Low, Median, Typical, Weighted | Close Price |
| Signal Lag | Number of candles considered for calculating highest and lowest prices | 1 to ∞ | 3 |
| Time Threshold | Time threshold percentage for signal confirmation | 0 to 100% | 1.0% |
| Use Volume Filter | Enable volume filter for signal confirmation | Boolean (On/Off) | On |
| Min ATR Lag | Minimum lag for ATR indicator calculation | 1 to ∞ | 1 |
| Max ATR Lag | Maximum lag for ATR indicator calculation | 1 to ∞ | 2 |
| Holding Period | Number of candles the signal should be maintained | 1 to ∞ | 1 |
| Draw Channel | Display resistance and support lines on chart | Boolean (On/Off) | On |
🎯 TP/SL Settings
| Parameter | Description | Default |
|---|---|---|
| Show TP/SL Levels | Display target and stop loss levels on chart | On |
| ATR Period | Number of candles for ATR indicator calculation | 14 |
| TP1 Multiplier | ATR multiplier for first target | 1.0 |
| TP2 Multiplier | ATR multiplier for second target | 2.0 |
| TP3 Multiplier | ATR multiplier for third target | 3.0 |
| Stop Loss Multiplier | ATR multiplier for stop loss level calculation | 1.5 |
📊 Display Settings
| Parameter | Description | Default |
|---|---|---|
| Show Performance | Display indicator performance statistics in chart corner | On |
| Position Size | Lot size for performance statistics calculation | 0.01 |
| Use Base Price | Use base price for calculations | Off |
Visual Elements
| Element | Color | Description |
|---|---|---|
| Buy Signal | Lime Green | Green arrow at the bottom of candle |
| Sell Signal | Red | Red arrow at the top of candle |
| Resistance Line | Orange | Orange line indicating resistance level |
| Support Line | Aqua | Blue line indicating support level |
| Close Position | Blue/Red | Cross mark showing exit points |
| TP/SL Levels | Green/Red | Dashed lines for targets, solid line for stop loss |
Key Features
- Automatic Level Breakout Detection: Advanced algorithm for identifying valid breakouts
- Smart Volume Filter: Uses ATR indicator for signal confirmation
- Integrated Risk Management: Automatic calculation of TP and SL levels
- Real-time Statistics Display: Combined performance statistics in real-time
- Visual User Interface: Clear and beautiful display of signals and levels
- High Customization: Complete parameter personalization capability
How It Works
The indicator continuously monitors price and compares it with calculated resistance and support levels to identify breakout points. When price crosses an important level and confirmation conditions (such as volume filter) are met, the corresponding signal is generated and displayed.