AverageHighLow
- Indicatori
- Versione: 1.1
- Aggiornato: 17 giugno 2025

AverageHighLow — Simple and Smart Signal Indicator
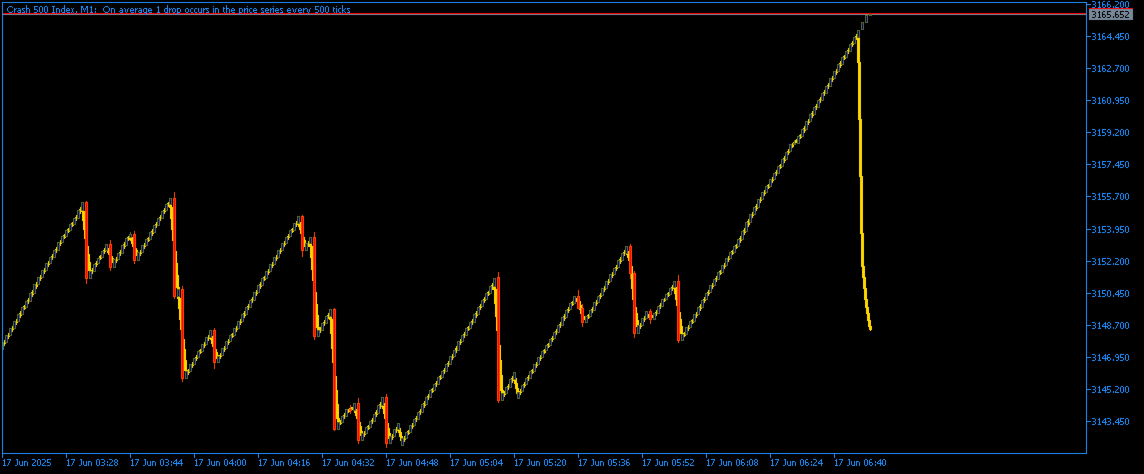
AverageHighLow is a lightweight and intuitive custom indicator that plots the average of the High and Low prices for each candle — forming a dynamic support/resistance-like line across the chart. It also includes real-time Buy and Sell signal alerts when price crosses this average level.
Features:
-
✅ Plots a smooth line based on (High + Low) / 2
-
🔔 Signals generated when price crosses the average:
-
Buy Signal: Price crosses above the line
-
Sell Signal: Price crosses below the line
-
-
📢 Alerts are displayed in the Alerts tab (optional push/email notifications can be added)
-
⚙️ Works on any symbol and any timeframe
-
🧠 Built with clean MQL5 logic for fast execution and low resource usage
-
👌 Suitable for manual trading or as a signal feed for EAs
🧠 How It Works
This indicator calculates the midpoint of each candle’s range (High + Low) / 2 and plots it as a line. When the current Close price crosses above or below this level, a signal is triggered.
This can help you:
-
Identify potential breakouts or reversals
-
Confirm entries when paired with other indicators
-
Use as a filter in algorithmic strategies