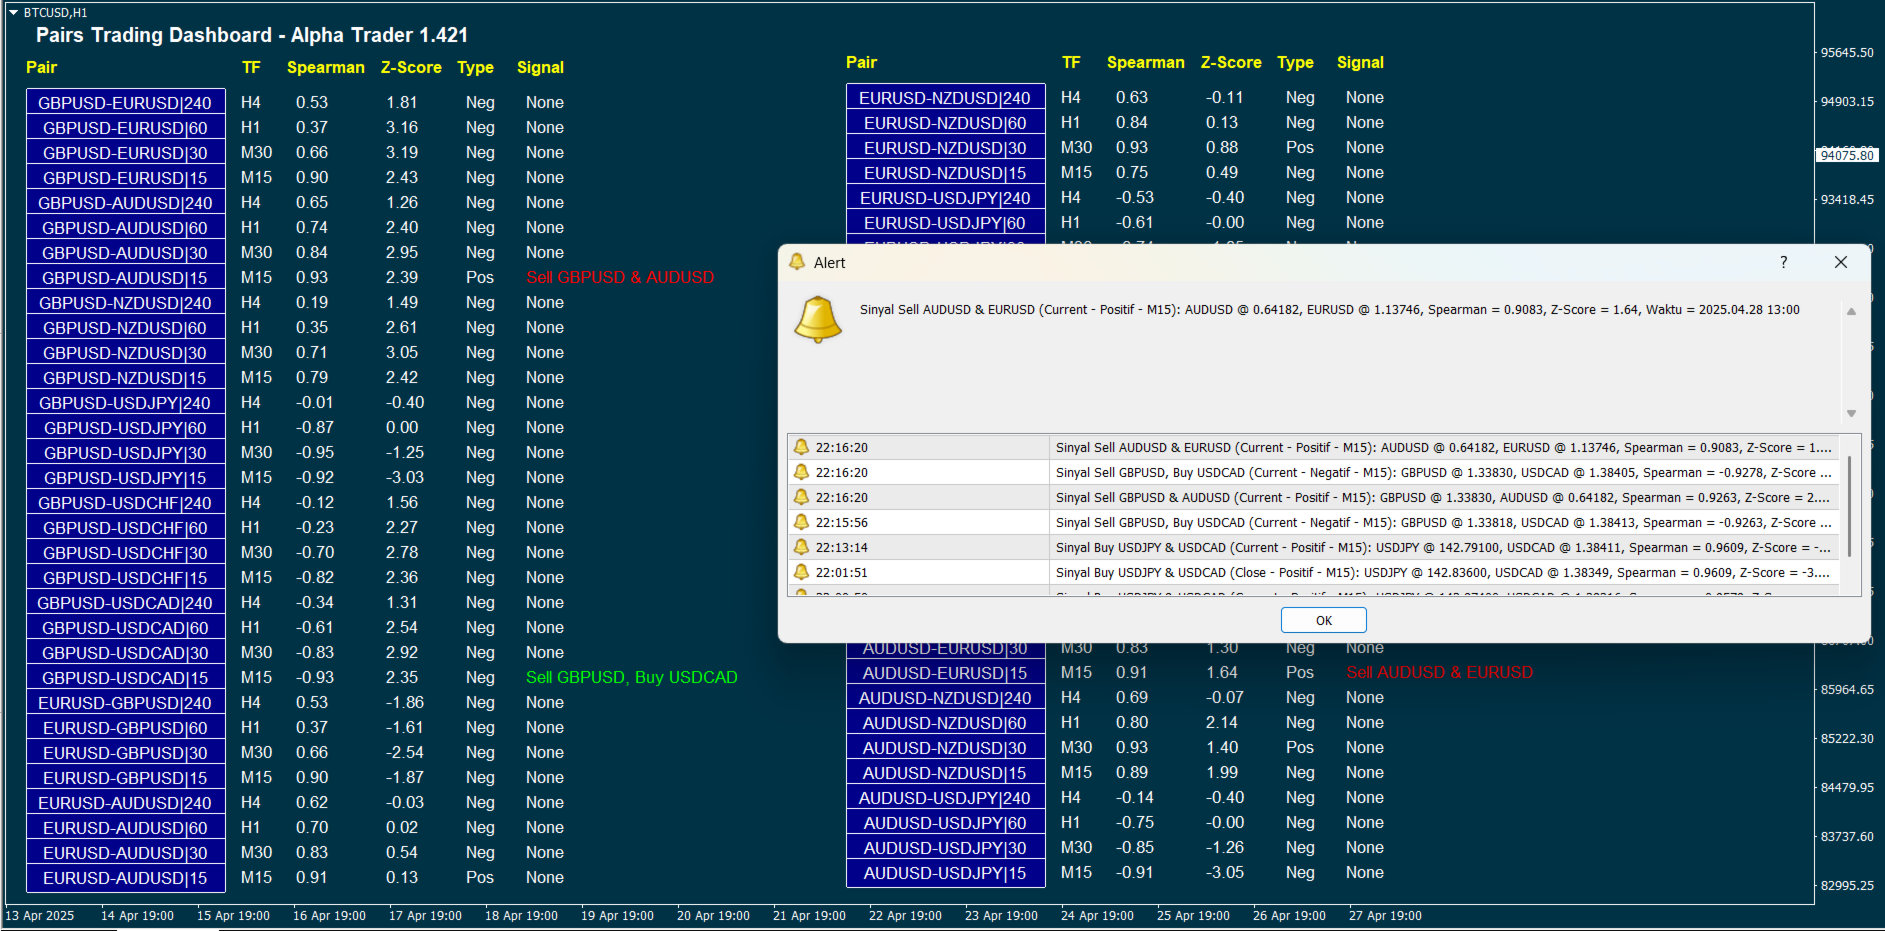
Pairs Trading Dashboard
- Indicatori
- Versione: 1.42
- Attivazioni: 5

Pairs Trading Dashboard - Spearman Correlation and Stationary Z-Score is a custom indicator designed for the MetaTrader 4 (MT4) platform, developed to assist traders in analyzing and monitoring currency pairs for pairs trading strategies. It utilizes Spearman’s rank correlation coefficient and Z-Score calculations to identify trading signals across multiple timeframes and currency pairs. The indicator integrates various technical filters and stationarity tests to refine signal generation and displays results on an interactive dashboard.
Key Features
- Correlation Analysis:
- Calculates Spearman’s rank correlation coefficient to measure the relationship between two currency pairs.
- Supports both negative (default threshold: -0.95) and positive (default threshold: 0.95) correlation-based signals.
- Allows users to toggle visibility of positive or negative correlation pairs.
- Z-Score and Stationarity:
- Computes Z-Score to assess the deviation of the spread between pairs, with a configurable lookback period (default: 100 bars) and threshold (default: 2.5).
- Offers stationarity testing via the Augmented Dickey-Fuller (ADF) test, with options for differencing or logarithmic transformations to ensure spread stationarity.
- Users can require stationarity for signal generation (default: enabled).
- Technical Filters:
- Incorporates Moving Average (MA), Relative Strength Index (RSI), and Bollinger Bands as filters for signal confirmation.
- Configurable parameters include MA period (default: 20), RSI period (default: 14), and Bollinger Bands period (default: 20) with deviations (default: 2.0).
- Supports a Bollinger-only filter mode or no filter option.
- Multi-Timeframe and Multi-Pair Support:
- Monitors up to 40 currency pairs (configurable), with a default list including pairs like EURUSD-USDCHF, GBPUSD-USDJPY, etc.
- Supports up to four user-defined timeframes (e.g., M15, H1, D1, W1), with independent signal generation for each.
- Displays signals for each pair and timeframe on a customizable dashboard.
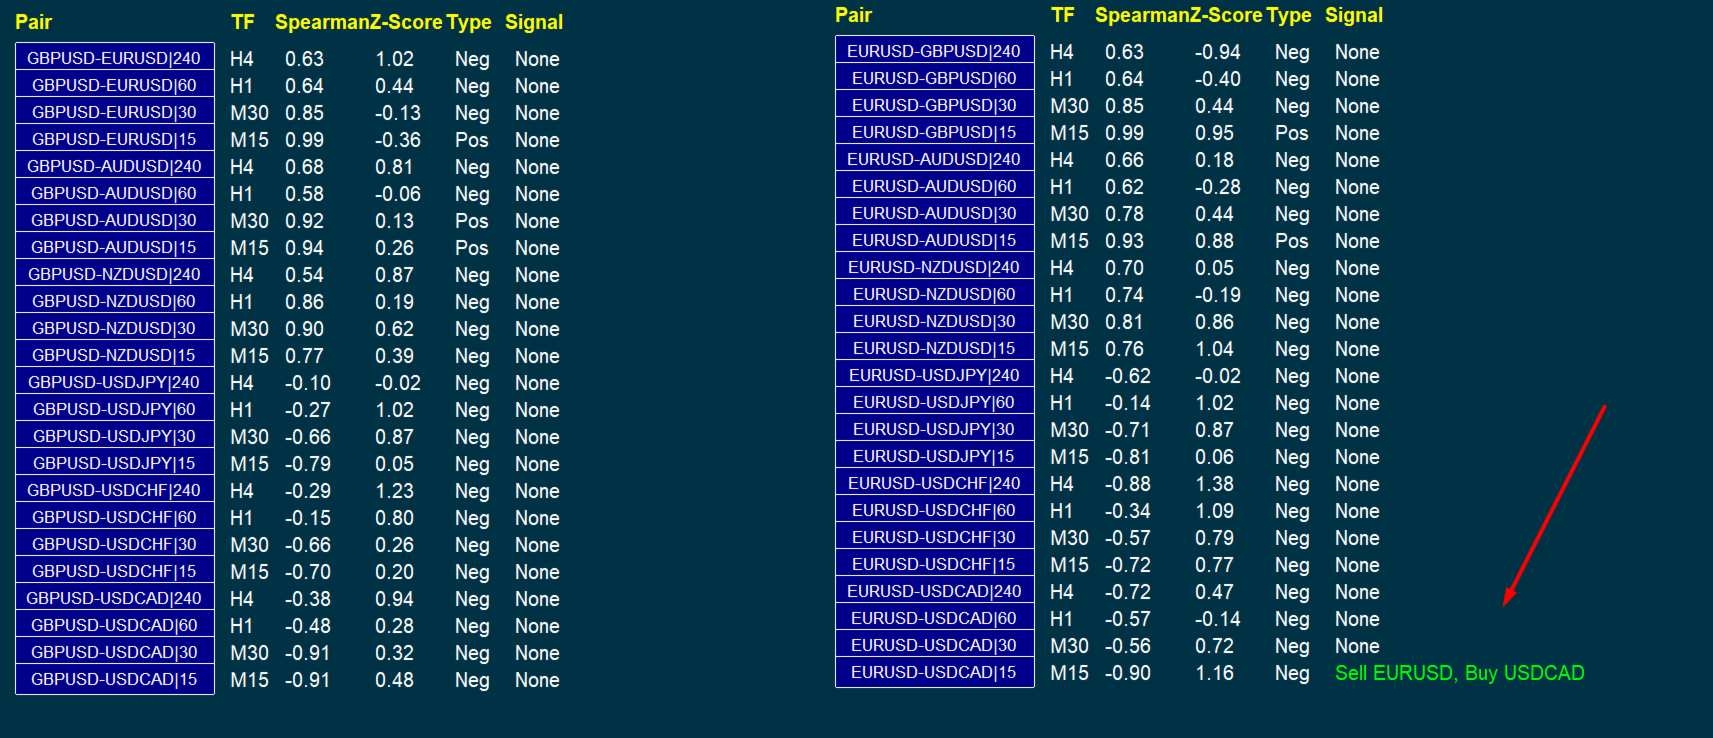
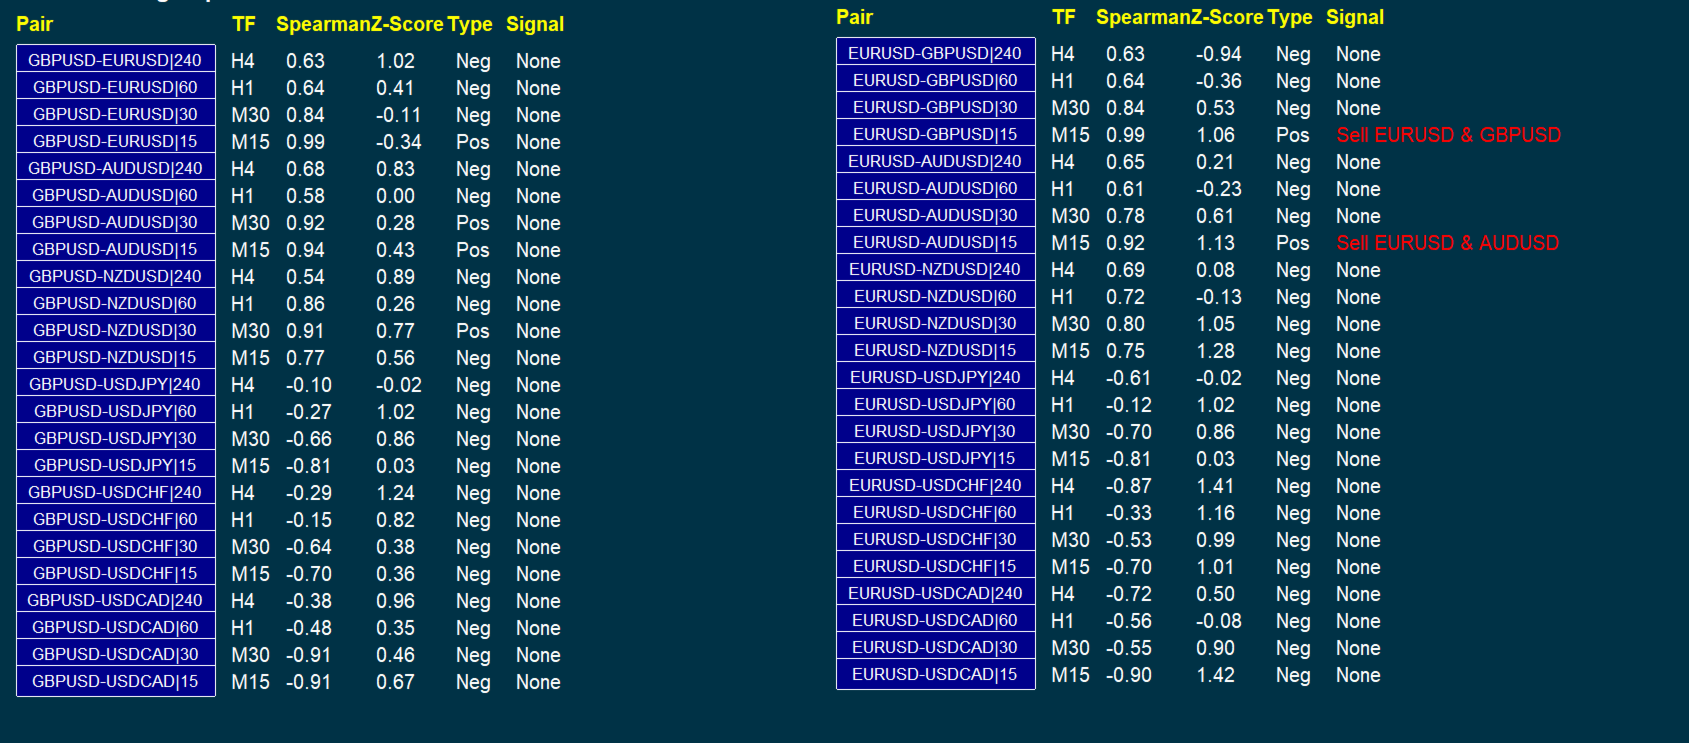
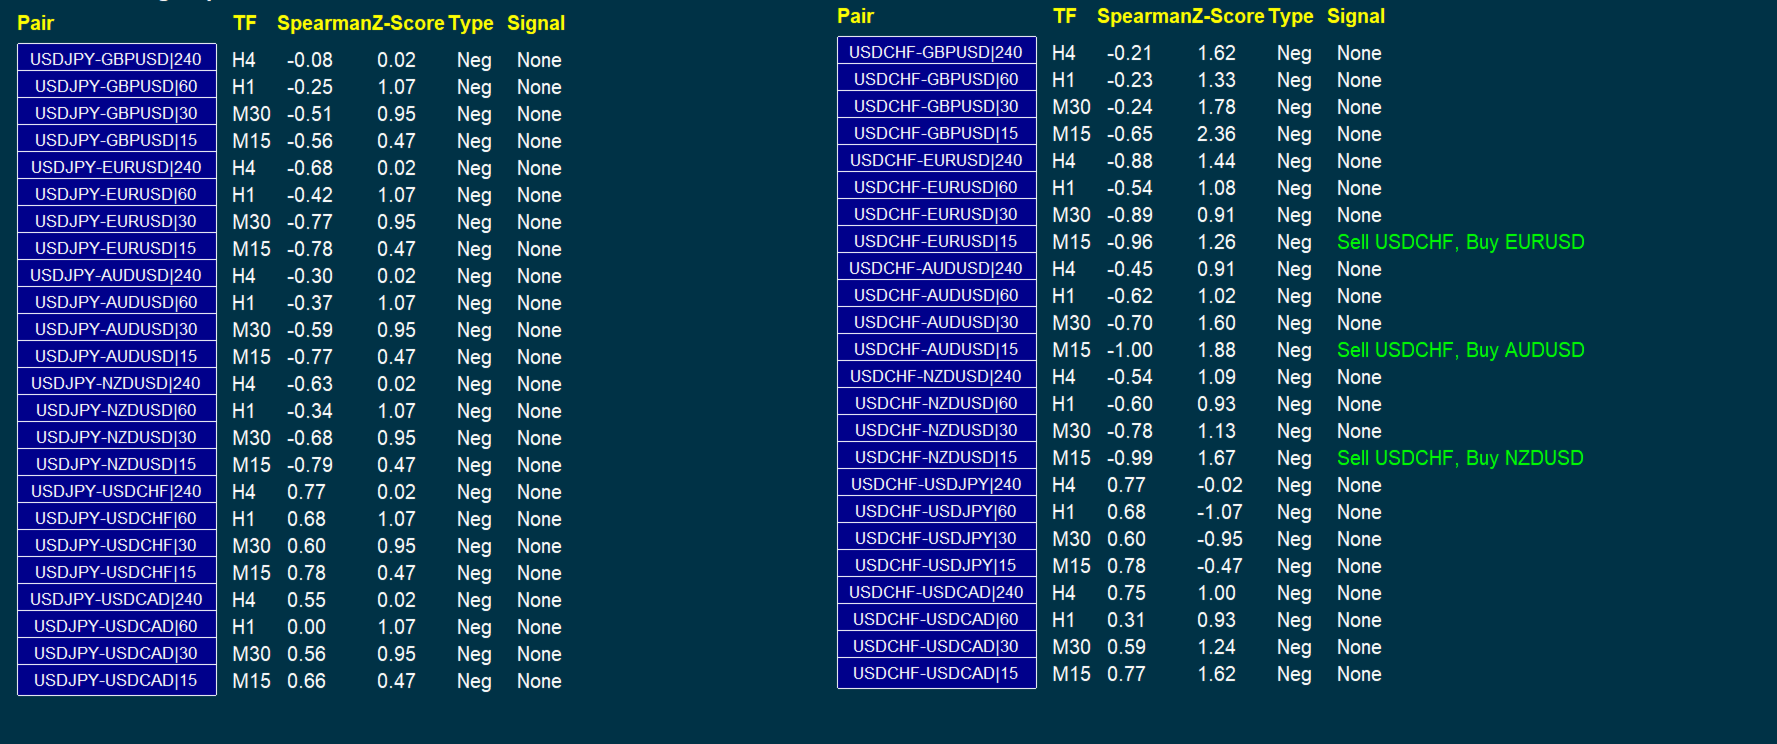
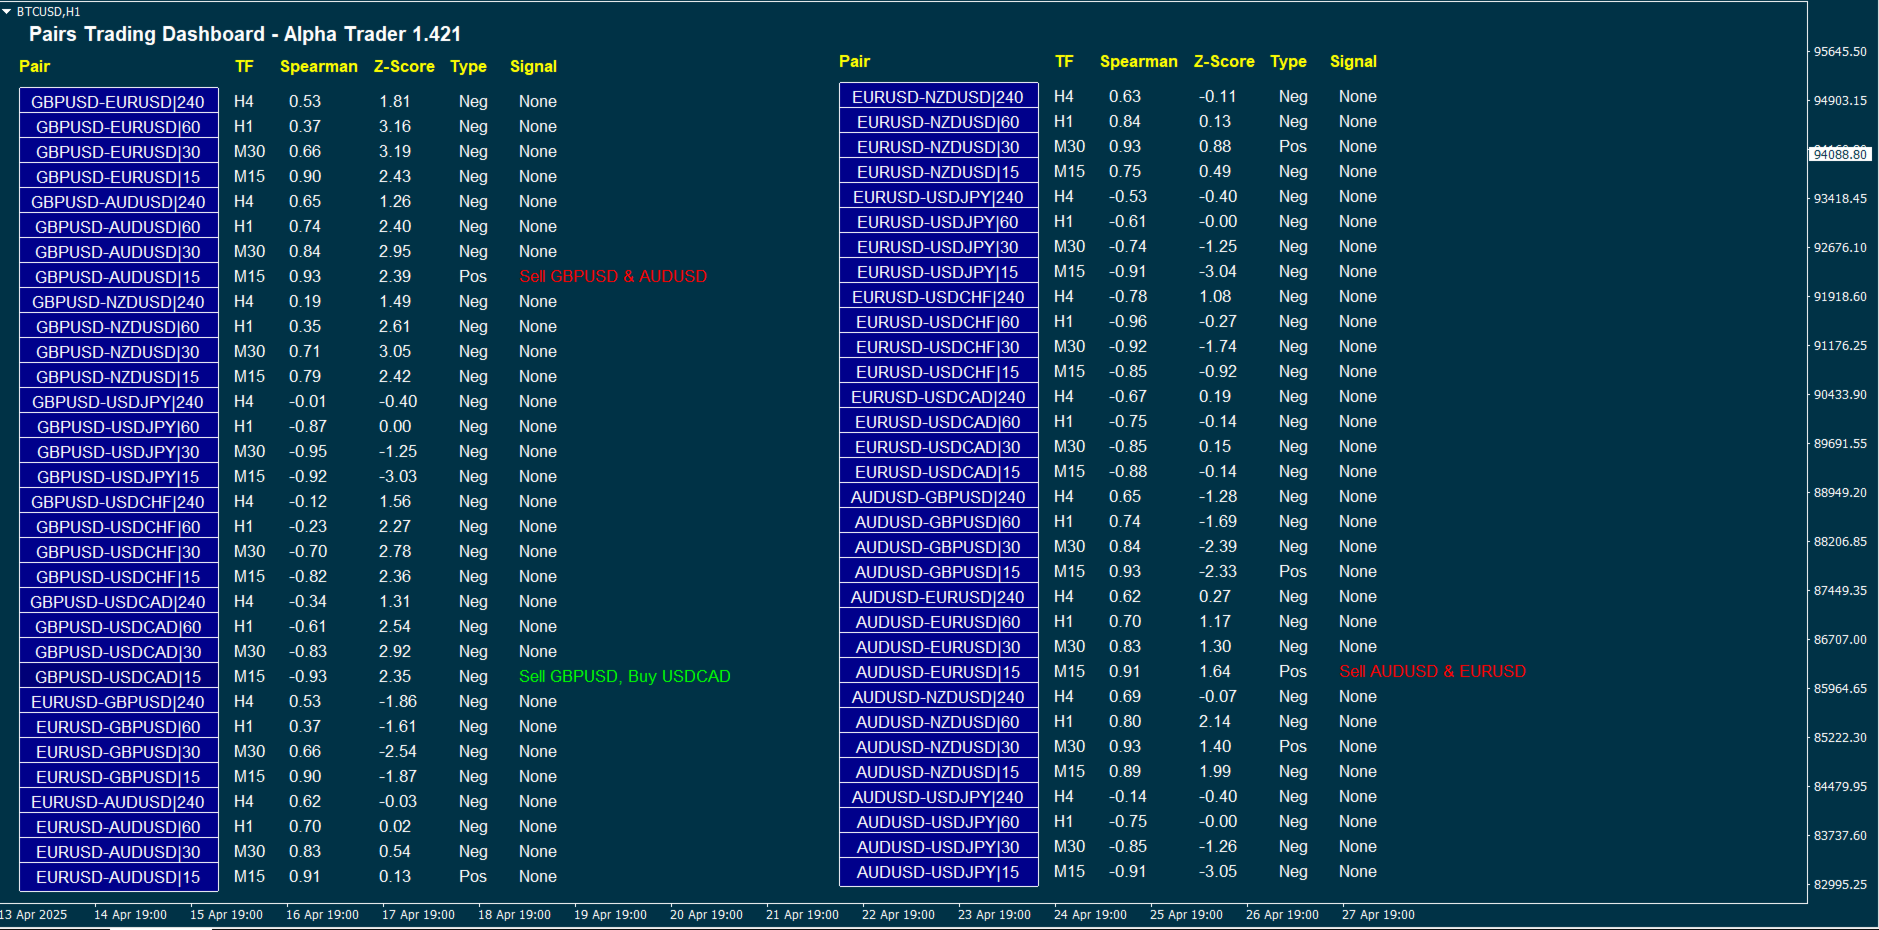
- Dashboard Interface:
- Presents real-time data in a two-column layout, showing pair names, timeframe, Spearman correlation, Z-Score, correlation type (positive/negative), and trading signals (e.g., "Buy EURUSD, Sell USDCHF").
- Includes clickable buttons to open charts for selected pairs and apply a predefined template ("Pair Trading Chart - Alpha Trader v1.421").
- Updates at a configurable interval (default: 60 seconds) to optimize CPU usage.
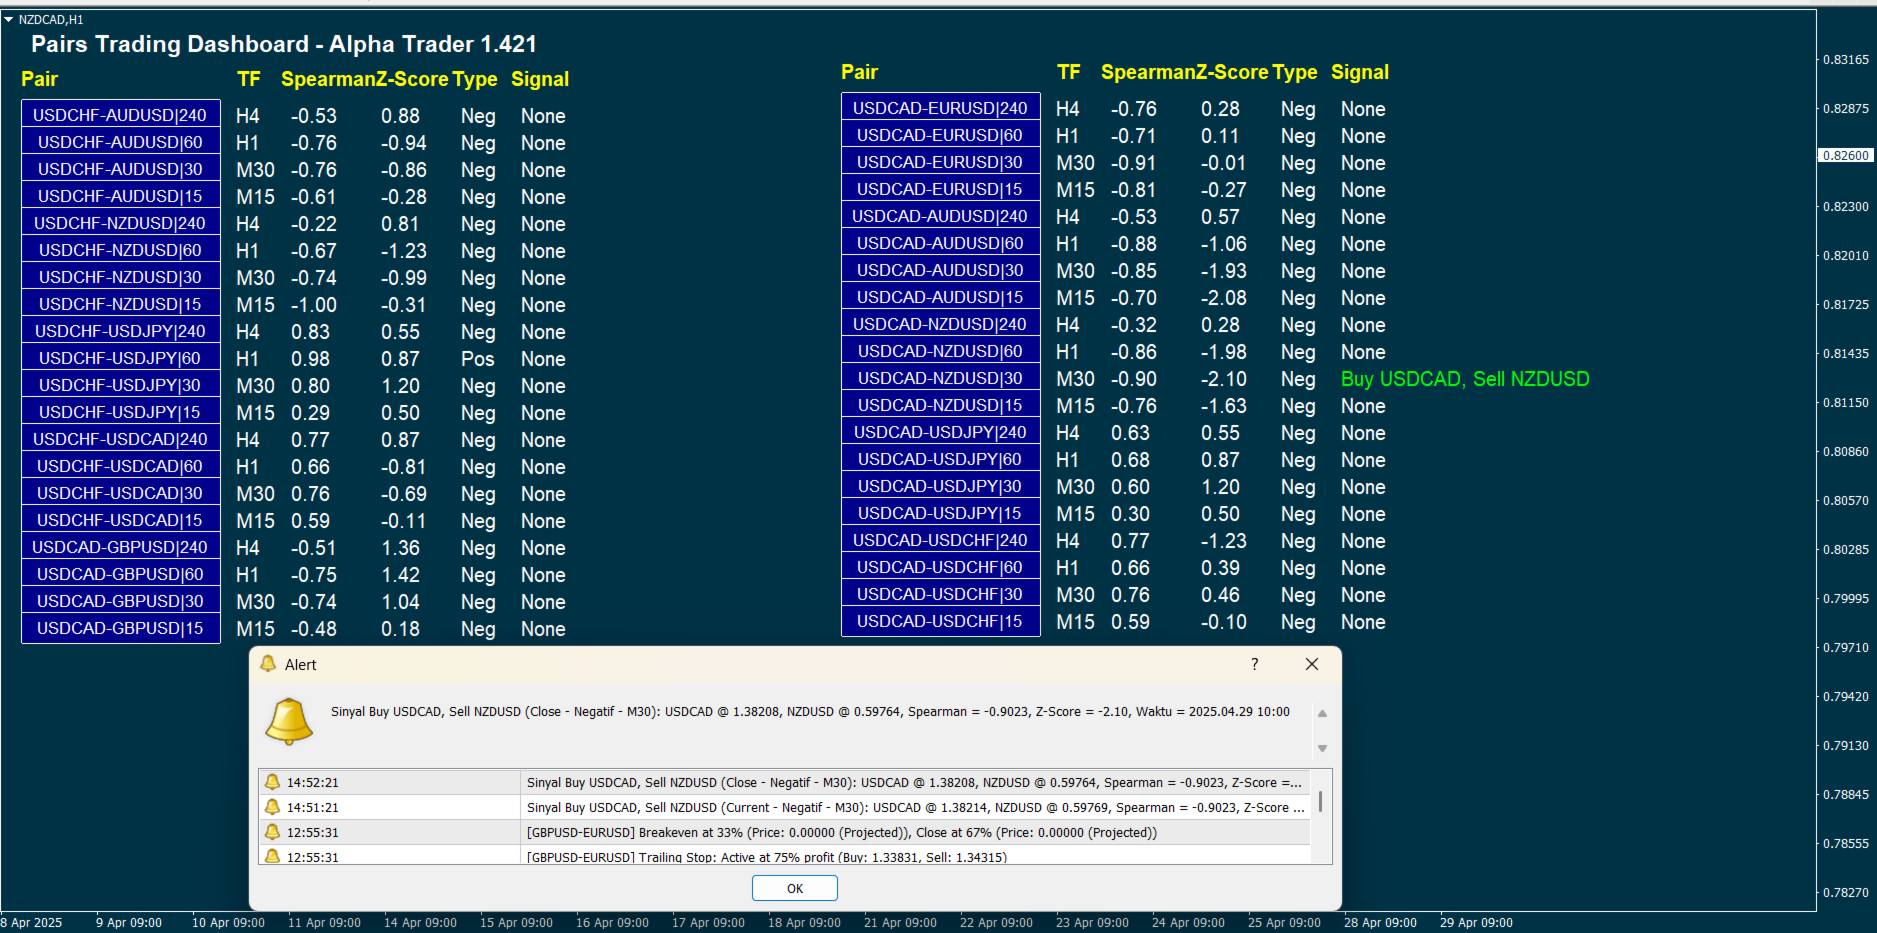
- Signal Generation and Alerts:
- Generates buy/sell signals based on correlation, Z-Score, and technical filter conditions.
- Offers alert modes for current bar, closed bar, or both, with options for pop-up alerts and push notifications.
- Prevents repeated alerts using timestamp tracking.
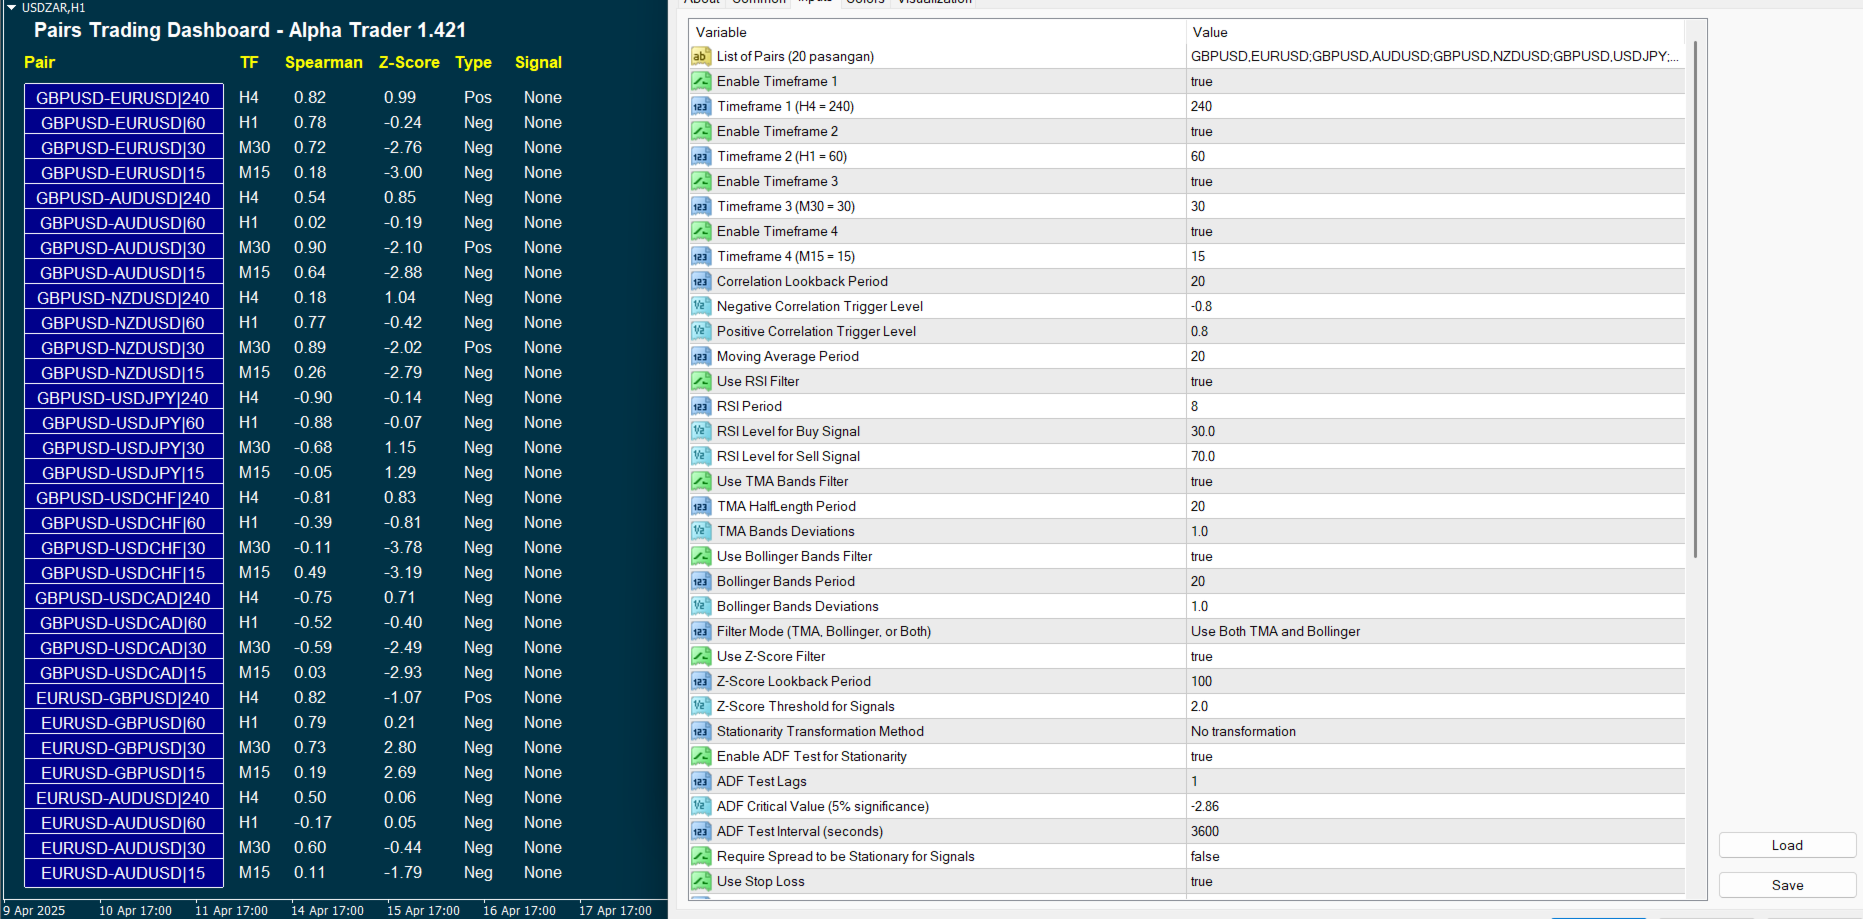
- Customization:
- Extensive input parameters for adjusting lookback periods, thresholds, filter settings, and display options (e.g., font size, column positions).
- Allows users to enable/disable features like RSI, Bollinger Bands, Z-Score, ADF test.
Usage
- Initialization: Parses a user-defined list of currency pairs and initializes timeframes. Validates symbol availability in Market Watch.
- Operation: Continuously calculates correlations, Z-Scores, and technical indicators, updating the dashboard at set intervals.
- Deinitialization: Cleans up dashboard objects upon removal.
Notes
- The indicator is optimized for CPU efficiency with configurable update intervals and pair limits.
- Requires sufficient historical data (minimum bars determined by lookback periods and filter settings).
- When using the dashboard, make sure to limit the bars in the Max bars in chart option to below 2000, for example 500.
High price, bad signals and only small profit