AI T3 MA Super Fill

MT4 platform AI T3 MA Super Fill indicator use introduction
I. Overview of indicators

The AI T3 MA Super Fill indicator is a powerful analytical tool that combines advanced algorithms and T3 moving average technology to provide traders on the MT4 platform with accurate market trend judgments and trading signals. It uses intelligent algorithms to deeply process the price data, and displays the changes of the T3 moving average in a unique way to help traders more effectively grasp the market dynamics, whether in the trend market or the shock market, can assist traders to make smarter trading decisions, suitable for foreign exchange, stocks, futures, precious metals and other financial trading markets.
Second, the composition and principle of indicators

T3 Moving Average Portfolio: This indicator is based on the T3 moving average and reflects the trend of the market over different time spans by calculating T3 moving averages for different periods, such as short (13 periods) and long (20 periods) averages. The intersection, separation and convergence of these moving averages are key factors in determining the change of market trend. The T3 moving average gives more weight to recent price data than traditional moving averages, allowing it to capture changes in price trends more sensitively while reducing the impact of lag.
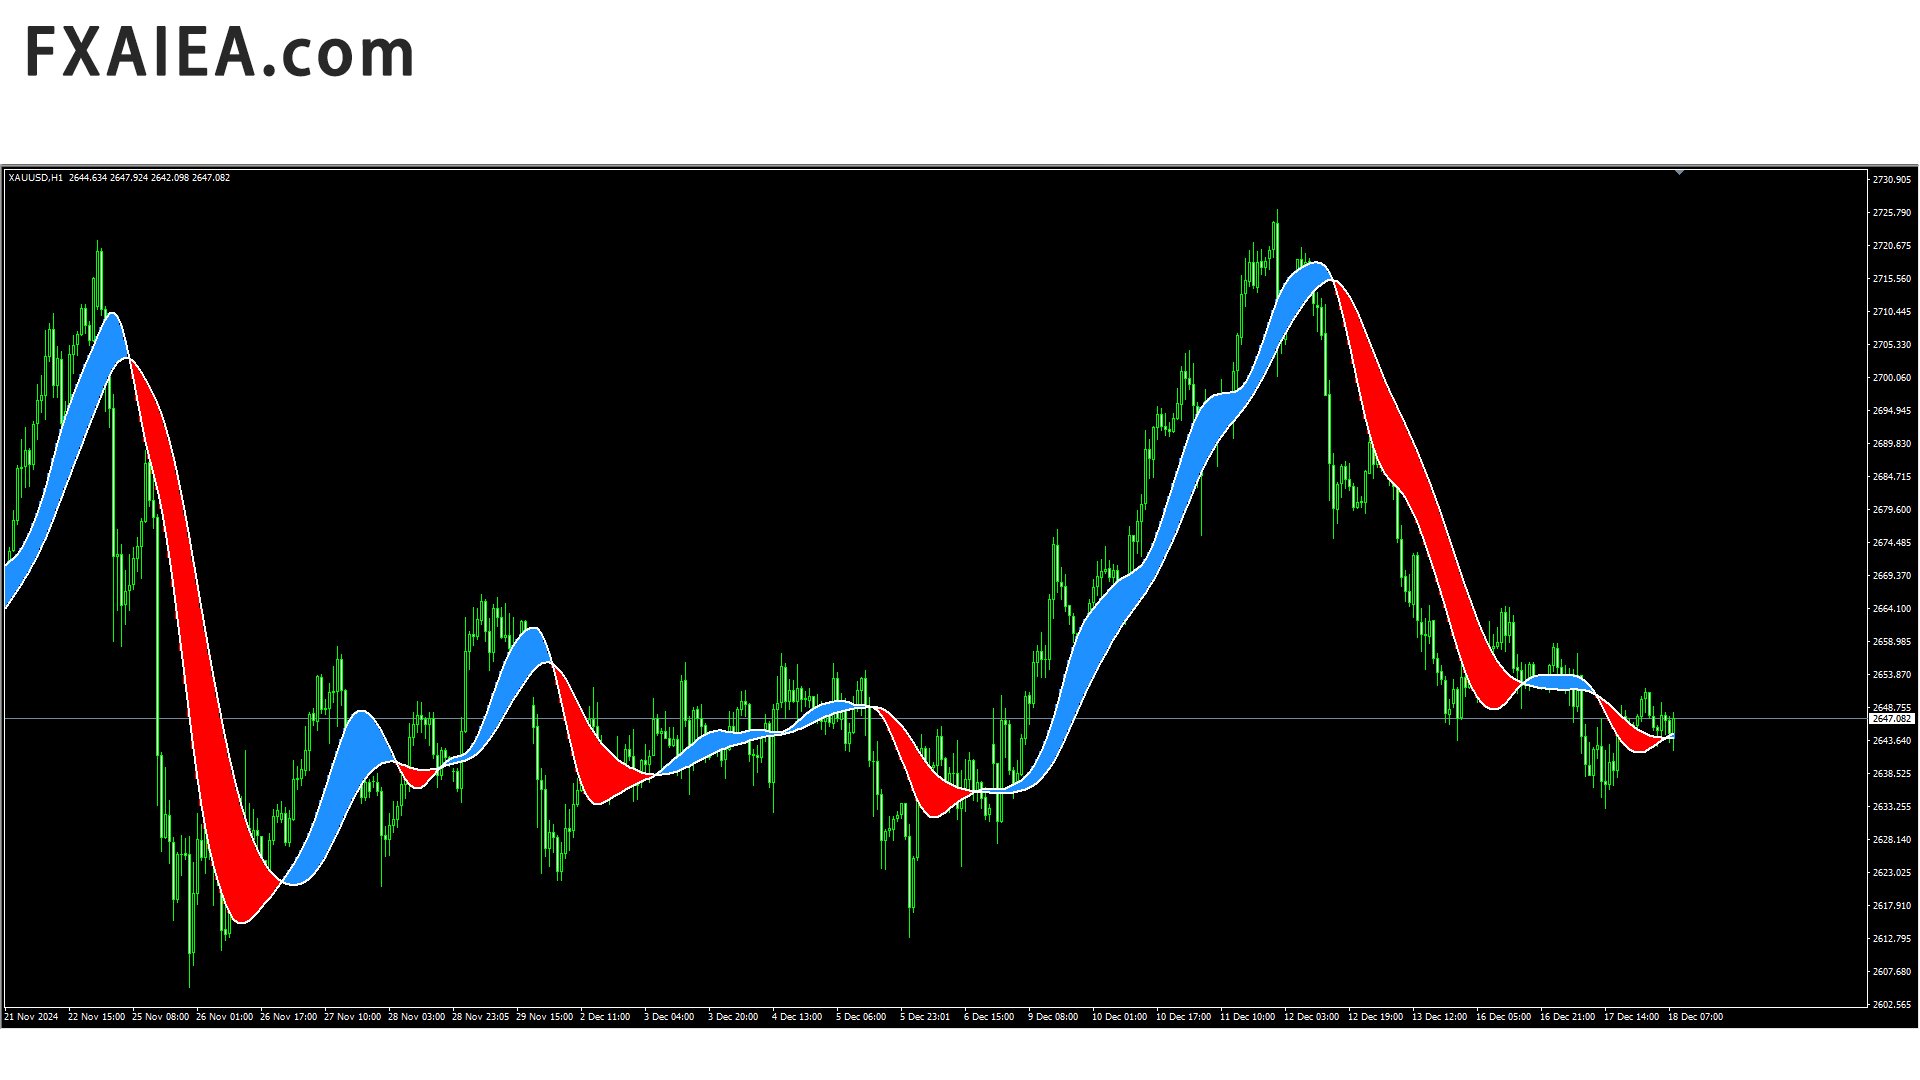
Smart fill area: The indicator is intelligently filled in the area between the moving averages to create a unique visual effect. When the market is in a bullish trend, the filled area appears blue, intuitively demonstrating the strength of the bullish trend; On the contrary, under the short trend, the filled area appears red, which intuitively shows the strength of the short trend. This filling method not only allows traders to quickly identify the dominant trend of the market, but also to sense the evolution of the trend from the dynamic changes in the filling area.
AI algorithm-driven: Indicators introduce artificial intelligence algorithms for real-time monitoring and analysis of market data. It automatically ADAPTS to price fluctuations in different market conditions and dynamically adjusts the sensitivity and parameter Settings of indicators to provide more accurate and reliable trading signals. For example, in the period of relatively violent market fluctuations, the algorithm will appropriately reduce the sensitivity of indicators to avoid too many false signals due to short-term price noise; When the market trend is more obvious, the algorithm will improve the response speed of the indicator to ensure that traders do not miss important trading opportunities.
Third, installation and setup

Installation steps: First, download the AI T3 MA Super Fill indicator file, usually in.ex4 format. Then, on the MT4 platform, click the "File" menu, select "Open Data folder", enter the "MQL4" folder, then find the "Indicators" folder, copy and paste the downloaded indicator file into this folder. Close and reopen the MT4 platform, select "Indicators" in the "Insert" menu, find the AI T3 MA Super Fill indicator you just installed in the list of custom indicators and click to add it to the chart.
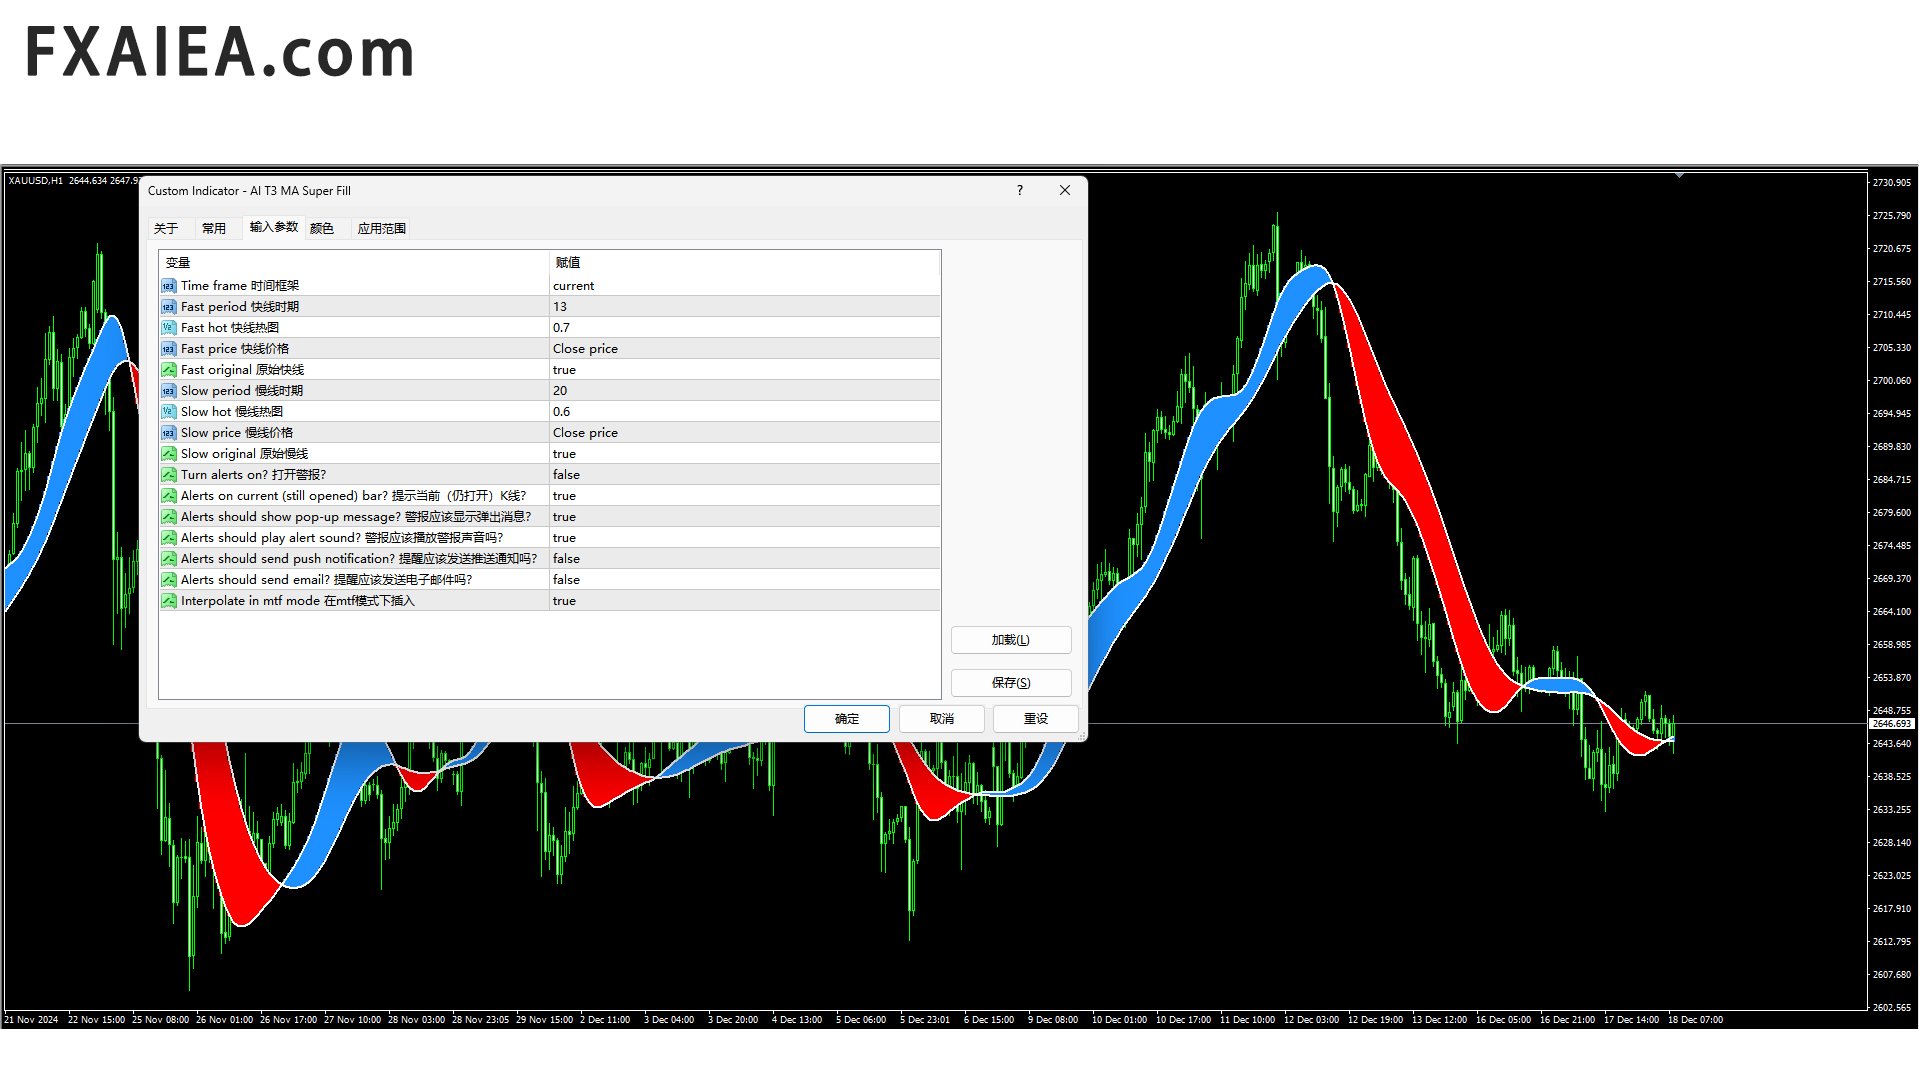
Parameter setting: After the installation is complete, traders can adjust the indicator parameters according to their own trading strategy and traded varieties. Common parameters include T3 EMA Settings for different periods, such as adjusting the period parameters of short-term and long-term EMA to adapt to the volatility characteristics and trading cycles of different markets. In addition, there may also be parameters related to the intelligent algorithm, such as sensitivity adjustment parameters, trend recognition thresholds, etc., which can be optimized through trial and error and backtesting to find the combination of parameters that best suits their trading style and market environment, improving the effectiveness of indicators and the accuracy of trading signals.
Fourth, the interpretation of trading signals

Trend signal: When the indicator's fill area is consistently blue and expanding, and the T3 moving averages are long (short-term moving averages above long-term moving averages), it indicates that the market is in a strong bullish trend, which is a clear buy signal or a signal to continue holding long positions. Conversely, if the filled area continues to be red and widened, and the moving average is short (the short-term moving average is below the long-term moving average), the market is in a short trend, which is a signal to sell or hold a short position.
Trend reversal signal: If the color of the filled area gradually changes from blue to red, and the short-term T3 moving average crosses the medium - and long-term moving average downward, this may indicate that the long trend is about to end and the short trend is about to begin, and is a potential sell signal that traders should consider closing long positions and establishing short positions in due course. Conversely, when the filled area turns from red to green and the short-term moving averages move up through the medium and long-term moving averages, it may signal a reversal of the short trend, prompting traders to look for buying opportunities.
Oscillating signal: When the market is in the oscillating range, the color of the filled area may change frequently, and the moving averages are intertwined, at this time, the market direction is not clear, and the signal sent by the indicator is more chaotic. In this case, traders should be cautious and avoid blindly trading according to the indicator signal, can be combined with other volatility indicators, such as Bollinger band, RSI, etc., or wait for the market trend to become clear before making trading decisions based on the indicator.
V. Advantages

Advantages:
Accurate trend judgment: With the advantages of T3 moving average and intelligent algorithm, it can accurately identify the main trend of the market, reduce the trading losses caused by misjudging the trend, and improve the success rate and profitability of the transaction.
Timely signal prompt: Through real-time monitoring of market data and dynamic adjustment of parameters, indicators can quickly respond to market changes and send trading signals in time, so that traders can grasp market opportunities in the first time to avoid missing the best entry and exit time.
Intelligent adaptation to market changes: Whether in the market with strong trends or in the market with frequent shocks, the AI algorithm of the indicator can automatically adapt to market conditions, adjust the performance of the indicator, provide relatively stable and reliable trading signals, and reduce the difficulty of traders who need to frequently adjust trading strategies due to changes in the market environment.
Intuitive visualization: The unique way of filling areas and moving averages display market trends and trading signals at a clear sight, which can be easily understood and applied even by novice traders without rich trading experience, helping to improve the decision-making efficiency and confidence of traders.
Prodotti consigliati
OtmScalpHedge
Otmane Achandir
OtmScalp EA V1 - Robot di Scalping IA per EUR, Oro & BTC OtmScalp EA V1 - Il Robot di Scalping Definitivo con IA per EUR, Oro e BTC Offerta limitata: Solo 499$ (Prezzo originale 1200$ - Aumento imminente!) Perché scegliere OtmScalp EA V1? Profitti giornalieri costanti - Progettato per uno scalping aggressivo ma controllato 3 versioni specializzate - Ottimizzate per le coppie EUR, l'oro (XAU/USD) e il Bitcoin (BTC/USD) Trading 100% automatizzato - Funziona 24h/5gg senza intervento Gestione intell
Copyright(c) 2019 Superfarabi EA Is the Scalping Forex Expert Advisor for MT4 Working on Timeframes (M5) Best Pair Recomended is EU/UChf=0.4 Calculation is based of Envelopes indicator ===========Rakyat +62 =========== Hak Cipta (c) 2019 Superfarabi EA Merupakan Scalping Forex Expert Advisor untuk MT4 Berjalan pada Time Frame Kecil (M5) Pair Rekomendasi adalah EU / UChf = 0,4 Perhitungan didasarkan pada indikator Envelopes
Gyroscopes
Nadiya Mirosh
Gyroscope        professional forex expert   (for EURUSD, GBPUSD, USDJPY, AUDUSD, USDCHF, EURGBP, EURJPY, NZDUSD, USDCAD, EURCHF, AUDJPY, CADJPY pairs)   alyzing the market using the Elliot Wave Index. Elliott wave theory is the interpretation of processes in financial markets through a system of visual models (waves) on price charts. The author of the theory, Ralph Elliott, identified eight variants of alternating waves (of which five are in the trend and three are against the trend). The mov
Koala Supply Demand
Ashkan Hazegh Nikrou
5 (2)
Presentazione dell'indicatore Koala Supply Demand per MetaTrader 4 (ti invitiamo a condividere la tua recensione o il tuo feedback, positivo o negativo, in modo che altri trader possano trarre vantaggio dalla tua esperienza.) : Benvenuti nell'indicatore Koala Supply Demand. Questo indicatore è progettato per identificare le zone di offerta e domanda ininterrotte. Questo indicatore può aiutare il trader a visualizzare il mercato come zone; è possibile vedere come il prezzo rispetti alcune potent
FREE
H4 GBPUSD Trend Scalper is a trend signal scalper The EA trades according to the trend strategy using original built-in indicator for opening and closing orders. The external inputs for limiting trading on Fridays and Mondays are available. The purpose of the strategy is to use the current trend with the most benefit. According to the results of testing and working on demo and real accounts, the best results achieved by using the Н4 timeframe on the GBP/USD pair Works on MetaTrader 4 Build 971+
Harvest GOLD
Sayan Vandenhout
Harvest GOLD USES THE TREND WAVE INDICATOR AND IT CAN IDENTIFY THE BEGINNING AND THE END OF A NEW WAVE TREND MOVEMENT. AS AN OSCILLATOR, THE INDICATOR IDENTIFIES THE OVERBOUGHT AND OVERSOLD ZONES. IT WORKS GREAT TO CATCH THE SHORT TERM PRICE REVERSALS AND USES A MARTINGALE STRATEGY TO CLOSE ALL TRADES IN PROFIT. USE DEFAULT SETTINGS ON H1 OR HIGHER TIME FRAME ON ANY PAIR FOR MORE ACCURATE TRADES WHY THIS EA : Smart entries calculated by 3 great strategies The EA can be run on even a $30000
BinaryUniversal
Andrey Spiridonov
BinaryUniversal is a signal indicator for binary options and Forex. In its work, the indicator uses a complex algorithm for generating signals. Before forming a signal, the indicator analyzes volatility, candlestick patterns, important support and resistance levels. The indicator has the ability to adjust the accuracy of the signals, which makes it possible to apply this indicator for both aggressive and conservative trading. The indicator is set in the usual way, it works on any time period and
ShinZuka
Muhammad Asyraf Bin Mohamad
Using MACD value for direction. Using RSI as reversal indicator. Using open trading hour. (Recommend Hour 10,11,15 & 19 : MT4-Time) Counter trade if signal failed. Cutloss trade if signal failed. Auto lot calculate based on target profit & takeprofit. Able to set counter trade value. Suitable for commodities & currency.  Timeframe H1. Able to set limit lot open. Able to select day to trade.
Magic EA MT4
Kyra Nickaline Watson-gordon
3 (1)
Magic EA is an Expert Advisor based on Scalping, Elliot Waves and with filters such as RSI, Stochastic and 3 other strategies managed and decided with the robot smartly. Large number of inputs and settings are tested and optimized and embedded in the program thus inputs are limited and very simple. Using EA doesn't need any professional information or Forex Trading Knowledge. EA can trade on all symbols and all time frames, using special and unique strategies developed by the author. The EA wo
Mk R
Can Pei Pu
MK_R It is based on contrary patterns for EURUSD.  Basically, it will entry using the condition of 1 buy wave and 6 sell wave of Granville's law. The EA does not use indicators, grid, martingale, arbitrage.  The EA has been proven to be profitable in the six months of 2020 and is particularly suitable for the current EURUSD market since mid-December 2020. Monitoring: https://www.mql5.com/en/signals/789229 Timeframe is M5. EA needs M1 chart,M5 chart,M15 Chart,H1 chart,H4 chart. Maxium Spread
Team Trading System     is based on the logic of order strategies and profit-taking strategies working as a team.  In general, EA consists of two parts as strategies and take profits section. Strategies section are special strategies that we create for symbols. Strategies continue to open buy and sell orders independently.  Takeprofits closes orders that are opened by working as a team. Take Profits logic is that profitable orders go by closing lost orders. They never work selfishly. In this wa
Crosskalp1
Mikhail Bilan
Добрый День уважаемые трейдеры!  Вашему вниманию индикатор созданный и работающий на базе трендовика ADX,  для торговли на смене направления движения который учитывает коррекцию и даёт возможность на ней заработать.  Применяю этот индикатор для скальпинга. Рекомендую таймфреймы от 15 ти минутного(М15) до часового (Н1) периодов.  Красный кружок сигнал на продажу- Sell) Зелёный кружок  сигнал на покупку Buy) Чем меньше ваш таймфрейм тем меньше пунктов вы зарабатываете.   Важно выставлять стопы! !В
Solemnity
Evgeniy Zhdan
The Expert Advisor identifies the beginning of a wave movement and starts working according to the direction of the new wave. It uses tight stop loss and take profit. Built-in protection against spread widening. Control of profit is performed by the tight trailing stop feature. Lot calculation is based on stop loss. For example, if stop loss is 250 points and MaxRisk = 10%, the lot size will be calculated in such a way that triggering the stop loss would lead to a loss equal to 10% of the deposi
Trendlines Chart Patterns Indicator (MT4) Automated Chart Patterns & Breakout Signals for MT4: Trade with Precision! The "Trendlines Chart Patterns Indicator" is an advanced trading tool for MetaTrader 4 (MT4) , meticulously designed to identify high-probability buy and sell signals based on dynamically forming, robust trend lines and popular chart patterns . This powerful forex indicator automates the complex process of identifying patterns like triangles, flags, ranges, ascending/descending tr
Multi Universal Robot
Oleksandr Klochkov
5 (1)
I want to bring to your attention a unique, one-of-a-kind adviser. Where you can create your own strategy from sets of indicators, patterns, candlestick patterns, regression direction (trend) and various customizable functions (grid, trailing, repeat move, etc.). Advisor functions: 1. Ability to enable one of the buy/sell/buy_sell directions 2. Fixed lot or percentage of the Deposit 3. TR-in pips or wave indicator  4. SL-in pips or wave indicator  5. SL support:      - trailing stop on p
Market Maestro: Your Ideal Partner for Automated Forex Trading If you're looking for a reliable assistant for trading in the currency market, Market Maestro is exactly what you need. This modern Forex bot is built using the latest technologies and algorithms, allowing it to effectively analyze market data and make informed trading decisions in real-time. Key Features of Market Maestro 1. Multicurrency Capability for Broad Opportunities Market Maestro can work with a wide range of currency pairs,
Auto Fibo Pro m
DMITRII GRIDASOV
Indicatore "Auto FIBO Pro" Crypto_Forex: è un ottimo strumento ausiliario nel trading! - L'indicatore calcola e posiziona automaticamente sul grafico i livelli di Fibo e le linee di tendenza locali (colore rosso). - I livelli di Fibonacci indicano le aree chiave in cui il prezzo può invertirsi. - I livelli più importanti sono 23,6%, 38,2%, 50% e 61,8%. - Puoi usarlo per lo scalping di inversione o per il trading di zone grid. - Ci sono molte opportunità per migliorare il tuo sistema attuale us
Santa Scalping
Morten Kruse
2.84 (19)
Santa Scalping is a fully automated Expert Advisor with no use of martingale. Night scalping strategy. The SMA indicator filter are used for entries. This EA can be run from very small accounts. As small as 50 EUR. General Recommendations The minimum deposit is 50 USD,  default settings reccomend for eurusd m5 gmt +2 . Please use max spread 10 if you will not have orders change it to -1. Use a broker with good execution and with a spread of 2-5 points. A very fast VPS is required, preferably w
Ict Gold Scalper
Alex Amuyunzu Raymond
ICTVALID EA – Smart Money Concepts Automated Trading The ICTVALID EA is a professional trading system built on Smart Money Concepts (ICT methodology) . It automatically detects and trades institutional setups, allowing you to follow market structure with precision and consistency.  Key Features Dual Trading Modes – Choose between Scalping (short-term precision entries) or Swing Trading (longer-term trends). Smart Money Logic – Incorporates Change of Character (CHoCH), Break of Structure (BoS),
Trend PA
Mikhail Nazarenko
5 (3)
The Trend PA indicator uses   Price Action   and its own filtering algorithm to determine the trend. This approach helps to accurately determine entry points and the current trend on any timeframe. The indicator uses its own algorithm for analyzing price changes and Price Action. Which gives you the advantage of recognizing, without delay, a new nascent trend with fewer false positives. Trend filtering conditions can be selected in the settings individually for your trading style. The indicator
This is the complete REX package. It consists of the lite, pro and ULTRA version.  Perfect for beginners and intermediates. REX complete is 100% non repaint. The strategy is based on a mix of different strategies, statistics, including pivot points, oscillators and patterns.  As the trading idea consists of a variety of some classic indicators like Momentum, Williams Percent Range, CCI, Force Index, WPR, DeMarker, CCI, RSI and Stochastic, it is clear that the fundamental indicators have being u
BSA Indicator
Ahmet Metin Yilmaz
BSA indicator is a ZigZag based indicator. This indicator is used to find the reversal level of the price. You can use the existing risk ratio and calculation timeframe in the entries by optimizing them according to your usage preference.  In lower time frames, the indicator can repaint. For healthier results, you can detect the least repainting by observing for a while according to the graphic you will apply.
Owl smart levels
Sergey Ermolov
4.24 (37)
Versione MT5  |  FAQ L' indicatore Owl Smart Levels   è un sistema di trading completo all'interno dell'unico indicatore che include strumenti di analisi di mercato popolari come i   frattali avanzati di Bill Williams , Valable ZigZag che costruisce   la corretta struttura a onde   del mercato, e i   livelli di Fibonacci che segnano i livelli esatti di entrata nel mercato e luoghi per prendere profitti. Descrizione dettagliata della strategia Istruzioni per lavorare con l'indicatore Consulente-
The indicator is designed to work on any trading platform. The program is based on proprietary algorithms and W.D.Ganna's mathematics, allowing you to calculate target levels of price movement based on three points with the highest degree of certainty. It is a great tool for stock trading. The indicator has three buttons: NEW - call up a triangle for calculation. DEL - delete the selected triangle. DELS - completely remove all constructions. The probability of achieving the goals is more than 80
GeoWprPro
Georgij Komarov
WPR by Profile, or WPR for Professionals Geo_WprPro is one of the well-known currency profile indicators. It simultaneously displays two WPR indicators with different parameters in the matrix form on all timeframes of multiple currency pairs forming the currency profile . As follows from the description, " WPR is a leading indicator that often goes ahead of the price chart. The oscillator frequently reaches extreme values before the price reversal as if anticipating that event: it almost always
Italo Trend Indicator
Italo Santana Gomes
4.76 (33)
BUY INDICATOR AND GET EA FOR FREE AS A BONUS + SOME OTHER GIFTS! ITALO TREND INDICATOR  is the best trend indicator on the market, the Indicator works on all time-frames and assets, indicator built after 7 years of experience on forex and many other markets. You know many trend indicators around the internet are not complete, does not help, and it's difficult to trade, but the Italo Trend Indicator is different , the Italo Trend Indicator shows the signal to buy or sell, to confirm the signal t
This Indicator is use the ZigZag to calculate the Upper and  Lower Bound and the uptrend and the downtrned. Red for downtrend, Green for uptrend and Yellow is for the horizontal trend this horizontal trend also bookmarked the upper limited and the lower limited the the price swings.  Or in simple the Support and the Resistance level. However, You may use the Heikin Ashi to confirm the trend of the buy sell signal above. I cannot guarantee the win rate, Nevertheless, you must study well the timef
PipFinite EA Breakout EDGE
Karlo Wilson Vendiola
5 (5)
The Official Automated Version of the Reliable Indicator PipFinite Breakout EDGE EA Breakout EDGE takes the signal of PipFinite Breakout EDGE indicator and manages the trade for you. Because of numerous financial instruments to consider, many traders want the signals to be fully automated. The EA will make sure all your trades are executed from entry to exit. Saving you time and effort while maximizing your profits. The Edge of Automation Effortless price action trading is now possible acros
A simplistic indicator informing a user on RSI divergence by sending messages to mobile device and email. The indicator draws 2 vertical lines, marking two RSI extrema that formed the divergence. You get the alert, open the charts and make a decision. The indicator does not show past divergences, thus when you attach it to a chart for the first time you see nothing. Graphics and alerts will appear as soon as divergences do. Drop it in Tester to see how it works. Parameters: RSIPeriod - number of
Get rid of trading confusion and embrace stable income! Are you still worried about finding a low-risk and stable profit method? Are you still anxious about judging the market direction and controlling the risk of placing orders? The new cross-platform arbitrage indicator helps you easily achieve stable returns! Accurately capture arbitrage opportunities without you having to worry! The cross-platform arbitrage indicator is a powerful tool that can monitor the price differences of the same finan
Gli utenti di questo prodotto hanno anche acquistato
Rtc ML Ai Predictor MT4
Muhammad Faisal Sagala
Product Description Rtc ML Ai Predictor — Futuristic Intelligence for Real-Time Market Decisions Bring robotic precision to your trading.   Rtc ML Ai Predictor   fuses   Machine Learning   with   SMA-shift dynamics   to forecast short-term momentum and trend inflection points with clarity. The model evaluates multi-factor market structure, assigns a   confidence score   to each signal, and lets you act only when conditions align with your rules. Why traders choose Rtc ML Ai Predictor AI-guided e
FFx Engulfing Setup Alerter gives trade suggestions with Entry, Target 1, Target 2 and StopLoss. Below are the different options available: Entry suggestion - pips to be added over the break for the entry 3 different options to calculate the SL - by pips, by ATR multiplier or at the pattern High/Low 3 different options to calculate the 2 TPs - by pips, by ATR multiplier or at Risk/Reward Offset the dashboard - any place on the chart Remove the suggestion once the price reached the SL line Lines
FFx InsideBar Setup Alerter gives trade suggestions with Entry, Target 1, Target 2 and StopLoss. Below are the different options available: Entry suggestion - pips to be added over the break for the entry Minimum candle size - to avoid too close buy/sell entry suggestions 3 different options to calculate the SL - by pips, by ATR multiplier or at the pattern High/Low 3 different options to calculate the 2 TPs - by pips, by ATR multiplier or at Risk/Reward Offset the dashboard - any place on the c
FFx OutsideBar Setup Alerter gives trade suggestions with Entry, Target 1, Target 2 and StopLoss. Below are the different options available: Entry suggestion - pips to be added over the break for the entry. 3 different options to calculate the SL - by pips, by ATR multiplier or at the pattern High/Low. 3 different options to calculate the 2 TPs - by pips, by ATR multiplier or at Risk/Reward. Offset the dashboard - any place on the chart. Remove the suggestion once the price reached the SL line.
FFx PinBar Setup Alerter gives trade suggestions with Entry, Target 1, Target 2 and StopLoss. Below are the different options available: Entry suggestion - pips to be added over the break for the entry Minimum candle size - to avoid too small candles 3 different options to calculate the SL - by pips, by ATR multiplier or at the pattern High/Low 3 different options to calculate the 2 TPs - by pips, by ATR multiplier or at Risk/Reward Offset the dashboard - any place on the chart Remove the sugges
The purpose of this new version of the MT4 standard indicator provided in your platform is to display in a sub-window multiple timeframes of the same indicator with its divergences. See the example shown in the picture below. But the display isn't like a simple MTF indicator. This is the real display of the indicator on its timeframe. Here's the options available in the FFx divergences indicator: Select the timeframes to be displayed (M1 to Monthly) Define the width (number of bars) for each tim
The purpose of this new version of the MT4 standard indicator provided in your platform is to display in a sub-window multiple timeframes of the same indicator with its divergences. See the example shown in the picture below. But the display isn't like a simple MTF indicator. This is the real display of the indicator on its timeframe. Here's the options available in the FFx divergences indicator: Select the timeframes to be displayed (M1 to Monthly). Define the width (number of bars) for each ti
The FFx Dashboard MTF alerter will show you on a single chart all the timeframes (M1 to Monthly) with their own status for the indicator. 2 Alert Options: Single timeframe: each selected timeframe alert separately when a signal occurs Multi timeframes: all selected timeframes must agree for an alert to be triggered Both options have an input to select the timeframes to be used for the alert(s). How to Understand the Status: Green/Red square: histogram above/below 0 line Green square + Red bord
The FFx Dashboard MTF alerter will show you on a single chart all the timeframes (M1 to Monthly) with their own status for the indicator. 2 Alert Options: Single timeframe: each selected timeframe alert separately when a signal occurs Multi timeframes: all selected timeframes must agree for an alert to be triggered Both options have an input to select the timeframes to be used for the alert(s). How to understand the status: Green/Red square: RSI above/below 50 line Green square + Red border: R
The FFx Dashboard MTF alerter will show you on a single chart all the timeframes (M1 to Monthly) with their own status for the indicator. 2 Alert Options: Single timeframe: each selected timeframe alert separately when a signal occurs Multi timeframes: all selected timeframes must agree for an alert to be triggered Both options have an input to select the timeframes to be used for the alert(s). How to understand the status: Green/Red square: Stoch above/below 50 line Green square + Red border:
The FFx Dashboard MTF alerter will show you on a single chart all the timeframes (M1 to Monthly) with their own status for the indicator. 2 Alert Options: Single timeframe: each selected timeframe alert separately when a signal occurs Multi timeframes: all selected timeframes must agree for an alert to be triggered Both options have an input to select the timeframes to be used for the alert(s). How to understand the status: Green/Red square: Price above/below Cloud (Kumo) Green square + Red bo
The FFx Dashboard MTF alerter will show you on a single chart all the timeframes (M1 to Monthly) with their own status for the indicator. 2 Alert Options: Single timeframe: each selected timeframe alert separately when a signal occurs Multi timeframes: all selected timeframes must agree for an alert to be triggered Both options have an input to select the timeframes to be used for the alert(s). How to understand the status: Green/Red square: MA pointing Up/Down Green square + Red border: MA po
The FFx Dashboard MTF alerter will show you on a single chart all the timeframes (M1 to Monthly) with their own status for the indicator. 2 Alert Options: Single timeframe: each selected timeframe alert separately when a signal occurs. Multi timeframes: all selected timeframes must agree for an alert to be triggered. Both options have an input to select the timeframes to be used for the alert(s). How to understand the status: Green square: Price above PSAR Red square: Price below PSAR Options
The FFx Dashboard MTF alerter will show you on a single chart all the timeframes (M1 to Monthly) with their own status for the indicator. 2 Alert Options: Single timeframe: each selected timeframe alert separately when a signal occurs Multi timeframes: all selected timeframes must agree for an alert to be triggered Both options have an input to select the timeframes to be used for the alert(s). How to understand the status: Green/Red square: CCI above/below levels (ie. 100/-100) Grey square: C
The FFx Dashboard MTF alerter will show you on a single chart all the timeframes (M1 to Monthly) with their own status for the indicator. 2 Alert Options: Single timeframe: each selected timeframe alert separately when a signal occurs Multi timeframes: all selected timeframes must agree for an alert to be triggered Both options have an input to select the timeframes to be used for the alert(s). How to understand the status: Green/Red square: ADX above level Grey square: ADX below level Red bor
The FFx Dashboard MTF alerter will show you on a single chart all the timeframes (M1 to Monthly) with their own status. 2 Alert Options: Single timeframe: each selected timeframe alert separately when a signal occurs Multi timeframes: all selected timeframes must agree for an alert to be triggered Both options have an input to select the timeframes to be used for the alert(s). How to understand the status: Green/Red square: bullish/bearish candle Options available in the FFx Dashboard Alerter
The [GRAFF] III manual trading system is based on multiple MetaTrader (MT4) indicators. Together, the entire PACK of GRAFF III indicators makes an advanced trading tool. The system consists of over 20 different custom-built indicators which have been carefully selected and tested in the long term to produce strong and efficient trading signals. The particular indicators are based on different mathematical formulas, so the entire system is calibrated to remove false signals from its own indicator
FFx Universal Strength Meter PRO is more than a basic strength meter. Instead of limiting the calculation to price, it can be based on any of the 19 integrated strength modes + 9 timeframes. With the FFx USM, you are able to define any period for any combination of timeframes. For example, you can set the dashboard for the last 10 candles for M15-H1-H4… Full flexibility! Very easy to interpret... It gives a great idea about which currency is weak and which is strong, so you can find the best pai
Pan PrizMA CD Phase is an analogue of the МetaТrader 5 indicator , and is an option based on the Pan PrizMA indicator. Details . Averaging by a quadric-quartic polynomial increases the smoothness of lines, adds momentum and rhythm. Extrapolation by the sinusoid function near a constant allows adjusting the delay or lead of signals. The value of the phase - wave status parameter (which is close in meaning to the trigonometric phase or the angle of the radius-vector rotation in the trigonometric p
Green Wall Arrows
Daniel Luchinger
1 (1)
The Name Green Wall : Arrows hits a lot of TP, by changing the idea of non using SL as something bad, but instead use Small TP and a lot of free Margin and Patience. Use micro TP and a lot of Free Margin with this indicator on Forex. It also can be used with Binary Options. This strategy is intended to be traded Manually. This Indicator runs on Open Bar, arrows will delete when price are against it. The only Indicator Parameter is Alerts true/false, all the rest is included inside the code. Arro
Golden Monowave
Ahmed Mohamed Ali
Golden Monowave is monowave indicator, the monowave theory is one of Elliott wave approach and one of most complicate and accurate method. Golden Monowave can shortcut many major steps to identify and describe the monowave. It works on any timeframe and with any trading instrument, including currencies, indices, futures, etc. Input Parameters initial_Bars - set the initial number of bars to calculate. wave_color - select the color of the wave. label_color - select the color of labels. temp_labe
Ticks Size
Viktor Kolmakov
This indicator displays in a separate window the difference between the number of points which increased the price, and the number of points that decreased the price during the time interval specified in the settings. The time interval for calculation is expressed as the number of bars of the chart the indicator is attached to. This approach allows you to evaluate the movement direction (growth or fall) of the instrument's price, the strength of the movement and the size of the movement in point
FFx Basket Scanner
Eric Venturi-Bloxs
MetaTrader 5 version available here : https://www.mql5.com/en/market/product/24882 FFx Basket Scanner is a global tool scanning all pairs and all timeframes over up to five indicators among the 16 available. You will clearly see which currencies to avoid trading and which ones to focus on. Once a currency goes into an extreme zone (e.g. 20/80%), you can trade the whole basket with great confidence. Another way to use it is to look at two currencies (weak vs strong) to find the best single pairs
NostradamusMT4
Andrey Spiridonov
1 (1)
NostradamusMT4 is a powerful indicator from the set of professional trader. The indicator is based on Andrei Spiridonov's original price calculation method (ESTIMATED PRICE) for the current candle price. Advantages The indicator does not redraw. It works on any timeframes. Works with any trading instruments. Perfectly suitable for scalping and trading binary options. Parameters Color - color of the ESTIMATED PRICE FUTURE line. How to work with the indicator The indicator forms the ESTIMATED P
MetaTrader 5 version available here: https://www.mql5.com/en/market/product/25794 FFx Pivot SR Suite PRO is a complete suite for support and resistance levels. Support and Resistance are the most used levels in all kinds of trading. Can be used to find reversal trend, to set targets and stop, etc. The indicator is fully flexible directly from the chart 4 periods to choose for the calculation: 4Hours, Daily, Weekly and Monthly 4 formulas to choose for the calculation: Classic, Camarilla, Fibonac
BinaryIndicator
Andrey Spiridonov
BinaryIndicator is a highly accurate indicator for trading binary options. It shows excellent results in scalping. This indicator is based in multifactor analysis of trend indicators, as well as confirmation oscillators, which in the end gives an increased accuracy of signals. Advantages of the indicator Increased accuracy of signals. Excellent results when trading binary options with a short expiration time from M30 to M1 . It works on any timeframes. Works with any trade symbols. Parameters
BinaryScalping
Andrey Spiridonov
BinaryScalping is a professional indicator for trading binary options and scalping. The algorithm of the indicator is based on the calculation of pivot points for each time period separately, the location of the price of the trading instrument relative to the pivot points is analyzed and the probability of a trading operation is calculated. The indicator has a built-in filter of trading signals based on the global trend. The indicator is installed in the usual way and works with any trading inst
Altri dall’autore
本EA通过智能AI程序筛选符合条件的订单,以毫秒级极速按使用者任意条件进行平仓; 帮助交易员快速 平盈利单:平仓该图表品种所有盈利的单,获得利润; 帮助交易员快速 平亏损单:平仓该图表品种所有亏损的单,截断亏损; 帮助交易员快速 SELL平仓:平仓该图表品种所有SELL的单,快速解套锁仓; 帮助交易员快速 BUY平仓:平仓该图表品种所有BUY的单, 快速解套锁仓; 帮助交易员快速 全部平仓:平仓该图表品种所有单,快速落袋为安。 智能快速平仓面板:共五个按钮 平盈利单:平仓该图表品种所有盈利的单 平亏损单:平仓该图表品种所有亏损的单 SELL平仓:平仓该图表品种所有SELL的单 BUY平仓:平仓该图表品种所有BUY的单 全部平仓:平仓该图表品种所有单
Arresto automatico: L’eea utilizza un programma avanzato di intelligenza artificiale, Seguire in tempo reale le ordinazioni del grafico, — la cattura esatta degli ordini di pagamento con i grafici caricati, La EA aggiunge automaticamente all’ordine — notevole risparmio di tempo da parte dei commercianti Inoltre, aggiungere un paravento protettivo ai commercianti che si sono dimenticati di porre fine all’inattività. Raccomandazioni: Cambio di valuta: moneta Periodo: qualsiasi Deposito mi
The main function of this EA: use AI to quickly capture the price of the order, batch modify the stop profit and stop loss to the specified price position. For example, you have 5 buy orders for XAUUSD, and the opening prices are 2510, 2508, 2506, 2504, 2495 respectively. You can modify the stop profit to 2530 and the stop loss to 2480 through this EA batch. Good luck with your deal! Wechat: FX-AIEA QQ: 2813871972 Email: lxy284628@163.com Wechat public account: Xinyou Jinke FXAIEA.com Welcome
江恩理论 江恩理论是金融市场分析中的一种重要工具,它基于市场周期性和自然法则的假设,通过特定的技术分析工具来预测市场走势。江恩理论的主要内容包括: 市场周期 :江恩认为市场存在周期性波动,这些周期可以通过特定的时间周期和价格周期来识别。 价格和时间 :江恩理论强调价格和时间之间的相互作用,认为两者是市场分析的关键要素。 江恩角度线 :这是江恩理论中的一种重要技术分析工具,用于识别市场的支撑和阻力水平。 江恩轮中轮 :又称“江恩圆形图”,是江恩发明的另一种重要技术分析工具,用于预测市场的未来走势。 量化分析 :T3指标可能通过特定的数学模型或算法来量化市场的行为或特征。 趋势识别 :T3指标可能用于识别市场的趋势方向,包括上升趋势、下降趋势或横向整理。 交易信号 :基于T3指标的分析,投资者可能能够获得买入或卖出的交易信号。
Arbitrage Indicators is a professional and easy-to-use Forex trading indicator that uses the best trading principles of the latest AI arbitrage models. This indicator provides accurate buy and sell signals. Applies to currency pairs only. It has six different metrics options, MACD, KDJ, RSI, CCI, RVI, DEMARK. It can be freely switched by users, and intuitively shows the direction and reversal signal of the currency pair. When the two lines cross colors, the currency has a high probability of rev
AI Fibonacci Indicators (Non-Redraw) is a professional and easy-to-use AI fully automated Fibonacci generator Forex trading indicator that uses the latest AI technology to automatically identify accurate Fibonacci positions on charts and automatically plot them on charts. This indicator provides accurate Fibonacci important price positions. Applicable to any currency pair and other products. It has seven function switches, There are five different Fibonacci types (" Fibonacci retracement line "
Two line MACD index composition MACD line (express line) : Usually calculated by subtracting the 12-cycle EMA from the 26-cycle EMA, it is more sensitive to price changes, can quickly reflect the change of the recent price trend, its fluctuation is relatively frequent, used to capture the dynamics of short-term market trends. Signal line (slow line) : Generally a 9-cycle EMA of the MACD line, its role is to smooth the MACD line, filter out some short-term noise and false signals, make the indic
AI Supertrend timely alerts MT4 Super Trend timely reminder indicator introduction I. Overview of indicators The MT4 Super Trend Alert Indicator is a technical analysis tool specifically designed for the MetaTrader 4 platform to help traders accurately capture changes in market trends and send timely signals to alert traders to potential trading opportunities. It is based on a unique AI-based algorithm that takes into account factors such as price volatility, trend strength, and market volatil
MT4CandleTime index introduction MT4CandleTime is an indicator for the MT4 platform, which can display the remaining time of the current K line in the form of an intuitive digital countdown, which is convenient for traders to grasp the trading rhythm. Precise time control: The MT4CandleTime indicator provides traders with extremely accurate K-line remaining time data, enabling them to fine manage the time rhythm in the trading process, avoiding the hasty or delayed trading decisions caused by
Introduction to the use of MT4 platform AI Color Gradient Volume indicators I. Overview of indicators AI Color Gradient Volume is an innovative volume analysis indicator based on artificial intelligence technology for the MT4 platform. By converting the volume data into an intuitive color gradient graph, it helps traders to have a more acute insight into the inflow and outflow of funds in the market and the strength of the buying and selling forces, so as to provide strong support for trading
MT4 ATR Stops indicator introduction: This is a dynamic support resistance indicator based on average true volatility (ATR) that calculates the volatility of the price, plots the channel on a K chart, and suggests trading timing with intuitive color and dot-like signals. Open and close positions 1. Go long (go long) Signal feature: The color of the K line changes to green, and a green dot appears on the chart. Logic: Price broke above the dynamic upper track resistance calculated by ATR, indica
This "MT4 Auto Delete Pending Orders by Timeframe" EA is a high-tech trading efficiency tool designed for modern traders. It does not perform any trading or decision-making. ​ It fundamentally solves the core pain point in traditional trading where forgotten pending orders or sudden market changes lead to tied-up capital and missed new opportunities, by automatically managing order expiration . ️ Core Working Principle: Intelligent Pending Order Management The core of this EA lies in its intell
MT4 Time-Based Auto Close System EA ​ is an intelligent time-algorithm-based automated order management trading tool. Utilizing a high-tech decision-making engine, it automatically executes precise closing operations when preset holding periods expire, designed to help traders maintain strict trading discipline and avoid emotional interference   . Core Closing Modes The five core closing modes you mentioned form the cornerstone of this EA's strategic logic, allowing flexible configuration base
The main function of this EA: Quick batch modification stop profit stop loss to the specified price position. For example: you have five XAUUSD  BUY orders, the opening price is 2510, 2508, 2506, 2504, 2495you can through this EA, batch unified change the profit is 2530, stop loss is 2480.Good luck with your deal! Wechat:FX-AIEA QQ:2813871972 Email:lxy284628@163.com Wechat public account: Xinyou Jinke FXAIEA.com Welcome to your attention ( Xinyou Jinke FXAIEA.com) Around A1, big data, cloud com
Arrow Trend indicators Trading with the trend is often one of the most basic pieces of advice given by experienced traders. In addition, experienced traders will often advise traders to prioritize the long-term trend, as prices usually follow the direction of the long-term trend. Arrow trend indicators are tools that traders can use to determine the direction of a trend toward a long-term trend. What is an arrow trend indicator? An arrow trend indicator is a trend-following technical indicator
This EA will not automatically open the position, open the position needs the user manually!! MT5 position profit/loss up to the set amount of automatic closing EA\n will open the position is the apprentice, will close the position is the master, when all your order profit reaches the amount you set, the ea will automatically help you to close the position in bulk, the loss value will also be all closed Recommended time frame: Any time frame will work, but we like to use the M5, M15, M30 and H1
This "MT5 Auto Delete Pending Orders by Timeframe" EA is a high-tech trading efficiency tool designed for modern traders. It does not perform any trading or decision-making. ​ It fundamentally solves the core pain point in traditional trading where forgotten pending orders or sudden market changes lead to tied-up capital and missed new opportunities, by automatically managing order expiration . ️ Core Working Principle: Intelligent Pending Order Management The core of this EA lies in its intell
MT5 Time-Based Auto Close System EA ​ is an intelligent time-algorithm-based automated order management trading tool. Utilizing a high-tech decision-making engine, it automatically executes precise closing operations when preset holding periods expire, designed to help traders maintain strict trading discipline and avoid emotional interference   . Core Closing Modes The five core closing modes you mentioned form the cornerstone of this EA's strategic logic, allowing flexible configuration base
Filtro:
Nessuna recensione
Rispondi alla recensione