DashBoard Multi TimeFrame

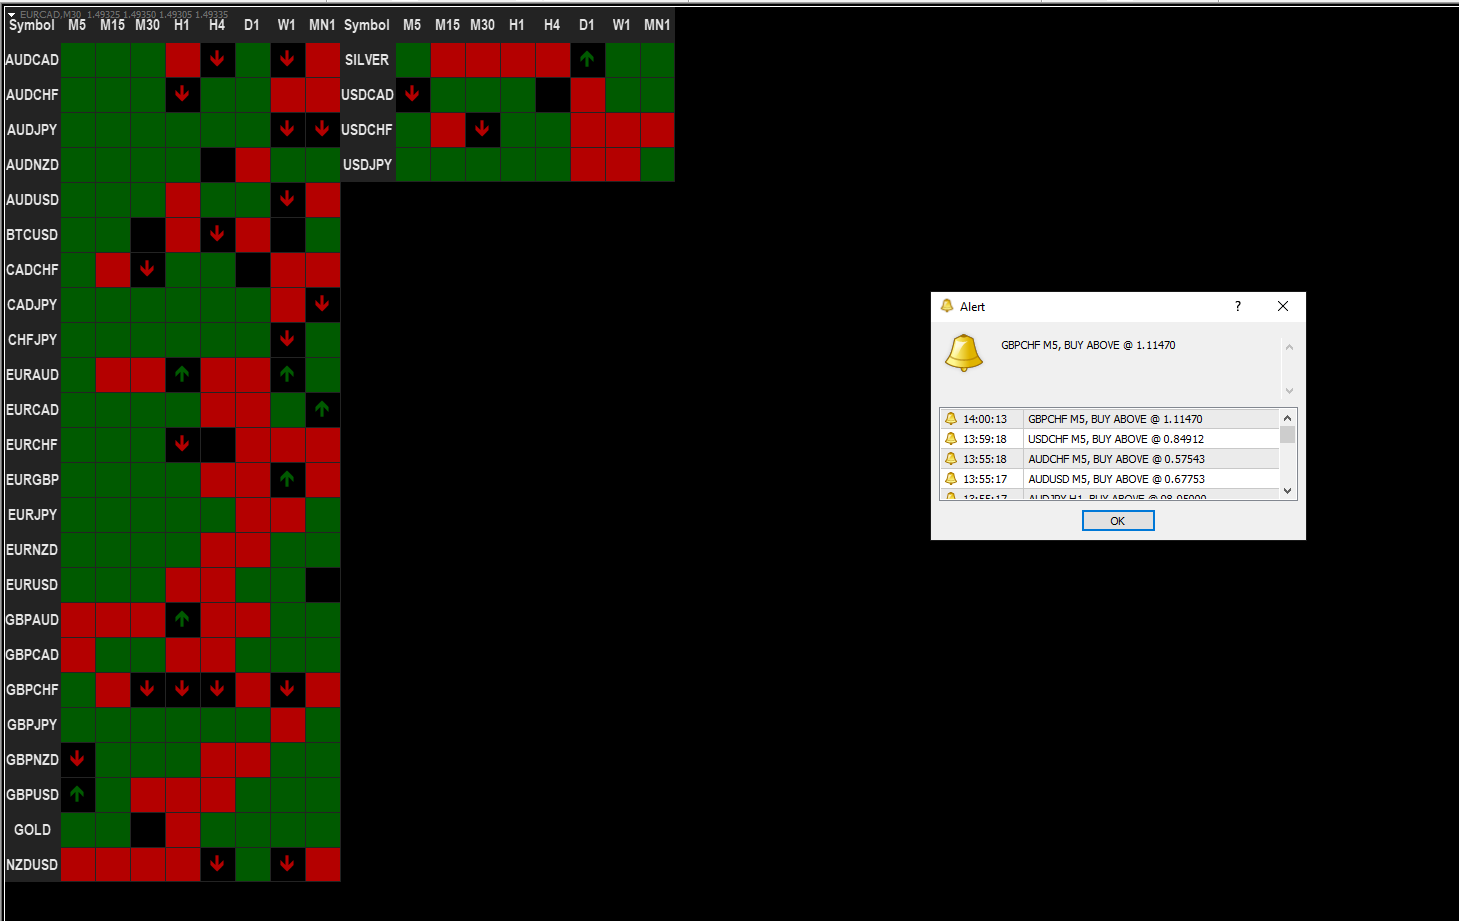
This indicator (dashboard) provides trend for multi currency on multi timeframe Charts.

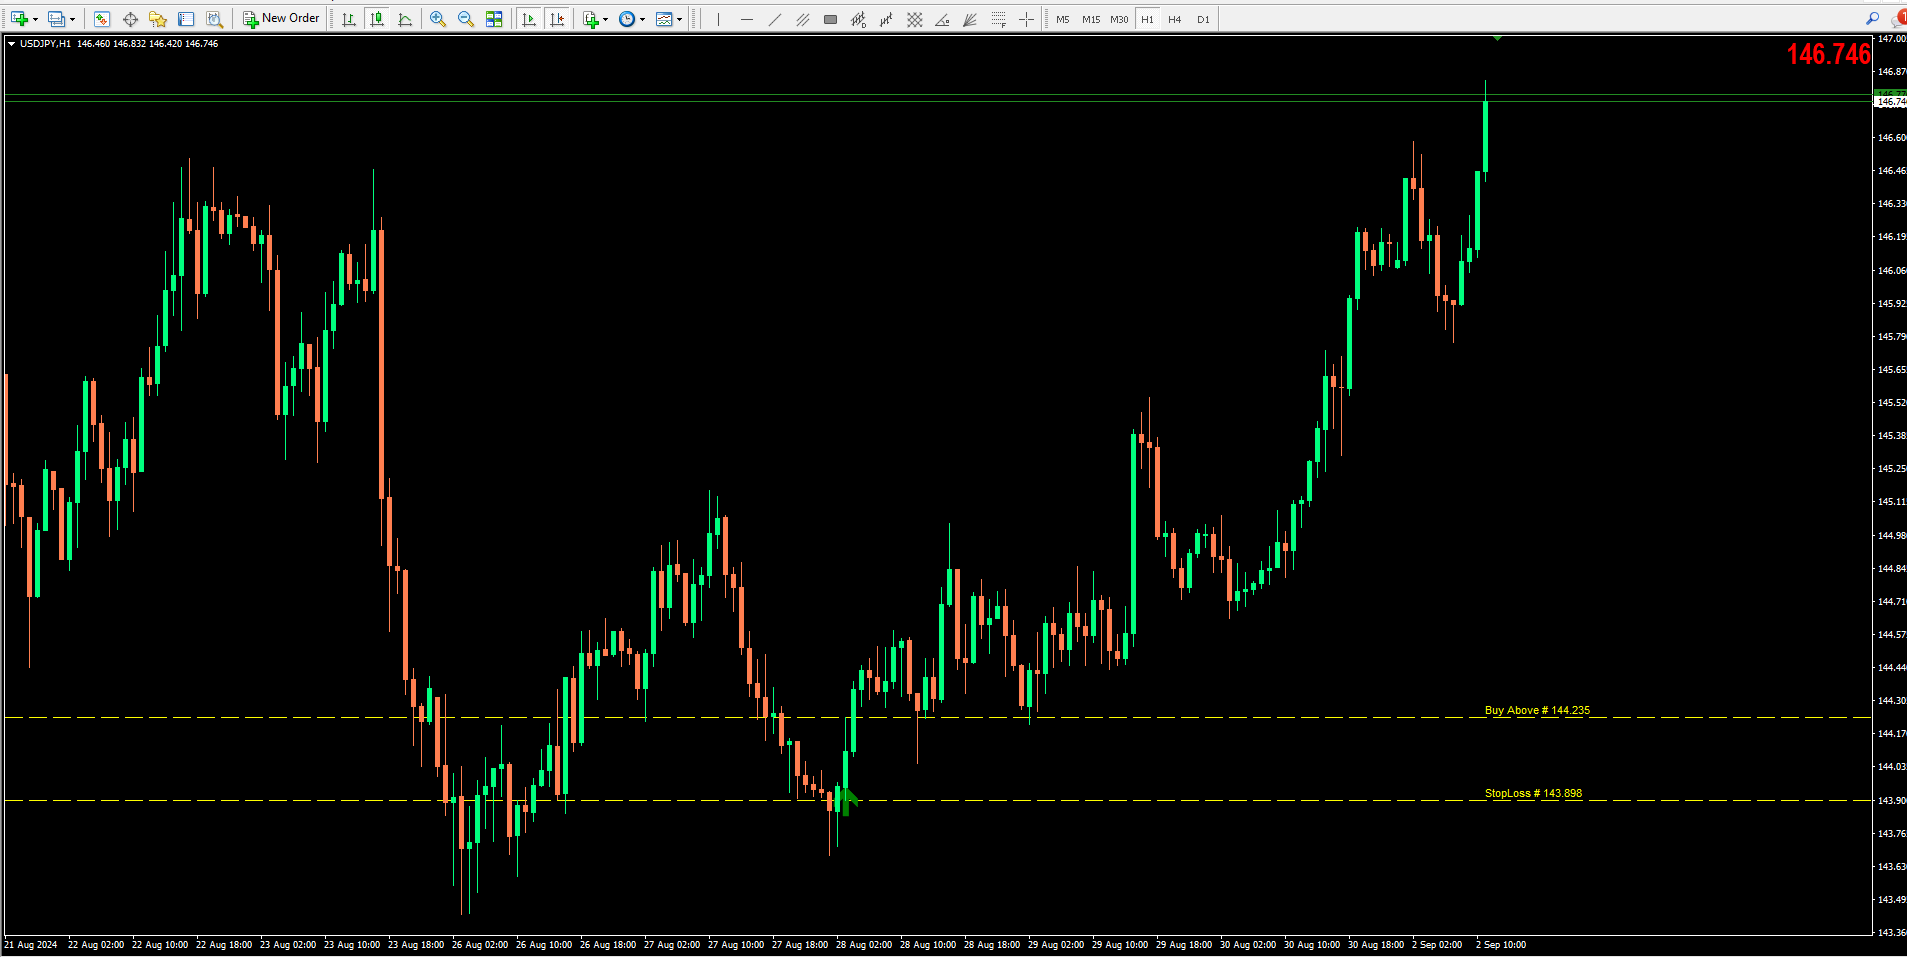
It gives entries and Stoploss on the chart itself 

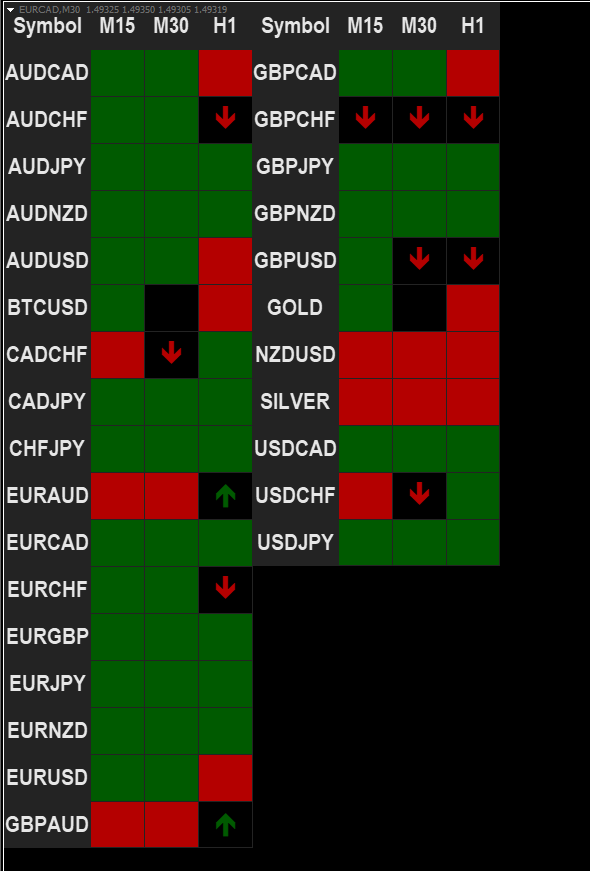
if the currency pair is uptrend then the cell color is displayed as Green and if its downtrend the cell displays the color as Red.If the cell colour  displayed on particular currency is green it represents strong uptrend and vice versa if the cell colour is Red.If the cell has just an arrow it means the currency is ready for the trend.If the cell has neither colour or nor arrow it represents there is no trend on that time frame .

Alerts are generated whenever the trend changes on that particular timeframe.

can customize the time frames as desired

Will provide the best settings and send you the document on how to use this dashboard once the product has been rented or purchased.

This product supports all time frames and can accommodate upto 100 symbols.

Works on any currency or stock or commodity...

Prodotti consigliati
DMS Fibo
Diogo Mitsunaga Dos Santos
Fibonacci retracements are trend lines drawn between two significant points, usually between absolute lows and absolute highs, plotted on a chart. Intersecting horizontal lines are placed at the Fibonacci levels. Fibonacci retracements are useful tools that help traders identify support and resistance levels. With the information gathered, they can place orders, identify stop-loss levels, and set price targets. Although useful, traders often use other indicators to make more accurate assessments
Nice Try Super Diddy Trend – an innovative technical analysis tool designed for experienced traders seeking a deep understanding of market dynamics. This indicator utilizes complex algorithms to calculate liquidity flows and momentum, identifying potential reversal points and trend continuations. Uniqueness and Value Nice Try Super Diddy Trend is more than just signal generation—it analyzes the hidden structure of the market, examining the amplitude of price fluctuations and directionality while
About
Tatiana Savkevych
About - Forex indicator. This trend indicator is used to determine the current trend in price movement, making it clear in which direction it is better to open a position: buy or sell. The About trend indicator is displayed on the chart and moves in parallel with the price. The Forex About trend indicator allows you to determine in time a change in the direction of price movement, thereby minimizing the likelihood of capital loss. In trading practice, various combinations of About and other ind
**Presentando il Sistema Binario Intelligente: Il Tuo Compagno di Trading Definitivo** Il Sistema Binario Intelligente non è solo un indicatore; è uno strumento di trading sofisticato progettato meticolosamente per fornire ai trader una precisione accurata e segnali tempestivi in ​​diversi mercati. Costruito su algoritmi all'avanguardia e una collezione esaustiva di indicatori tecnici, questo sistema è la tua chiave per sbloccare il successo nel trading. **Componenti dell'Indicatore:** 1. **
SilentLevels
Barakah Muslih B Alharbi
One of the key elements in trading is identifying zones or levels that allow traders to make buy or sell decisions during trading. أحد العناصر الأساسية في التداول هو تحديد المناطق أو المستويات التي تسمح للمتداولين باتخاذ قرارات الشراء أو البيع أثناء التداول. The indicator displays Fibonacci levels يعرض المؤشر مستويات فيبوناتشي  drawing levels based on historical daily or weekly data. مستويات الرسم بناءً على البيانات التاريخية اليومية أو الأسبوعية. Daily levels update with each new day’s opening
Fibonacci Retracements Pro
Savia Forex Software Solutions
Fibonacci Retracements Pro The Fibonacci Retracements Pro is a powerful yet easy to use indicator. It automatically plots all the important Fibonacci retracement and extension levels for you. FRP is dynamic powerful and seamlessly adjusts to whatever timeframe you are analyzing. Fibonacci Retracement Pro is optimized for ALL timeframes and ALL Currency pairs, Indices, Commodities, and Cryptocurrency pairs. Trade with improved confidence and maximize your success rate. Benefits Dynamic and Power
PROSPERIUM   è un indicatore tecnico completo, sviluppato per trader che cercano la massima affidabilità nell'analisi e nell'esecuzione delle operazioni. Creato per MetaTrader 4 e 5, combina diversi indicatori affermati (RSI, OBV, MACD, Bande di Bollinger, ADX, Ichimoku e Media di Gravità) in un sistema integrato di generazione di segnali di acquisto (CALL) e vendita (PUT). Con un pannello statistico avanzato e il calcolo automatico della percentuale di successo, PROSPERIUM fornisce una visione
TR Basket AI Pro
Meshari F M Alkhawaled
TR BASKET AI – Capital Protection Grid System (Professional Edition) A professional basket trading system designed for capital-based accounts. Focused on risk control, profit protection, and institutional-style trade management . TR BASKET AI is a professional-grade basket trading system built for traders and investors who prioritize capital protection, controlled drawdown, and structured risk management over aggressive speculation. This system is not designed for small or high-risk account
This indicator draws Fibonacci level automatically from higher high to lower low or from lower low to higher high. With adjustable Fibonacci range and has an alert function. How to use Fibonacci Risk Reward Ration (R3) into trading strategy Forex traders use Fibonacci-R3 to pinpoint where to place orders for market entry, for taking profits and for stop-loss orders. Fibonacci levels are commonly used in forex trading to identify and trade off of support and resistance levels. Fibonacci retracem
TPO Profile MT4
Kyra Nickaline Watson-gordon
5 (1)
Definition : TPO is a Time Price Opportunity. Instead of using bars or candles with an Open, High, Low, and Close price, each "bar" in a Market Profile is represented by horizontal bars against the price It is called Market Profile terminology. In other words time-price-opportunity (TPO) profiles are histograms of how much time was spent at each price within the span of the profile. By using a TPO chart, you are able to analyze the amount of trading activity, based on time, for each price level
SindiX Margin Index
Ahmad Amiruldin A Sindi
this indicator will help you see the following : first , price levels that shows : 1. breakeven level for all open positions ( BEA shown in blue line ) 2. breakeven level for all open buy positions ( BEB shown in green line ) 3. breakeven level for all open sell positions ( BES shown in red line ) 4. draw a line at Margin level 100% ( violet color line ) 5. draw a line at Margin call level ( violet color line ) 6. draw a line at StopOut ( violet color line ) second , to the left : 1. it will s
Robot scalper per timeframe M5. Negozia sulla coppia di valute GBPUSD. Questo robot è stato sviluppato appositamente da un'azienda di trader professionisti per il trading con la sterlina. Il robot apre approssimativamente da 5 a 15 operazioni al giorno. È meglio fare trading con broker che hanno uno spread basso su GBPUSD fino a 10 pip. Il deposito minimo consigliato per iniziare è di $ 500 o più. vantaggi: non usa martingala. non una rete. ogni operazione ha uno stop loss. bot professionale s
Trend Analysis in act
Ihab Mohamed Kamal Fouda
The Trend Analysis Indicator is an innovative tool designed for traders and investors who seek to navigate the complexities of the financial markets with greater precision and insight. This powerful indicator is engineered to adeptly identify whether a market is trending or not, offering users a vital edge in their trading strategy. Key Features: Accurate Trend Detection : The core functionality of the Trend Analysis Indicator lies in its ability to accurately detect market trends. It analyzes p
AI Forecast MT4
Leonardo Antonio Camacaro Armas
The "AI Forecast" indicator is the result of a unique experiment in which I asked an AI how to create the best indicator to anticipate the market. The AI suggested measuring the past history of the price and its reactions to different levels, and then calculating the probabilities of the price reaction in the future. With this idea, I designed with the help of another AI the "AI Forecast" indicator, which adapts to any MetaTrader chart and shows you three lines: one for entry and two for possi
https://youtu.be/Cz76GayNqtM  Com esse indicador você não precisa ficar fazendo marcações manuais para encontrar seus canais e níveis de negociação. O channels faz isso por você. Veja o vídeo :  Com os canais definidos o trade pode operar seus rompimentos  Analisando seu canal de referencia e zona neutra com base na tendencia e nos rompimentos. Tem uma calibragem nas opções onde você consegue estreitar ou alargar mais o canal. Pode definir as cores automáticas das linhas, seus estilos e tamanhos
BINARYEXPERT è un indicatore tecnico potente, progettato per i trader che cercano segnali di ingresso precisi nel mercato delle opzioni binarie. Sviluppato per MetaTrader 4, combina diversi indicatori tecnici, tra cui EMA, RSI, MACD, Stocastico e ATR, per generare segnali affidabili di CALL e PUT. Con un'interfaccia user-friendly e un pannello statistico in tempo reale, BINARYEXPERT aiuta i trader a prendere decisioni più informate. Caratteristiche principali Analisi Multi-Indicatore : Utilizza
Best Divergence Indicator for advanced traders without distraction of lines or arrows. It is not a magic blackbox for novice traders rather a great tool for experienced traders to decide their entry and exit. Can be used for most of the Forex pairs, Gold, Oil, Crypto. Flexibility to play with input to customize ur unique research too.  Therefore, I will suggest turning off arrows and divergence line to reduce clutter and instead use the following advice: For sell on divergence indicator start tu
account_info_horizontal is a mt4 (MetaTrader 4) indicator and it can be used with any forex trading systems / strategies for additional confirmation of trading entries or exits. Indicators add account information to chart. Profit, Balance, Equity, Free Margin, Margin and Margin Level %.   AccountInfo indicator can reveal all advanced features of MetaTrader 4 (above build 600). This indicator can clearly symbolize the main data of the current account (balance, equity, free margin, current Profi
L'indicatore SMC Venom Model BPR è uno strumento professionale per i trader che operano nell'ambito del concetto di Smart Money (SMC). Identifica automaticamente due modelli chiave sul grafico dei prezzi: FVG   (Fair Value Gap) è una combinazione di tre candele, in cui c'è un gap tra la prima e la terza candela. Forma una zona tra livelli in cui non c'è supporto di volume, il che spesso porta a una correzione dei prezzi. BPR   (Balanced Price Range) è una combinazione di due modelli FVG che for
This indicator was tested on the basis of real statistics for all market indicators according to indicators for 3 months of trading. trade forecasts for usd / jpy on the m30 time frame were received on our statistics! if you have any questions, please contact us in private messages or in discussions under this indicator and we will figure it out and help any questions will arise personal messages or in discussions under this indicator As soon as the blue points appear, we open a deal to increa
Chart Control MT4
Danrlei Hornke
5 (1)
O Chart Control é um indicador que permite de forma rapida e pratica alterar o timeframe e ativo do grafico, possibilitando que voce possa fazer todas as suas analises em apenas um grafico sem precisar abrir vários, além disso voce pode escolher o entre os temas claro e escuro para o qual melhor se adapta a sua preferencia. MT5:  https://www.mql5.com/pt/market/product/109444
FREE
Diamond Trend
Segundo Calvo Munoz
Indicator which identifies Trend and also buy/sell opportunities. Use for entries aligned to the Trend.  Although Diamond Trend is very accurate identifying entry points, it is always recommended to use a support indicator in order to reconfirm the operation. Remind to look for those Assets and Timeframes which best fit to your trader behavior/need... Valid for Scalping and Long Term operations. Please, set up a Bars Chart to be able to visualize the indicator properly...  ...And remind to give
DFX InteliTrade Shark PRO
Ibrahim Dabai Molloud Hassane
DFX InteliTrade  Shark PRO v6 Special Edition User Manual &  Comprehensive Guide 1. Indicator Overview Product Name: DFX InteliTrade Shark PRO v6 Developer: Dr. Hassane Dabai (Finance Engineer) ,dr.dabai@gmail.com |+(966)59-730-4266 Latest Version: v6 (September 2025) Platform: MetaTrader 4 (MT4) 2. Brief History & Philosophy The DFX InteliTrade Shark PRO is the culmination of 16 years of research and development (since 2009). It evolved from a basic trend-following system into a sophistica
TrendMaestro
Stefano Frisetti
5 (3)
Attenzione alle truffe, questo indicatore e' distribuito esclusivamente su MQL5.com nota: questo indicatore e' per METATRADER4, se vuoi la versione per  METATRADER5 questo e' il link:  https://www.mql5.com/it/market/product/108123 TRENDMAESTRO ver 2.5 TRENDMAESTRO riconosce un nuovo TREND sul nascere, non sbaglia mai. La sicurezza di identificare un nuovo TREND non ha prezzo. DESCRIZIONE TRENDMAESTRO identifica un nuovo TREND sul nascere, questo indicatore prende in esame la volatilita' i vol
Draw by Hand Tool
John Louis Fernando Diamante
This tool provides a freehand drawing method, to treat the chart space as a blackboard and draw by-hand. Drawings can be made to stick to the CHART (moves with chart scroll), or to stick to the WINDOW (does not move with chart scroll). Features: all drawings are individually styled, color, width show/hide each drawing type delete last drawing drawings, on chart and on window, remain through TF changes and terminal re-starts, until the indicator is removed Panel: stylable colors scalable in size
Outside The Box MT4
Innovicient Limited
5 (2)
The   Outside The Box (OTB)   is a complete trading system that provides the user with immense trading ability by highlighting on the chart areas where the trader should prepare to Re-enter the trend after pullbacks (Pullback trading strategy) Take partial/complete profit(Profit taking strategy), and Trade breakouts (Stock breakout strategy) - We have updated the indicator to show/hide Micro breakout areas around the major breakouts (Micro Breakouts).  The above is supported by an alert system
Unique Trend
Andriy Sydoruk
The Unique Trend indicator tracks market trends, ignoring sharp fluctuations and market noise. The indicator is suitable for trading on small timeframes because it ignores sudden price jumps or price corrections due to the reduction of market noise around the average price. The scan at minima and maxima forms the internal boundaries (channel) when calculating the indicator signals. The channel allows you to remove market noise. iMA and iATR are used to generate signals using the author's algor
Poison Slayer EurUsd
Ignacio Agustin Mene Franco
Poison Slayer EUR/USD General Information Name: Poison Slayer EUR/USD Platform: MetaTrader 4 (MT4) Recommended Broker: IC Markets Currency Pair: EUR/USD Timeframe: H1 (1 Hour) Minimum Capital: USD $1,000 Version: 1.00 Developer: WorldInversor System Description Poison Slayer EUR/USD is an automated Expert Advisor specifically designed for trading the EUR/USD pair on 1-hour charts. This system combines technical analysis based on exponential moving averages (EMAs) with a risk management strateg
KT Market Structure EA MT4
KEENBASE SOFTWARE SOLUTIONS
KT Market Structure EA è un expert advisor completamente automatizzato, sviluppato sulla base del nostro popolare indicatore KT Market Structure . Utilizza direttamente i segnali di Break of Structure (BOS) e Change of Character (CHoCH) dall’indicatore e offre diverse opzioni per automatizzare le operazioni di trading.  Combinando questi segnali con un'analisi aggiuntiva, offre un modo intelligente ed efficiente di fare trading. Non è necessario scaricare nulla separatamente, poiché tutte le dip
Nel frenetico mondo dei mercati finanziari, ogni secondo conta e ogni decisione può determinare il successo o il fallimento di un'operazione. È qui che entra in gioco il Binary Hacker Indicator, uno strumento rivoluzionario che è destinato a trasformare il modo in cui i trader analizzano i movimenti dei prezzi, un minuto alla volta. Svelare la precisione nel trading: Il Binary Hacker Indicator non è un normale strumento di trading. Funziona come un analizzatore in tempo reale, sezionando ogni mi
Gli utenti di questo prodotto hanno anche acquistato
El indicador "MR BEAST ALERTAS DE LIQUIDEZ" es una herramienta avanzada diseñada para proporcionar señales y alertas sobre la liquidez del mercado basándose en una serie de indicadores técnicos y análisis de tendencias. Ideal para traders que buscan oportunidades de trading en función de la dinámica de precios y los niveles de volatilidad, este indicador ofrece una visualización clara y detallada en la ventana del gráfico de MetaTrader. Características Principales: Canal ATR Adaptativo: Calcula
Indicatore Miraculous – Strumento Forex e Binario 100% Non-Repaint Basato sul Quadrato di Nove di Gann Questo video presenta l' Indicatore Miraculous , uno strumento di trading altamente accurato e potente, sviluppato specificamente per i trader di Forex e Opzioni Binarie . Ciò che rende unico questo indicatore è la sua base sul leggendario Quadrato di Nove di Gann e sulla Legge della Vibrazione di Gann , rendendolo uno degli strumenti di previsione più precisi disponibili nel trading moderno. L
Precautions for subscribing to indicator This indicator only supports the computer version of MT4 Does not support MT5, mobile phones, tablets The indicator only shows the day's entry arrow The previous history arrow will not be displayed (Live broadcast is for demonstration) The indicator is a trading aid Is not a EA automatic trading No copy trading function The indicator only indicates the entry position No exit (target profit)  The entry stop loss point is set at 30-50 PIPS Or the front hi
PairMaster Buy Sell Arrow Indicator for MT4 Trade Reversals Like a Pro — Catch Every Swing Point with Precision The PairMaster Buy Sell Arrow Indicator is a powerful MetaTrader 4 tool built to identify high-probability swing trading opportunities . Designed for traders who value accuracy, clarity, and simplicity, PairMaster detects key market turning points and plots intuitive buy and sell arrows directly on your chart. Key Features Accurate Swing Point Detection – Automatically identifies ma
Pulse Scalping Line - an indicator for identifying potential pivot points. Based on this indicator, you can build an effective Martingale system. According to our statistics, the indicator gives a maximum of 4 erroneous pivot points in a series. On average, these are 2 pivot points. That is, the indicator shows a reversal, it is erroneous. This means that the second signal of the indicator will be highly accurate. Based on this information, you can build a trading system based on the Martingale
Bomb Bank Signal
Igor Pereira Calil
5 (1)
Segnale bancario bomba: il tuo indicatore di fiducia in MetaTrader 4 Bomb Bank Signal è un potente indicatore per MetaTrader 4, progettato per identificare le tendenze più rilevanti nel mercato finanziario. Se cerchi uno strumento che anticipi con precisione i movimenti, la Bomb Bank è l'alleato di cui hai bisogno. Come funziona: Questo indicatore combina tre metodi distinti – analisi del volume, chiusura delle candele e trend simmetrico – per rilevare e segnalare opportunità di acquisto e v
BinaryIndicator
Andrey Spiridonov
BinaryIndicator is a highly accurate indicator for trading binary options. It shows excellent results in scalping. This indicator is based in multifactor analysis of trend indicators, as well as confirmation oscillators, which in the end gives an increased accuracy of signals. Advantages of the indicator Increased accuracy of signals. Excellent results when trading binary options with a short expiration time from M30 to M1 . It works on any timeframes. Works with any trade symbols. Parameters
Rtc ML Ai Predictor MT4
Muhammad Faisal Sagala
Rtc ML Ai | Predictor CORE MACHINE LEARNING ENGINE Adaptive ML Market Predictor – Multi-Bar Trend & Candle Forecast What This Indicator Does This indicator is a  real-time market prediction engine  designed to analyze price behavior and estimate  future market tendencies . Unlike conventional indicators, this system  does not rely on static parameters or historical curve-fitting , but adapts its internal state dynamically during live market operation. Instead of using static rules, the indic
The Hurricane Indicator
Paul Nicholas Clevett
5 (1)
Currently switched to the 4 hour chart - but use other time frames for confirmation. :-)  I change my main time frame based on the market movement at the time. The Hurricane Forex Indicator is a multi time frame indicator that includes such things as Trade Notifications, Trade Calculator, Momentum Indicator, risk reward and much more. We have a free Trade room for our users as well. Please check out the video for full details of how this indicator works as it has over 15 years worth of developme
FFx Engulfing Setup Alerter gives trade suggestions with Entry, Target 1, Target 2 and StopLoss. Below are the different options available: Entry suggestion - pips to be added over the break for the entry 3 different options to calculate the SL - by pips, by ATR multiplier or at the pattern High/Low 3 different options to calculate the 2 TPs - by pips, by ATR multiplier or at Risk/Reward Offset the dashboard - any place on the chart Remove the suggestion once the price reached the SL line Lines
FFx InsideBar Setup Alerter gives trade suggestions with Entry, Target 1, Target 2 and StopLoss. Below are the different options available: Entry suggestion - pips to be added over the break for the entry Minimum candle size - to avoid too close buy/sell entry suggestions 3 different options to calculate the SL - by pips, by ATR multiplier or at the pattern High/Low 3 different options to calculate the 2 TPs - by pips, by ATR multiplier or at Risk/Reward Offset the dashboard - any place on the c
FFx OutsideBar Setup Alerter gives trade suggestions with Entry, Target 1, Target 2 and StopLoss. Below are the different options available: Entry suggestion - pips to be added over the break for the entry. 3 different options to calculate the SL - by pips, by ATR multiplier or at the pattern High/Low. 3 different options to calculate the 2 TPs - by pips, by ATR multiplier or at Risk/Reward. Offset the dashboard - any place on the chart. Remove the suggestion once the price reached the SL line.
FFx PinBar Setup Alerter gives trade suggestions with Entry, Target 1, Target 2 and StopLoss. Below are the different options available: Entry suggestion - pips to be added over the break for the entry Minimum candle size - to avoid too small candles 3 different options to calculate the SL - by pips, by ATR multiplier or at the pattern High/Low 3 different options to calculate the 2 TPs - by pips, by ATR multiplier or at Risk/Reward Offset the dashboard - any place on the chart Remove the sugges
Automatic, live & interactive picture of all trendlines. Assign push, email and sound alerts to the lines of your choice and be informed about price rollback, breakout, rollback after breakout, number of rollbacks, line expiration by double breakout. Correct, drag or delete the lines and interactively tune the line system. https://youtu.be/EJUo9pYiHFA . Chart examples https: //www.mql5.com/en/users/efficientforex Price Interaction Events All events are effective immediately and only after one
The purpose of this new version of the MT4 standard indicator provided in your platform is to display in a sub-window multiple timeframes of the same indicator with its divergences. See the example shown in the picture below. But the display isn't like a simple MTF indicator. This is the real display of the indicator on its timeframe. Here's the options available in the FFx divergences indicator: Select the timeframes to be displayed (M1 to Monthly) Define the width (number of bars) for each tim
The purpose of this new version of the MT4 standard indicator provided in your platform is to display in a sub-window multiple timeframes of the same indicator with its divergences. See the example shown in the picture below. But the display isn't like a simple MTF indicator. This is the real display of the indicator on its timeframe. Here's the options available in the FFx divergences indicator: Select the timeframes to be displayed (M1 to Monthly). Define the width (number of bars) for each ti
The FFx Dashboard MTF alerter will show you on a single chart all the timeframes (M1 to Monthly) with their own status for the indicator. 2 Alert Options: Single timeframe: each selected timeframe alert separately when a signal occurs Multi timeframes: all selected timeframes must agree for an alert to be triggered Both options have an input to select the timeframes to be used for the alert(s). How to Understand the Status: Green/Red square: histogram above/below 0 line Green square + Red bord
The FFx Dashboard MTF alerter will show you on a single chart all the timeframes (M1 to Monthly) with their own status for the indicator. 2 Alert Options: Single timeframe: each selected timeframe alert separately when a signal occurs Multi timeframes: all selected timeframes must agree for an alert to be triggered Both options have an input to select the timeframes to be used for the alert(s). How to understand the status: Green/Red square: RSI above/below 50 line Green square + Red border: R
The FFx Dashboard MTF alerter will show you on a single chart all the timeframes (M1 to Monthly) with their own status for the indicator. 2 Alert Options: Single timeframe: each selected timeframe alert separately when a signal occurs Multi timeframes: all selected timeframes must agree for an alert to be triggered Both options have an input to select the timeframes to be used for the alert(s). How to understand the status: Green/Red square: Stoch above/below 50 line Green square + Red border:
The FFx Dashboard MTF alerter will show you on a single chart all the timeframes (M1 to Monthly) with their own status for the indicator. 2 Alert Options: Single timeframe: each selected timeframe alert separately when a signal occurs Multi timeframes: all selected timeframes must agree for an alert to be triggered Both options have an input to select the timeframes to be used for the alert(s). How to understand the status: Green/Red square: Price above/below Cloud (Kumo) Green square + Red bo
The FFx Dashboard MTF alerter will show you on a single chart all the timeframes (M1 to Monthly) with their own status for the indicator. 2 Alert Options: Single timeframe: each selected timeframe alert separately when a signal occurs Multi timeframes: all selected timeframes must agree for an alert to be triggered Both options have an input to select the timeframes to be used for the alert(s). How to understand the status: Green/Red square: MA pointing Up/Down Green square + Red border: MA po
The FFx Dashboard MTF alerter will show you on a single chart all the timeframes (M1 to Monthly) with their own status for the indicator. 2 Alert Options: Single timeframe: each selected timeframe alert separately when a signal occurs. Multi timeframes: all selected timeframes must agree for an alert to be triggered. Both options have an input to select the timeframes to be used for the alert(s). How to understand the status: Green square: Price above PSAR Red square: Price below PSAR Options
The FFx Dashboard MTF alerter will show you on a single chart all the timeframes (M1 to Monthly) with their own status for the indicator. 2 Alert Options: Single timeframe: each selected timeframe alert separately when a signal occurs Multi timeframes: all selected timeframes must agree for an alert to be triggered Both options have an input to select the timeframes to be used for the alert(s). How to understand the status: Green/Red square: CCI above/below levels (ie. 100/-100) Grey square: C
The FFx Dashboard MTF alerter will show you on a single chart all the timeframes (M1 to Monthly) with their own status for the indicator. 2 Alert Options: Single timeframe: each selected timeframe alert separately when a signal occurs Multi timeframes: all selected timeframes must agree for an alert to be triggered Both options have an input to select the timeframes to be used for the alert(s). How to understand the status: Green/Red square: ADX above level Grey square: ADX below level Red bor
The FFx Dashboard MTF alerter will show you on a single chart all the timeframes (M1 to Monthly) with their own status. 2 Alert Options: Single timeframe: each selected timeframe alert separately when a signal occurs Multi timeframes: all selected timeframes must agree for an alert to be triggered Both options have an input to select the timeframes to be used for the alert(s). How to understand the status: Green/Red square: bullish/bearish candle Options available in the FFx Dashboard Alerter
The [GRAFF] III manual trading system is based on multiple MetaTrader (MT4) indicators. Together, the entire PACK of GRAFF III indicators makes an advanced trading tool. The system consists of over 20 different custom-built indicators which have been carefully selected and tested in the long term to produce strong and efficient trading signals. The particular indicators are based on different mathematical formulas, so the entire system is calibrated to remove false signals from its own indicator
FFx Universal Strength Meter PRO is more than a basic strength meter. Instead of limiting the calculation to price, it can be based on any of the 19 integrated strength modes + 9 timeframes. With the FFx USM, you are able to define any period for any combination of timeframes. For example, you can set the dashboard for the last 10 candles for M15-H1-H4… Full flexibility! Very easy to interpret... It gives a great idea about which currency is weak and which is strong, so you can find the best pai
Filtro:
Nessuna recensione
Rispondi alla recensione