PillowIndicator

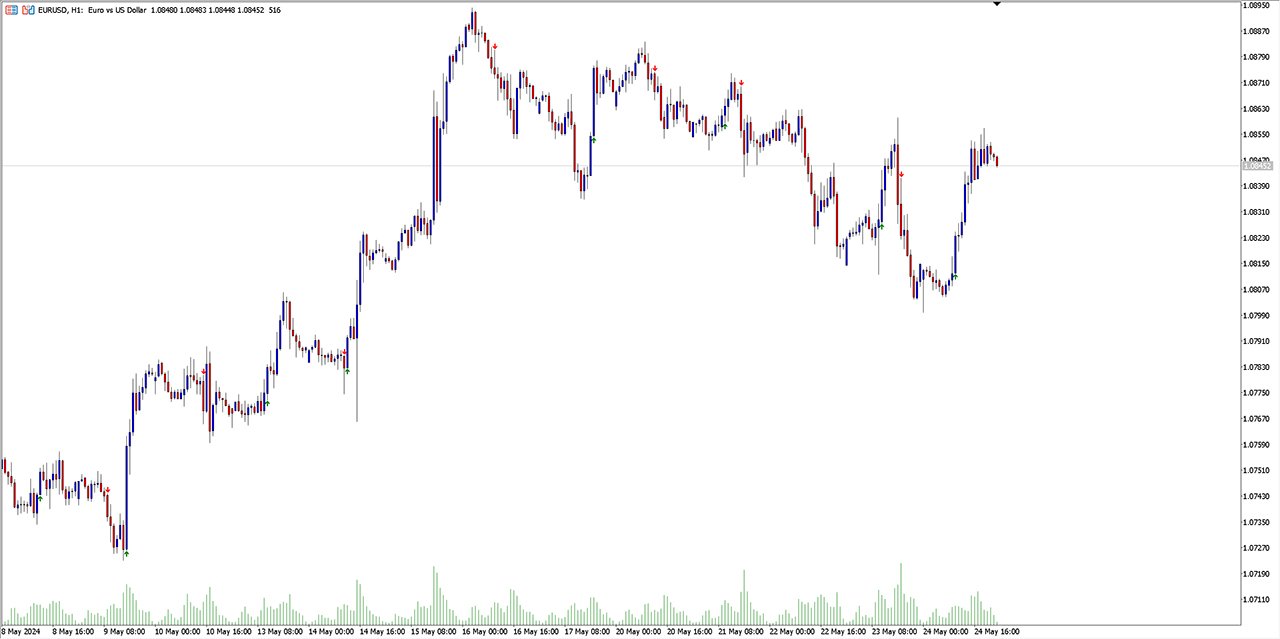
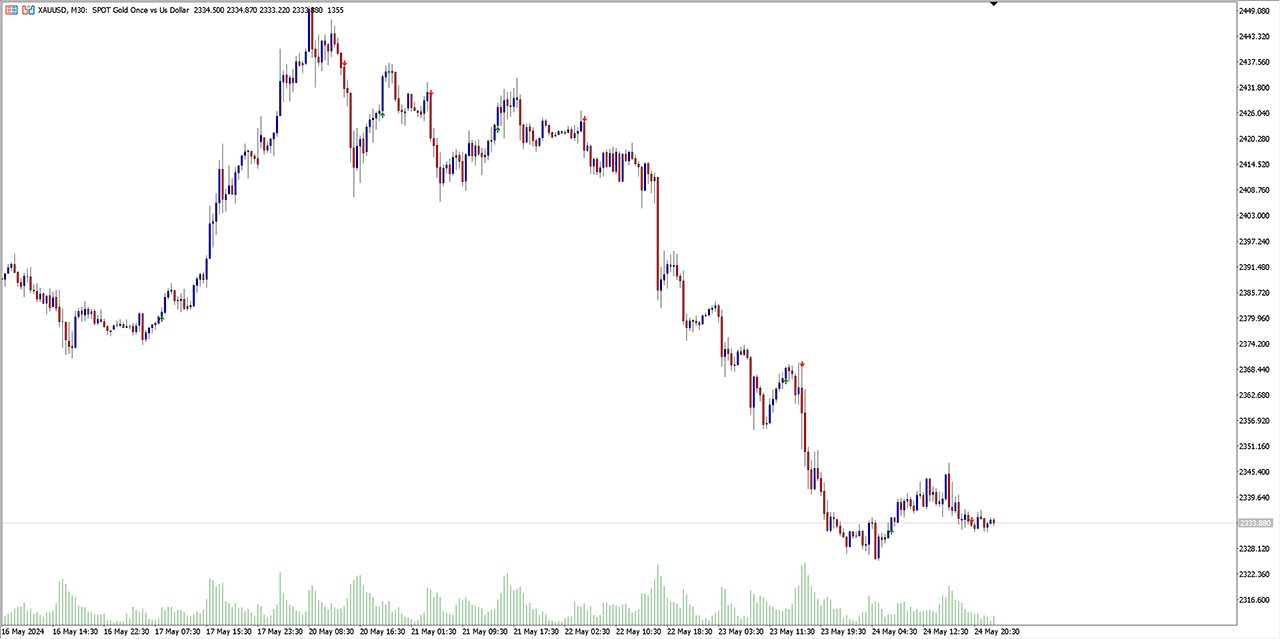
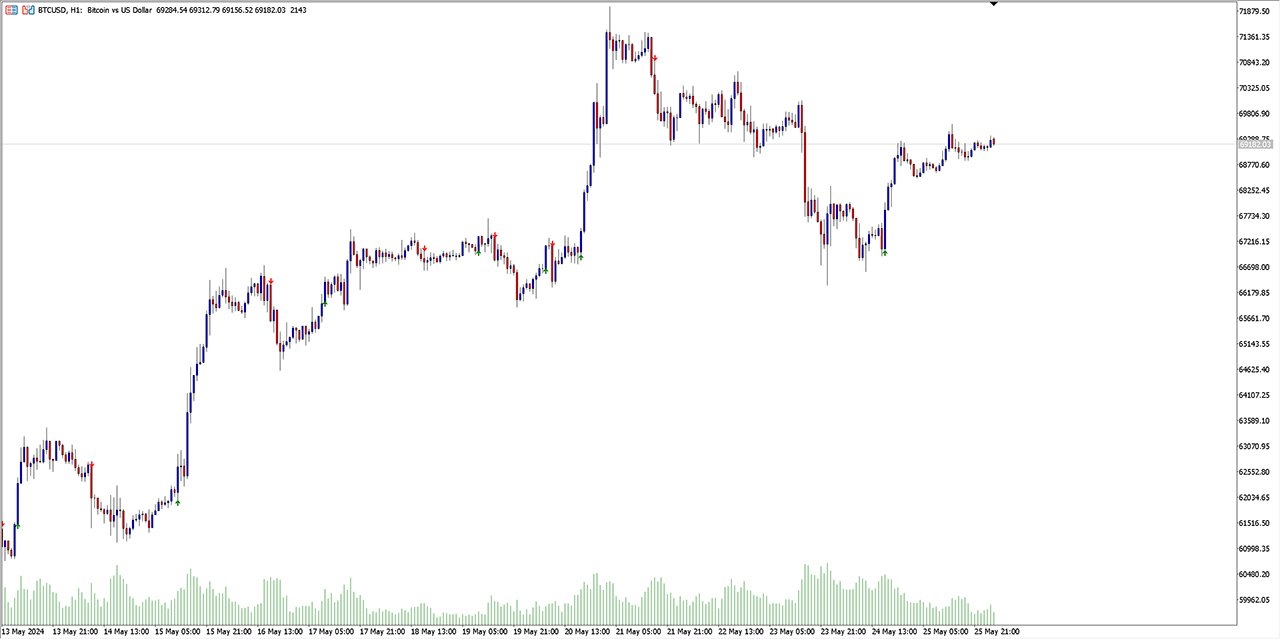
Se hai bisogno di un indicatore che mostri i punti di ingresso nel mercato, allora questo è il tuo indicatore. 

L'indicatore non viene ridisegnato. Mostra i punti di acquisto e vendita per qualsiasi TF (intervallo di tempo) e qualsiasi coppia di valute. Le impostazioni sono regolabili per tutti gli strumenti. Puoi configurare ciascun parametro per qualsiasi broker, per qualsiasi account.

Questo è un CUSCINO comodo :)) Dai un'occhiata.....
Prodotti consigliati
The third indicator from the set for market analysis. The first one is here:  https://www.mql5.com/ru/market/product/65258 The second one is here: https://www.mql5.com/ru/market/product/65347 The indicator builds a channel of maximum price fluctuations for a specified period. Additionally, the middle of the channel is drawn. All color settings, line types are customizable. The indicator allows you to see the picture of price movement from a slightly different angle. You can use several indic
Mega Dashboard
Paul Anscombe
5 (4)
The Ultimate Dashboard New Year Sale - save $20   (normal price $79) Indicators are useful for traders, but when you put them into a dashboard that can scan 28 symbols at once they become even better, and when you can also combine different indicators and timeframes to give you synchronized alerts, then they become awesome. This easy to use dashboard provides you with 32 leading indicators, use them individually or together, to create powerful combination alerts. So when you want to know that RS
G-FiboTrend — Indicator Description G-FiboTrend is a trend-channel indicator for MetaTrader 5 that plots dynamic Fibonacci-based price zones over a rolling lookback period. How It Works The indicator scans a user-defined number of bars ( FiboPeriod ) to identify the highest high (HH) and lowest low (LL) within that window. From this range, it derives three key levels: Upper Band — Fibonacci level (default 61.8%) Mid Band — 50.0% midpoint Lower Band — Fibonacci level (default 38.2%) These levels
DeepInsight
Gustavo Santos Pedrosa
Title: DeepInsight: Flow and Market Context Analysis What is DeepInsight? DeepInsight is a technical analysis tool for MetaTrader 5, developed to assist in reading market dynamics. The indicator processes volume and price movement data to generate objective visual references, facilitating the identification of areas of interest on the chart. The tool functions as an auxiliary analysis dashboard, offering support for manual decision-making without performing automatic order execution. Operationa
Trande Candle
Alexandr Saprykin
Trend Candle — Indicatore di lettura istantanea del trend L'indicatore Trend Candle colora automaticamente le candele del grafico, trasformando un'analisi complessa in un'immagine visivamente comprensibile. Determina istantaneamente la forza e la direzione del mercato: verde per un trend rialzista, rosso per un trend ribassista e grigio per una fase neutra. Lo strumento si basa sulla sincronizzazione di due filtri adattivi, fornendo segnali chiari senza rumore inutile. Vantaggi principali Vi
!! FLASH SALE !!   Over 80% off !!     For ONE week only. Now only $47 - normally $297! >>>      Ends on 30 June 2023 - Don't miss it! Buy and Sell Arrows On The Chart According To Price Action Sends Alerts On MT5 To Your Phone To You Email Does NOT repaint. Works on any pair, any timeframe.     10 Activations allowed so you are free from limitations. MT4 Version here . For spreads from a tiny 0.1 pips RAW/ECN Accounts,  click here . Check out my Waka Esque EA signal here: >>   High Risk Se
Day Trade System
Nardus Van Staden
5 (1)
Introducing The Day Trader System: Your Shortcut to Day Trading Success! Are you a day trader seeking simplicity without compromising profitability? Look no further! We present The Day Trader System – your go-to solution for identifying lucrative opportunities in the fast-paced world of Forex. Simple Yet Powerful: The Day Trader System is a straightforward yet highly effective indicator designed exclusively for day traders. Say goodbye to complexity and hello to a system that simplifies
FREE
Trade Area
Jinsong Zhang
Most time the market is in a small oscillation amplitude. The Trade Area indicator helps users to recognize that time. There are 5 lines in this indicator: Area_high, Area_middle, Area_Low, SL_high and SL_low. Recommendations: When price is between Area_high and Area_Low, it's time to trade. Buy at Area_Low level and sell at Area_high level. The SL_high and SL_low lines are the levels for Stop Loss. Change the Deviations parameter to adjust SL_high and SL_low.
Channel Scanner MT5
Reza Aghajanpour
5 (1)
**   All Symbols   x   All Timeframes   scan just by pressing scanner button ** *** Contact me  to send you instruction and add you in "Channel Scanner group" for sharing or seeing experiences with other users. Introduction: The Channel pattern is described as the area located between two trend lines. This area is used for a measure of a trading range. In this case, the upper trend line connects price highs while the lower trend line connects price lows. Also when it comes to breakout points, it
Description of work The MA7 Galega indicator is based on the standard Moving Average indicator. Shows a puncture of the moving average. Detailed information about the MA7 Galega indicator. Indicator settings General settings: Period ; Method ; Apply to ; Consider the direction of the candle . Message settings: Send message to the terminal (Alert) – permission to send messages to the terminal using the Alert function; Send message to the mobile terminal (Push) – permission to send messages to t
# SSL ST Strategy MT5 Indicator - Italian Version L'indicatore SSL ST Strategy MT5 è uno strumento di analisi tecnica progettato per aiutare i trader a identificare chiaramente i segnali di acquisto e vendita sul grafico di trading. Offre indicatori visivi come linee e frecce, insieme a notifiche audio, popup e push per avvertire prontamente i trader quando sorge un'opportunità di trading. ## Vantaggi principali - Fornisce chiari segnali visivi direttamente sul grafico utilizzando linee colo
FREE
Horizontal volume bars, Cluster analysis, Volume profile Volume in Range gets information about the accumulated volume in a specified vertical range and period in bars. The received data is then plotted on the chart as rectangular boxes with the volume quantity inside. Usage:- The tool acts as a support resistance levels but most importantly it should be used to check in which direction the price breaks out of the significant levels formed by this indicator and then actions to be taken on correc
HL Signals
Tsvetan Tsvetanov
HL Signals – Indicatore di Breakout Multi-Symbol per MT5 HL Signals è un indicatore multi-symbol progettato per rilevare opportunità di breakout in tempo reale. Ti avvisa istantaneamente quando il prezzo raggiunge nuovi massimi o minimi giornalieri, settimanali o mensili, aiutandoti a giocare d'anticipo sui movimenti chiave del mercato. Sviluppato per offrire efficienza e chiarezza, HL Signals combina una rilevazione precisa con un pannello interattivo e intuitivo, permettendoti di monitorare e
Apex Arrows MQL5
German Pablo Gori
APEX ARROWS is a professional-grade technical indicator developed for MetaTrader 5. This system integrates multiple analytical methodologies to identify high-probability market opportunities. Built on a non-repainting architecture, it utilizes a sophisticated multi-layered approach—combining Moving Averages, RSI momentum analysis, and ATR volatility filtering—to generate precise Buy and Sell signals. This tool optimizes decision-making by providing clear, actionable signals directly on the chart
Description of work The MA7 Aster indicator is based on the standard Moving Average indicator. Shows the price deviation from the moving average. Detailed information about the MA7 Aster indicator. Indicator settings General settings: Period ; Method ; Apply to ; Minimum distance – minimum distance from the moving average to the closing price of the candle. Message settings: Send message to the terminal (Alert) – permission to send messages to the terminal using the Alert function; Send messag
RSImaxmin
Carlos Andrés Moya Erazo
4.5 (10)
The indicator shows when there are overprice and divergences on the RSI. In addition, it has configurable alerts, dynamic overprice levels and a special “RSI cleaner” function. The indicator that automatically calculates the premium rates! RSImaxmin is an indicator based on the Relative Strength Index (RSI) oscillator that effectively identifies changes in price trends as it reflects the relative strength of bullish movements compared to bearish movements. It is widely used by traders to measur
Indicator introduction:  A channel and trend line indicator, which is a good tool for manual trading, and also can be used for creating new EAs, without drifting or repainting.  It applies to any timeframes and any symbols.   The work of the indicator is shown in the screenshots. For any novice and programming trading friend, you can write the signal into the EA to play freely, buffer 0 corresponds to the bold trend line, buffer 4 and 5 respectively corresponds to the channel's upper and lower f
Indicatore Crypto_Forex Oscillatore HTF OsMA per MT5. - HTF OsMA è uno dei migliori indicatori di tendenza sul mercato. HTF significa "Higher Time Frame". - Questo indicatore è eccellente per sistemi di trading multi-time frame con ingressi di Price Action o in combinazione con altri indicatori. - L'indicatore HTF OsMA consente di collegare l'OsMA da un time frame più alto al grafico corrente --> questo è un approccio di trading professionale. - PC / Mobile alerts! Click here to see high quali
Breakeven Line v2 Indicator   is a MetaTrader indicator that calculates breakeven level based on all open positions and displays it on your chart as a horizontal line. Additionally, it will calculate the total number trades, the total number of lots, and the distance to the breakeven line in points and profit/loss. The indicator is available for MetaTrader 5 . Why use Breakeven Line Indicator? When you have multiple trades opened on a single symbol, it can be difficult to tell where your averag
Vol 2 DPOC volume vol 2 DOC-dynamic horizontal volume indicator for any time periods Main settings of the indicator: Volume Source -selecting data for volumes (tick or real) DPOCOn -enabling / disabling the indicator DPOCFrom -calculation start date DPOCTo -settlement end date The indicator allows you to manually select areas on the chart to analyze changes in the maximum volume over time. You can do this by using vertical lines and moving them along the chart. Or by setting specific dates in
!! FLASH SALE !!   Over 80% off !!     For ONE week only. Now only $47 - normally $297! >>>      Ends on 30 June 2023 - Don't miss it! Buy And Sell Signal Arrows On The Chart When The Price Is About To Reverse. Also Sends Alerts –On MT5 To Your Phone To Your Email. Does not repaint. Works on any pair, any timeframe.   (Just ajust the settings for your pair and timeframe.) 10 Activations allowed so you are free from limitations MT4 version here .   Spreads from 0.1pip RAW/ECN Accounts,   c
The Fat and Slim indicator tracks strong and weak money in the market. It is derived from RSI, MFI and many similar indicators. Input values are closing prices and volumes. The RSI (yellow curve) is in the range -100 ... 100. It is additionally multiplied by a coefficient so that the curve is not compressed to the middle values at higher periods (a problem with the classic RSI with different periods). Strong/Fat red curve is RSI weighted by higher volumes. Weak/Slim blue curve is calculated so t
BTMM Session StopHunt Reversal Reentry Indicator (Demo) This is a fully functional demo version of the BTMM Session StopHunt Reversal Reentry Indicator for MetaTrader 5. The demo allows traders to experience the complete indicator logic in real market conditions before purchasing the full version. What the Demo Includes Full session visualization (Asian, Brinks, New York) Automatic Asian range (High / Low) and range size (R) Stop-hunt (liquidity sweep) reversal detection Entry, Sto
FREE
The indicator colors the candles relative to their volume delta. The calculation of the candles delta is based on the tick history or on the deals tape history (see below for a description of the input variable "Volumes"). Coloring is performed by two parameters : by delta sign, as candle color, by delta value, as candle color contrast against chart window background color. In addition to coloring the candles, the indicator also displays the delta profile on the interval specified by the user
DUAL-ENGINE ANALYSIS SYSTEM: Average Tick Size Indicator : Measures bid movement strength across 6 customizable lookback periods (36, 96, 369, 500, 1000, 2000 ticks) Multi Timeframe Tick Analyzer : Calculates buy/sell pressure percentages across 6 different timeframes (100.200,300,400,500,600 ticks) REAL-TIME SIGNAL GENERATION: Combined Buy/Sell Alerts : Only triggers when BOTH analytical engines confirm the same direction Visual Arrow Signals : Clear green up arrows for buy signals, red down
1. Why did I develop this series of indicators I found that most traders need to use multiple time frame indicators. They usually switch time frame to see indicators. However, once the timeframe is switched, you cannot see the  corresponding relationship  between  the price in the smaller timeframe  and  the indicator in the larger timeframe . For example: if your price chart is in H1 timeframe, you can see H4, D1 and W1 indicators in H1 timeframe Chart. This is more helpful for you to find th
The Linear Regression Channel is a powerful technical analysis tool that helps visually identify the prevailing trend and potential price zones. Essentially, the indicator performs two main functions: It draws a trendline through the center of price action over a specified period. This line is calculated using the linear regression method, which results in the best possible "line of best fit" for the price data. From this center line, the indicator plots two parallel lines above and below, creat
FREE
Adaptive Pulse
Anastasia Danilova
Adaptive Pulse - Sistema Professionale di Segnali di Trading Descrizione Breve Adaptive Pulse è un indicatore professionale di segnali di trading basato sulla tecnologia di analisi adattiva del mercato. L'indicatore si adatta automaticamente alla volatilità e genera segnali precisi di acquisto e vendita con frecce visive sul grafico. Funziona su tutti i timeframe e strumenti finanziari. Caratteristiche Principali L'indicatore fornisce un sistema di analisi a tre livelli con tre linee adattive in
Gli utenti di questo prodotto hanno anche acquistato
Azimuth Pro
Ottaviano De Cicco
5 (6)
Azimuth Pro V2: Synthetic Fractal Structure and Confirmed Entries for MT5 Overview Azimuth Pro is a multi-level swing structure indicator by Merkava Labs . Four nested swing layers, swing-anchored VWAP, ABC pattern detection, three-timeframe structural filtering, and closed-bar confirmed entries — one chart, one workflow from micro-swings to macro-cycles. This is not a blind signal product. It is a structure-first workflow for traders who care about location, context, and timing. V2 Launch Offe
OmniSync Projection
Antonio-alin Teculescu
5 (1)
Chronos Fractal Engine is an innovative price projection indicator for MetaTrader 5, designed to transform your technical analysis by intelligently identifying and projecting historical price patterns. Built upon an advanced correlation algorithm and the fractal principles of the market, this powerful tool visualizes potential future price movements, giving you a unique edge in your trading decisions. What is Chronos Fractal Engine? At its core, the Chronos Fractal Engine employs a sophisticat
ARICoins
Temirlan Kdyrkhan
ARICoin is a powerful trading companion designed to generate high-probability entry signals with dynamic TP/SL/DP levels based on volatility. Built-in performance tracking shows win/loss stats, PP1/PP2 hits, and success rates all updated live. Key Features: Buy/Sell signals with adaptive volatility bands Real-time TP/SL/DP levels based on ATR Built-in MA Filter with optional ATR/StdDev volatility Performance stats panel (Success, Profit/Loss, PP1/PP2) Alerts via popup, sound, push, or email Cust
Innanzitutto, vale la pena sottolineare che questo Strumento di Trading è un Indicatore Non-Ridipingente, Non-Ridisegnante e Non-Laggante, il che lo rende ideale per il trading professionale. Corso online, manuale utente e demo. L'Indicatore Smart Price Action Concepts è uno strumento molto potente sia per i nuovi che per i trader esperti. Racchiude più di 20 utili indicatori in uno solo, combinando idee di trading avanzate come l'Analisi del Trader del Circolo Interno e le Strategie di Tradin
Bill Williams Advanced
Siarhei Vashchylka
5 (11)
Bill Williams Advanced is designed for automatic chart analysis using Bill Williams' "Profitunity" system. The indicator analyzes four timeframes at once. Manual (Be sure to read before purchasing) Advantages 1. Analyzes the chart using Bill Williams' "Profitunity" system. Signals are displayed in a table in the corner of the screen and on the price chart. 2. Finds all known AO and AC signals, as well as zone signals. Equipped with a trend filter based on the Alligator. 3. Finds "Divergence Bar
RelicusRoad Pro: Sistema Operativo Quantitativo di Mercato 70% DI SCONTO ACCESSO A VITA (TEMPO LIMITATO) - UNISCITI A 2.000+ TRADER Perché la maggior parte dei trader fallisce anche con indicatori "perfetti"? Perché operano su Singoli Concetti isolati. Un segnale senza contesto è una scommessa. Per vincere serve CONFLUENZA . RelicusRoad Pro non è un semplice indicatore. È un Ecosistema Quantitativo completo . Mappa la "Fair Value Road", distinguendo tra rumore e rotture strutturali. Smetti di in
Berma Bands
Muhammad Elbermawi
5 (8)
L'indicatore Berma Bands (BBs) è uno strumento prezioso per i trader che cercano di identificare e capitalizzare i trend di mercato. Analizzando la relazione tra il prezzo e le BBs, i trader possono discernere se un mercato è in una fase di trend o di range. Visita il [ Berma Home Blog ] per saperne di più. Le Berma Bands sono composte da tre linee distinte: la Upper Berma Band, la Middle Berma Band e la Lower Berma Band. Queste linee sono tracciate attorno al prezzo, creando una rappresentazion
ARIPoint
Temirlan Kdyrkhan
ARIPoint is a powerful trading companion designed to generate high-probability entry signals with dynamic TP/SL/DP levels based on volatility. Built-in performance tracking shows win/loss stats, PP1/PP2 hits, and success rates all updated live. Key Features: Buy/Sell signals with adaptive volatility bands Real-time TP/SL/DP levels based on ATR Built-in MA Filter with optional ATR/StdDev volatility Performance stats panel (Success, Profit/Loss, PP1/PP2) Alerts via popup, sound, push, or email Cu
AriX
Temirlan Kdyrkhan
1 (4)
AriX Indicator for MT5 A powerful trend-following and signal-evaluation tool AriX is a custom MT5 indicator that combines Moving Averages and ATR-based risk/reward logic to generate clear buy/sell signals. It visualizes dynamic SL/TP levels, evaluates past trade outcomes, and displays win/loss statistics in a clean on-chart panel. Key features include: Buy/Sell signals based on MA crossovers ATR-based SL/TP1/TP2/TP3 levels with visual lines and labels Signal outcome tracking with real-time stat
Meravith MT5
Ivan Stefanov
5 (1)
Strumento per market maker. Meravith: Analizzerà tutti i timeframe e mostrerà il trend attualmente in corso. Evidenzierà le zone di liquidità (equilibrio dei volumi) dove i volumi rialzisti e ribassisti sono uguali. Mostrerà tutti i livelli di liquidità dei diversi timeframe direttamente sul grafico. Genererà e presenterà un’analisi di mercato testuale a scopo di riferimento. Calcolerà obiettivi, livelli di supporto e punti di stop-loss in base al trend attuale. Calcolerà il rapporto rischio/ren
FX Analysis is an all-in-one MT5 indicator dashboard that combines eight analytical tools in a single panel, helping traders identify high-probability setups without switching between charts or indicators. Designed for standard forex pairs on MetaTrader 5. Best results on M15 - H4 timeframes when all components are used together as part of the included workflow. Components Volatility Analyzer Displays historical average movement by hour and by day of the week. A real-time Pip Balance shows the
Introduction to X3 Chart Pattern Scanner X3 Cherart Pattern Scanner is the non-repainting and non-lagging indicator detecting X3 chart patterns including Harmonic pattern, Elliott Wave pattern, X3 patterns, and Japanese Candlestick patterns. Historical patterns match with signal patterns. Hence, you can readily develop the solid trading strategy in your chart. More importantly, this superb pattern scanner can detect the optimal pattern of its kind. In addition, you can switch on and off individu
Questo indicatore è un indicatore per l'analisi automatica delle onde perfetto per il trading pratico! Caso... Nota:   non sono abituato a usare nomi occidentali per la classificazione delle onde a causa dell'influenza della convenzione di denominazione di Tang Lun (Tang Zhong Shuo Zen), ho chiamato l'onda base come   penna   e la banda dell'onda secondaria come   segmento   At allo stesso tempo, il segmento ha la direzione del trend. La denominazione   è principalmente segmento di trend   (que
Ultimate SMC Indicator
Hicham Mahmoud Almoustafa
1 (1)
Ultimate SMC Indicator v2.20 — Smart Money Concepts All-in-One Stop switching between 5 different indicators. Ultimate SMC gives you everything Smart Money traders need — in one clean indicator with interactive controls. GUIDE What makes this different? Most SMC indicators show you Order Blocks or FVGs separately. You still have to figure out which zones actually matter. Ultimate SMC does the hard work: it scans for Order Blocks, Fair Value Gaps, Liquidity Sweeps, Supply & Demand zones, Fibo
Aiuta a determinare se questo punto è adatto per acquistare. Aiuta a determinare se questo punto è adatto per vendere. Quando tutti e quattro gli indicatori raggiungono contemporaneamente il fondo, occorre concentrarsi sulle opportunità di rimbalzo. Quando tutti e quattro gli indicatori si trovano contemporaneamente nella parte alta, occorre concentrarsi sulle opportunità di ribasso. Questo sistema è costruito sulla base di avanzate tecnologie algoritmiche cinesi e di una struttura di modellazio
Ace Trend
Mikhail Sergeev
5 (3)
Ti presentiamo un indicatore rivoluzionario che cambia le regole del gioco nel mondo del trading di tendenza. L'indicatore è progettato per ripensare le prestazioni e portare la tua esperienza di trading a livelli senza precedenti. Il nostro indicatore vanta una combinazione unica di funzionalità all'avanguardia che lo distinguono dalla concorrenza. La tecnologia avanzata "Real Pricing Factors" offre una sostenibilità senza pari anche nelle condizioni di mercato più difficili e volatili. Dì addi
OrderFlow Absorption – Indicatore professionale di Delta e Segnali di Assorbimento per MT5 Sblocca la potenza della vera analisi del flusso degli ordini con OrderFlow Absorption – l’indicatore definitivo di istogramma delta e segnali di assorbimento per MetaTrader 5. Progettato per i trader che vogliono vedere cosa succede davvero dietro ogni movimento di prezzo, questo strumento rivela la pressione nascosta di acquisto/vendita e gli eventi di assorbimento che muovono il mercato. Caratteristiche
L'Oscillatore dell'Indice di Precisione (Pi-Osc) di Roger Medcalf di Precision Trading Systems La Versione 2 è stata attentamente rielaborata per essere estremamente veloce nel caricarsi sul tuo grafico e sono state apportate alcune altre migliorie tecniche per migliorare l'esperienza. Il Pi-Osc è stato creato per fornire segnali di sincronizzazione del trading accurati progettati per individuare punti di esaurimento estremi, i punti ai quali i mercati vengono costretti a recarsi solo per eli
Moon Cycle
Navdeep Singh Kaur
Indicatore tecnico che utilizza l'algoritmo astronomico di Jean Meeus per visualizzare le fasi lunari sui grafici di trading. Presenta una linea curva continua che rappresenta il ciclo lunare con precisione scientifica equivalente agli osservatori professionali. Compatibile con qualsiasi simbolo e timeframe su MT5, inclusi forex, commodities, indici e azioni. Include pannello informativo che mostra fase lunare attuale, percentuale di illuminazione e livelli di riferimento per analisi tecnica. I
Owl Smart Levels MT5
Sergey Ermolov
4.03 (32)
Quando si opera seguendo il trend, la difficoltà principale non è trovare un livello, ma capire dove un ingresso è realmente valido. Il prezzo spesso reagisce ai livelli, ma non riesce a proseguire il movimento — il che porta a ingressi falsi o opportunità perse. Owl Smart Levels non si limita a mostrare livelli , ma evidenzia zone basate sulla struttura di mercato e sui pullback. Questo consente di valutare i punti di ingresso in modo diverso ed evitare una parte dei segnali falsi. Cosa includ
ARIScalping
Temirlan Kdyrkhan
ARIScalp is a powerful trading companion designed to generate high-probability entry signals with dynamic TP/SL/DP levels based on volatility. Built-in performance tracking shows win/loss stats, PP1/PP2 hits, and success rates all updated live. Key Features: Buy/Sell signals with adaptive volatility bands Real-time TP/SL/DP levels based on ATR Built-in MA Filter with optional ATR/StdDev volatility Performance stats panel (Success, Profit/Loss, PP1/PP2) Alerts via popup, sound, push, or email Cus
Gem SIGNAL
Shengzu Zhong
3 (1)
GEM Signal Pro GEM Signal Pro è un indicatore trend-following per MetaTrader 5, progettato per i trader che desiderano segnali più chiari, configurazioni operative più strutturate e una gestione del rischio più pratica direttamente sul grafico. Invece di mostrare solo una semplice freccia, GEM Signal Pro aiuta a presentare l’intera idea di trading in modo più chiaro e leggibile. Quando le condizioni sono confermate, l’indicatore può mostrare sul grafico il prezzo di ingresso, lo stop loss e gli
L'indicatore " Dynamic Scalper System MT5 " è progettato per il metodo di scalping, ovvero per il trading all'interno di onde di trend. Testato sulle principali coppie di valute e sull'oro, è compatibile con altri strumenti di trading. Fornisce segnali per l'apertura di posizioni a breve termine lungo il trend, con ulteriore supporto al movimento dei prezzi. Il principio dell'indicatore. Le frecce grandi determinano la direzione del trend. Un algoritmo per generare segnali per lo scalping sott
Native Channels
BeeXXI Corporation
5 (1)
This indicator recognizes all support and resistance levels. A number of unique high-performance techniques have been applied, which made the existence of this indicator possible. All formed channels are naturally visible: horizontal linear linear parabolic cubic (Polynomial 3 degrees - Wave) This is due to a bundle of approximating channels. The formed channels form "standing waves" in a hierarchical sequence. Thus, all support and resistance levels are visible. All parameter management is i
L’indicatore evidenzia le zone in cui viene dichiarato interesse sul mercato , per poi mostrare la zona di accumulo degli ordini . Funziona come un book degli ordini su larga scala . Questo è l’indicatore per i grandi capitali . Le sue prestazioni sono eccezionali. Qualsiasi interesse ci sia nel mercato, lo vedrai chiaramente . (Questa è una versione completamente riscritta e automatizzata – non è più necessaria un’analisi manuale.) La velocità di transazione è un indicatore concettualmente nuo
Range Cycle Indicator. Gives signal on price range cycling smoothed by moving average. It is better to use it on H1+ timeframes and avoid side markets. Because if market is flat this indicator will give too many zero profit or even losing signals. Parameters: PopUpAlert - to allow it to alert when trend changes; EMailAlert - for email alerts; period - this is a smoothing criteria, use higher values on lower timeframes; TimeFrame(new) - higher timeframe (or the same) to use for calculation, defa
The iChannels
BeeXXI Corporation
5 (2)
Ultra-fast recognition of parabolic channels (as well as linear, horizontal and wavy channels) throughout the depth of history, creating a hierarchy of channels. Required setting: Max bars in chart: Unlimited This indicator is designed primarily for algorithmic trading, but can also be used for manual trading.  This indicator will have a very active evolution in the near future and detailed descriptions on how to apply to create robots
VTrende Pro
Andrii Diachenko
5 (1)
VTrende Pro - MTF indicator for trend trading with a display panel for MT5 *** Videos can be translated into any language using subtitles (video language - Russian) Although the signals of the VTrende Pro indicator can be used as signals of a full-fledged trading system, it is recommended to use them in conjunction with the Bill Williams TS. VTrende Pro is an extended version of the VTrende indicator. Difference between Pro version and VTrende: - Time zones - Signal V - signal 1-2 waves -    S
TrendMaestro5
Stefano Frisetti
Attenzione alle truffe, questo indicatore e' distribuito esclusivamente su MQL5.com nota: questo indicatore e' per METATRADER5, se vuoi la versione per  METATRADER4 questo e' il link:   https://www.mql5.com/it/market/product/108106 TRENDMAESTRO ver 2.5 TRENDMAESTRO   riconosce un nuovo TREND sul nascere, non sbaglia mai. La sicurezza di identificare un nuovo TREND non ha prezzo. DESCRIZIONE TRENDMAESTRO identifica un nuovo TREND sul nascere, questo indicatore prende in esame la volatilita' i
Weis Wave with Alert MT5
Trade The Volume Waves Single Member P.C.
4.94 (17)
Rental/Lifetime Package Options and Privileges  Rent Monthly Six Months   Yearly/Lifetime Weis Wave with Speed with Alert+Speed Index x x x Manual  x x x Quick Set up Video x x x Blog x x x Lifetime Updates x x x Setup and Training Material x x Discord Access Channel "The SI traders"          x Rectangle Break Alert Tool      x How to trade with it:    http://www.tradethevolumewaves.com   ** If you purchase please contact me to setup your  : Training Room and  complete manual access.  Wei
Altri dall’autore
BarInOut
Sergey Shevchenko
The indicator shows the possible direction of the price movement up or down, depending on the appearance of the arrow on the chart. It does not redraw and does not disappear when the direction of movement changes. It works absolutely on all timeframes and currency pairs. The indicator is based on candlestick analysis for a certain period of time. An arrow indicating the possible direction of movement appears as soon as a signal has appeared. The larger the arrow on the chart, the stronger the s
YaY
Sergey Shevchenko
Consulente Rivoluzionario per il Trading Forex Vi presentiamo il più recente consulente per il trading Forex che rivoluzionerà la vostra comprensione delle possibilità del trading automatizzato! Questo strumento unico è sviluppato utilizzando le tecnologie più avanzate e anni di esperienza di trader professionisti. Caratteristiche Principali del Nostro Consulente: Alta Redditività : Il nostro consulente può generare profitti significativi anche nelle condizioni di mercato più difficili. Con algo
Filtro:
Nessuna recensione
Rispondi alla recensione