MA Color
- Indicatori
-
Maksim Neimerik
 If you suddenly came to the desire to earn automatic trading then I am at your service, I will write any robot, indicator or utility in the language of MQL4 or MQL5!
 - Versione: 1.0
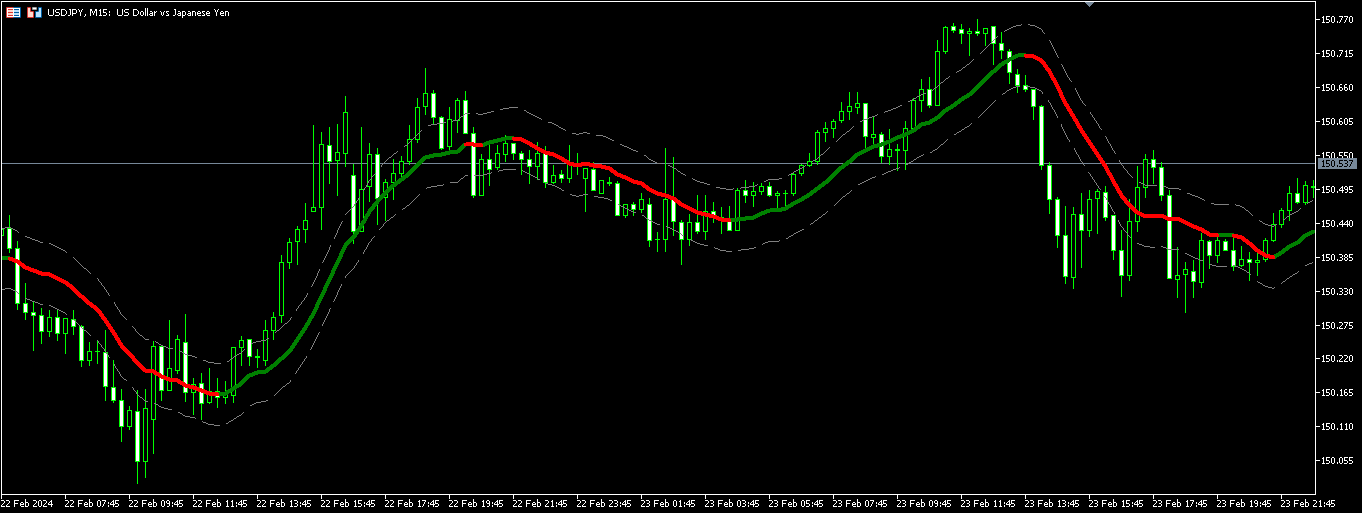
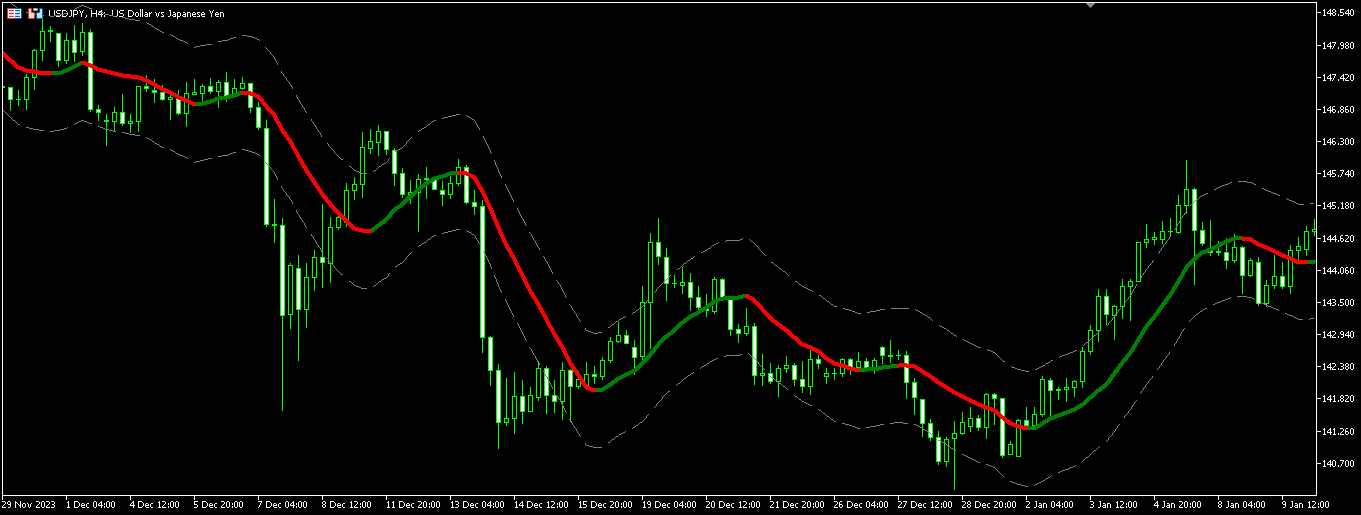
Moving Average Color
Moving Average (MA) is a trend indicator, which is a curved line that is calculated based on price changes. Accordingly, the moving average is the trader’s assistant, which confirms the trend. On the chart it looks like a bending line that repeats the price movement, but more smoothly.
Moving Average Color it is a standard moving average indicator with a color change when the trend direction changes. The ability to set additional levels has also been added.
It is a handy tool for visual trending both for manual trading and for automating your strategies.
Buffers for connecting the indicator to your expert:
0 - Buy;
1 - Sell;
2 - Upper additional level;
3 - Lower additional level;


Works well, easy to use. Great !!