IPDA Standard Deviations

> Introduction and Acknowledgements
The IPDA Standard Deviations tool encompasses the Time and price relationship as studied by Dexter's .

I am not the creator of this Theory, and I do not hold the answers to all the questions you may have; I suggest you to study it from Dexter's tweets, videos, and material.

> Tool Description

This is purely a graphical aid for traders to be able to quickly determine Fractal IPDA Time Windows, and trace the potential Standard Deviations of the moves at their respective high and low extremes.

The disruptive value of this tool is that it allows traders to save Time by automatically adapting the Time Windows based on the current chart's Timeframe, as well as providing customizations to filter and focus on the appropriate Standard Deviations.

> IPDA Standard Deviations by TraderDext3r

The underlying idea is based on the Interbank Price Delivery Algorithm's lookback windows on the daily chart as taught by the Inner Circle Trader:

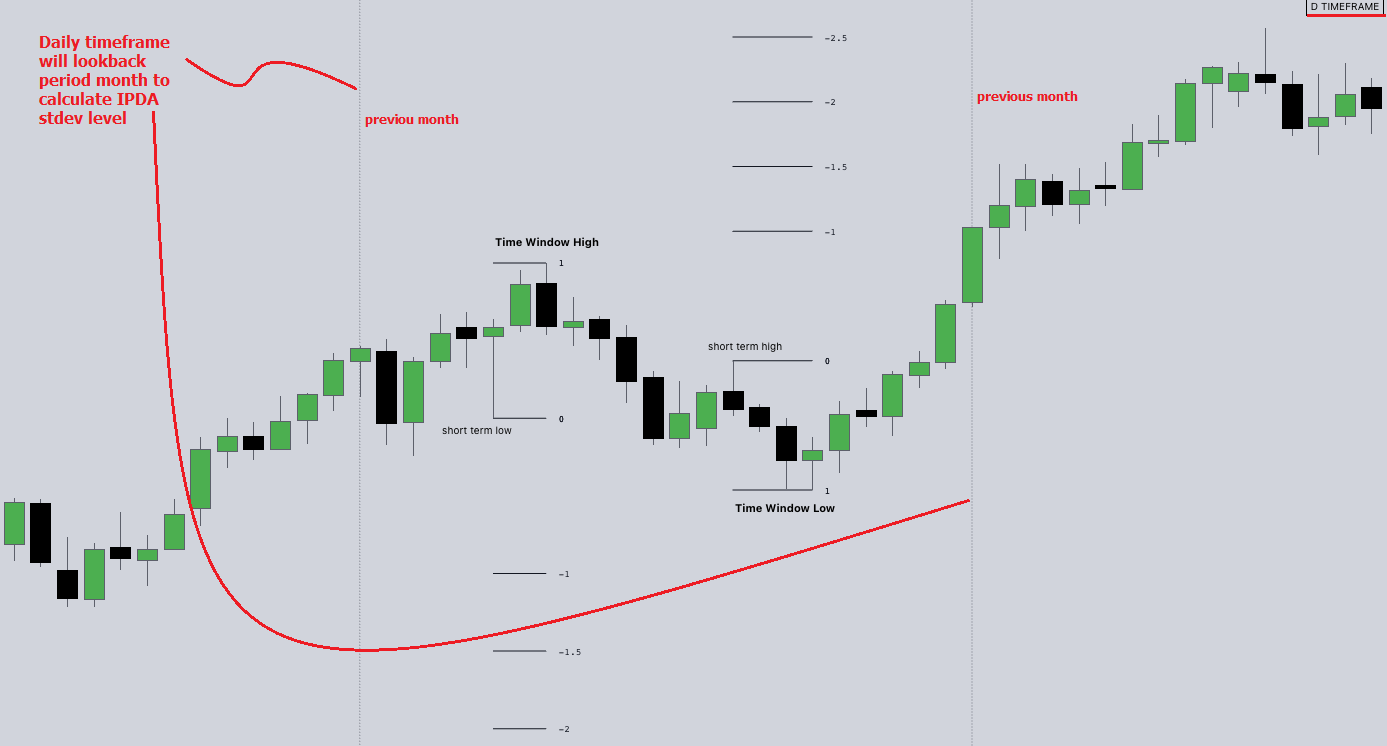
IPDA looks at the past three months of price action to determine how to deliver price in the future.

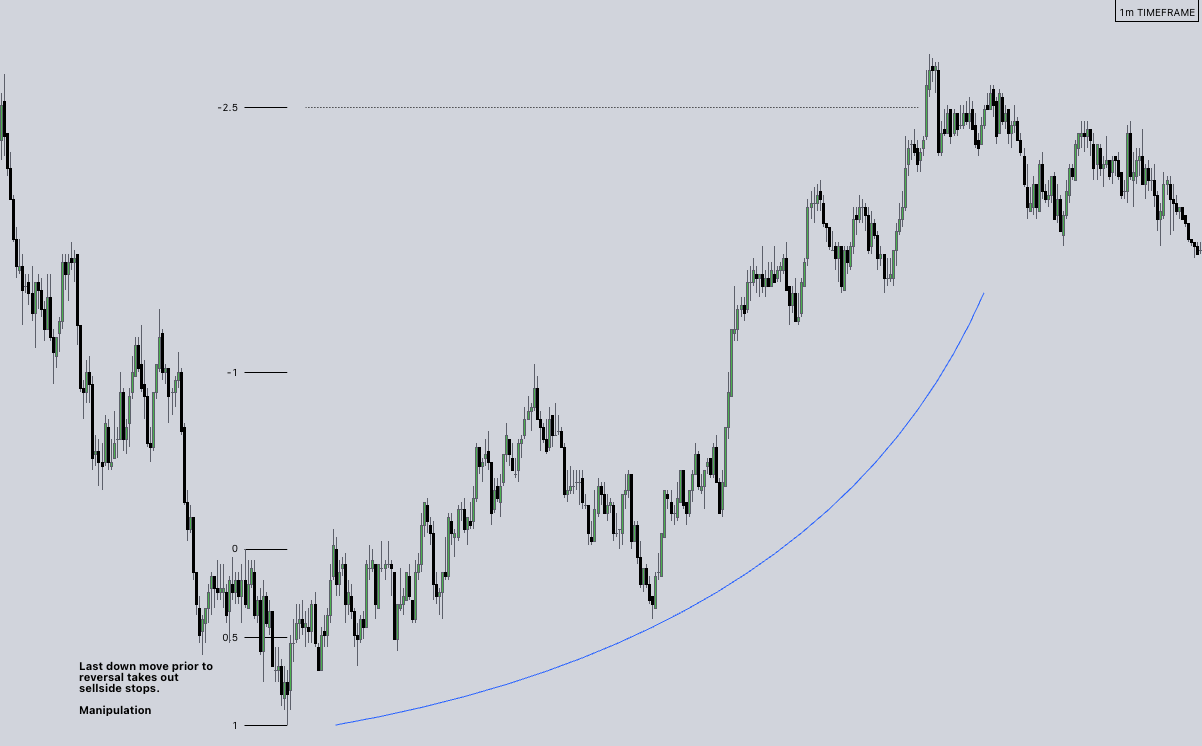
Additionally, the ICT concept of projecting specific manipulation moves prior to large displacement upwards/downwards is used to navigate and interpret the priorly mentioned displacement move. We pay attention to specific Standard Deviations based on the current environment and overall narrative.

Dexter being one of the most prominent Inner Circle Trader students, harnessed the fractal nature of price to derive fractal IPDA Lookback Time Windows for lower Timeframes, and studied the behaviour of price at specific Deviations.

For Example:

  • The -1 to -2 area can initiate an algorithmic retracement before continuation.
  • The -2 to -2.5 area can initiate an algorithmic retracement before continuation, or a Smart Money Reversal.
  • The -4 area should be seen as the ultimate objective, or the level at which the displacement will slow down.
Given that these ideas stem from ICT's concepts themselves, they are to be used hand in hand with all other ICT Concepts (PD Array Matrix, PO3, Institutional Price Levels, ...).

> Fractal IPDA Time Windows

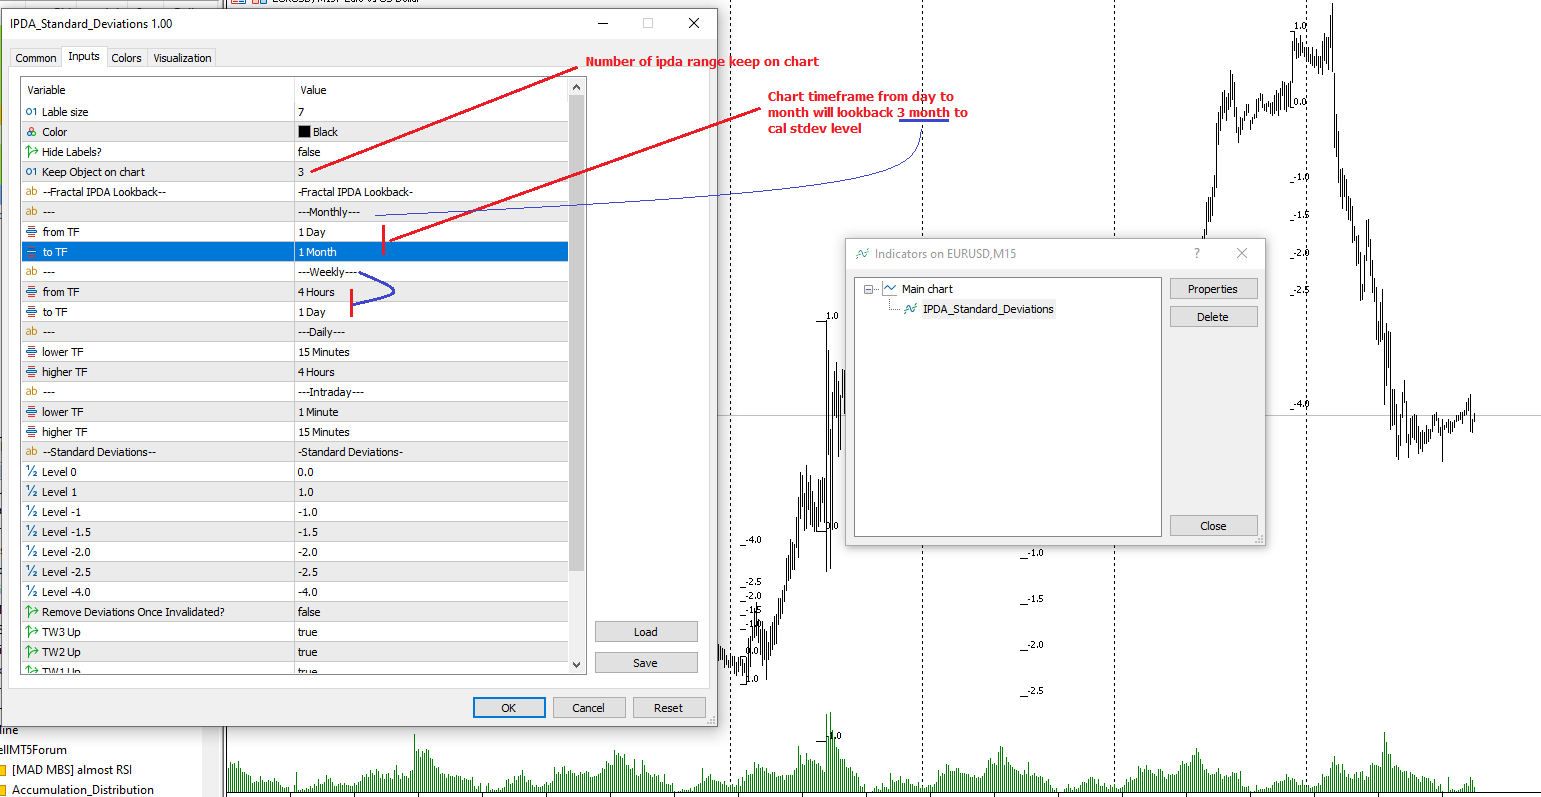
The IPDA Lookbacks Types identified by Dexter are as follows:

Monthly – 1D Chart: one widow per Month, highlighting the past three Months.

Weekly – 4H to 8H Chart: one window per Week, highlighting the past three Weeks.

Daily – 15m to 1H Chart: one window per Day, highlighting the past three Days.

Intraday – 1m to 5m Chart: one window per 4 Hours highlighting the past 12 Hours.

Inside these three respective Time Windows, the extreme High and Low will be identified, as well as the prior opposing short term market structure point. These represent the anchors for the Standard Deviation Projections.


Prodotti consigliati
The indicator plots three consecutive channels by Close prices and checks if they match the scheme shown in the screenshots. The length of each channel is not fixed and is selected by the program within the range ChMin and ChMax . When the match is found, a signal is formed (an appropriately colored arrow). A possible stop loss level is displayed as a diamond. A signal may be accompanied by a pop-up window, a push notification and/or an email. The indicator works by Open prices. Parameters ChMi
Lomb Periodogram
Alfred Mirzasalikhov
The Lomb algorithm is designed to find the dominant cycle length in noisy data. It is used commonly in the field of astronomy and is very good at extracting cycle out of really noisy data sets. The Lomb phase plot is very similar to the Stochastics indicator. It has two threshold levels. When it crosses above the lower level it’s a buy signal. When it crosses the upper level it’s a sell signal. This is cycle-based indicator, the nicer waves look, the better the signal. Caution Also It’s really i
Will Spread
Paulo Henrique Faquineli Garcia
The Larry Wiliams' indicator named WillSpread considers the influence of the secondary Asset (Symbol) on the current Asset (trading). Indicator essence is to transform the correlation between assets in accumulated history data, providing an opportunity to detect various peculiarities and patterns in price dynamics which are invisible to the naked eye. Based on this information, traders can assume further price movement and adjust their strategy accordingly. As exposed on his Book, Larry says: "a
K Channel
Pavel Gotkevitch
K_Channel is a technical indicator defining the current Forex market status - trend or flat. The indicator works on any timeframe. H1 and higher timeframes are recommended though to minimize false signals. The indicator is displayed as lines above and below EMA. Average True Range (ATR) is used as bands' width. Therefore, the channel is based on volatility. This version allows you to change all the parameters of the main Moving Average. Unlike Bollinger Bands that applies the standard deviation
WAPV Weis Wave Chart Forex
Eduardo Da Costa Custodio Santos
Il Weis Wave Chart Forex per MT5 è un indicatore di prezzo e volume. La lettura del prezzo e del volume è stata ampiamente diffusa tramite Richard Demille Wyckoff sulla base delle tre leggi da lui create: offerta e domanda, causa ed effetto e sforzo contro risultato. Già nel 1900 R.Wyckoff utilizzava la carta delle onde nelle sue analisi. Molti anni dopo, intorno al 1990, David Weis ha automatizzato il diagramma delle onde di R. Wyckoff e oggi vi portiamo l'evoluzione del diagramma delle onde di
Precision Arrows
Nervada Emeule Adams
Precision Arrows – Segnali di ingresso precisi con TP e SL integrati Precision Arrows è un indicatore di trading avanzato progettato per trader che cercano precisione, chiarezza e affidabilità . Identifica segnali di acquisto e vendita ad alta probabilità e genera automaticamente i livelli di Take Profit (TP) e Stop Loss (SL) , consentendo operazioni disciplinate e costanti su Forex, Indici, Criptovalute e Indici Sintetici . L’indicatore combina rilevamento preciso dei segnali, filtraggio intell
Trend Lines Scalper
Magdalena Estefania Colonna
TREND LINES Scalper Professional Indicator OVERVIEW Trend Lines Scalper is a highly accurate, advanced indicator designed specifically for professional traders looking to maximize their scalping opportunities by automatically detecting trend lines and high-probability signals. This powerful algorithm combines classic technical analysis with modern technology, automatically identifying price patterns and generating accurate, real-time signals for successful scalping trades. MAIN FEATURES
Renko System
Marco Montemari
This indicator can be considered as a trading system. It offers a different view to see the currency pair: full timeless indicator, can be used for manual trading or for automatized trading with some expert advisor. When the price reaches a threshold a new block is created according to the set mode. The indicator beside the Renko bars, shows also 3 moving averages. Features renko mode median renko custom median renko 3 moving averages wicks datetime indicator for each block custom notification
"VWAP giornaliero avanzato con deviazione standard e bande di trading" Descrizione: "L'indicatore 'VWAP giornaliero avanzato con deviazione standard e bande di trading' offre una visione completa per gli operatori che desiderano utilizzare il Volume Weighted Average Price (VWAP) come fulcro della loro strategia di trading. Non solo calcola il VWAP su base giornaliera, ma incorpora anche la deviazione standard per fornire una rappresentazione precisa della volatilità del mercato. Le bande di trad
LBR Oscillator
Pablo Filipe Soares De Almeida
LBR Oscillator – 3/10 Oscillator L’LBR Oscillator è una versione migliorata del classico 3/10 Oscillator, ampiamente utilizzato e reso popolare dalla trader professionista Linda Raschke. Questo indicatore è stato sviluppato seguendo la configurazione standard originale utilizzata da Linda Raschke, con medie mobili a 3 e 10 periodi e una linea di segnale a 16 periodi, focalizzato sulla lettura del momentum e sui cambiamenti del ritmo di mercato. Base concettuale – Come Linda Raschke utilizza il 3
InfinX Slope MT5
Stanislav Shtiliyanov
The Slope indicator   measures the slope of a linear regression , which is the line of best fit for a data series. A 20-period Slope, therefore, measures the slope of a 20-day linear regression. ... In general, a positive slope indicates an uptrend, while a negative slope indicates a downtrend. How do you use slope Indicator? By applying the slope indicator  to both the price chart and the price relative , chartists can quantify the price trend and relative performance with one indicator. A pos
ZLMA Trend Candles indicator uses an enhanced Zero-Lag Moving Average to highlight key trend shifts, repainting candles in real time. It reacts faster than traditional moving averages, helping you spot potential market turns earlier. Gain clear entry and exit signals and filter out market noise with ease! This product is also available for MetaTrader 4 =>  https://www.mql5.com/en/market/product/129279 1. What Is ZLMA Trend Candles? ZLMA Trend Candles is a MetaTrader 4/5 indicator based on the Z
A Média Móvel é um indicador que faz parte da Análise Técnica. Com ela, é possível identificar o equilíbrio dos preços no mercado, observando tendências de alta, neutra ou baixa. Este indicador customizado traz opções extras pera definir o método de cálculo podendo-se esclolher entre SMA,EMA,SSMA,LWMA,JJMA,JurX,ParMA,T3,Vidya,AMA,HULL MA. Também conta com varias opções para escolher o método de cálculo para o preço base a ser usado no cáculo da média.
Crisis Trading
PEYMAN MEMARINAMIN
An indicator to fetch the market shocks from the economic events directly to the chart. It indicates the surprise factor (actual published data minus the expected value) exactly on the right candlestick! The bigger the value of the indicator, the higher price gap will be. The indicator's value and sign gives a great opportunity to forecast the amount and direction of the price gap. Do not miss any opportunity by setting an Expert Advisor to place buy or sell orders based on this indicator's valu
Limitless MT5
Dmitriy Kashevich
Limitless MT5 is a universal indicator suitable for every beginner and experienced trader. works on all currency pairs, cryptocurrencies, raw stocks Limitless MT5 - already configured and does not require additional configuration And now the main thing Why Limitless MT5? 1 complete lack of redrawing 2 two years of testing by the best specialists in trading 3 the accuracy of correct signals exceeds 80% 4 performed well in trading during news releases Trading rules 1 buy signal - the ap
Log Returns Indicator
Cedric Jean Guy Pisson
This LogReturnsIndicator.mq5 calculates and displays the logarithmic returns ("log returns") of the closing prices of a financial asset. It computes the log-returns for each period using the formula: log return=ln⁡(close[i]close[i−1]) This measures the relative variation between consecutive closing prices in logarithmic terms, a method often used in finance to analyze the returns of financial assets. Benefits of Log Returns: Logarithmic returns are preferred in certain financial analyses b
Robotizz Indicator is a powerful trading indicator using price action and moving averages. Robotizz indicares with arrows on long trades ir short trades, showing some TP and SL points too. It works with any symbol, even on forex markets or B3 Brazilian markets. You can configure moving averages periods, besides simple or exponential moving averages. Also it is possible to configure arrow position. Try Robotizz for one month and take a boost on your manual trades.
Oscillatore di momentum avanzato che regola automaticamente il suo periodo in base alla volatilità del mercato per segnali di ipercomprato e ipervenduto più accurati. Come Funziona: L'indicatore utilizza un calcolo del periodo adattivo che si riduce durante l'alta volatilità e si allunga durante la bassa volatilità. Questa regolazione dinamica fornisce segnali più rapidi quando il mercato è in trend e riduce i falsi segnali durante le fasi di lateralità. Il valore RSI viene calcolato sulla base
FREE
BeST_Keltner Channels Strategies MT5   is an  MT5  Indicator based on the original Keltner Channels Indicator and it can display in the Chart all the known Variations of Keltner Channels and also the corresponding 10 totally Strategies. Every such generally consists of a Central Moving Average Line and two Boundary Bands at a distance above and below it and can be traded mainly in a Trending Mode but also in a Ranging ReEntry Mode.  BeST_Keltner Channels Strategies Indicator Draws definite Buy
AW Heiken Ashi MT5
AW Trading Software Limited
AW Heiken Ashi — Indicatore intelligente di trend e livelli di TP. Indicatore avanzato basato sul classico Heiken Ashi, adattato ai trader, con maggiore flessibilità e chiarezza. A differenza dell'indicatore standard, AW Heiken Ashi aiuta ad analizzare il trend, a determinare gli obiettivi di profitto e a filtrare i falsi segnali, fornendo decisioni di trading più affidabili. Guida all'installazione e istruzioni - Qui / Versione MT4 - Qui Vantaggi di AW Heiken Ashi: Funziona su qualsiasi risorsa
Dynamic Adaptive Renko Indicator
AL MOOSAWI ABDULLAH JAFFER BAQER
Dynamic Adaptive Renko: Trade with the Trend, Not the Noise Are you tired of choppy markets and false signals that erode your confidence and your account balance? The Dynamic Adaptive Renko indicator is the definitive solution for traders seeking clarity and precision. It intelligently filters out market noise, allowing you to focus on what truly matters: the underlying trend. By dynamically adapting to market volatility, this indicator provides clear, actionable signals to help you enter and e
All about time and price by ICT. This indicator provides a comprehensive view of ICT killzones, Silver Bullet times, and ICT Macros, enhancing your trading experience.  In those time windows price either seeks liquidity or imbalances and you often find the most energetic price moves and turning points. Features: Automatic Adaptation: The ICT killzones intelligently adapt to the specific chart you are using. For Forex charts, it follows the ICT Forex times: In EST timezone: Session: Asia: 20h00-0
Highly configurable MFI indicator. Features: Highly customizable alert functions (at levels, crosses, direction changes via email, push, sound, popup) Multi timeframe ability Color customization (at levels, crosses, direction changes) Linear interpolation and histogram mode options Works on strategy tester in multi timeframe mode (at weekend without ticks also) Adjustable Levels Parameters: MFI Timeframe:  You can set the current or a higher timeframes for MFI. MFI Bar Shift:   you can set the
FREE
Order Book, known also as Market Book, market depth, Level 2, - is a dynamically updated table with current volumes of orders to buy and to sell specific financial instument at price levels near Bid and Ask. MetaTrader 5 provides the means for receiving market book from your broker, but in real time only, without access to its history. The indicator OrderBook Cumulative Indicator accumulates market book data online and visualizes them on the chart. In addition, the indicator can show the market
The Market Structure Trend Targets is a powerful trading indicator designed to give traders a clear, structured, and data-driven view of market momentum, breakouts, and key price reaction zones. Built on the principles of smart market structure analysis , it helps identify not only trend direction, but also precise breakout levels , trend exhaustion , and potential reversal zones — all with visual clarity and trader-friendly metrics. Key Features Breakout Points with Numbered Markers Track signi
Fractal Pivot Lines — Indicator Overview   Fractal Pivot Lines is a custom trend-structure indicator for MetaTrader 5 . It automatically connects key fractal highs and lows with dynamic lines so you can see how price is respecting local structure, building channels, and preparing for potential reversals. Instead of staring at dozens of candles and guessing where the real pivots are, the indicator turns fractals into clear support/resistance paths and trend channels . What the Indicator Does
This is Gekko's Cutomized Cutomized Average Directional Index (ADX), a customized version of the famous ADX indicator. Use the regular ADX and take advantage two entry signals calculations and different ways of being alerted whenever there is potential entry or exit point. Inputs Period: Period for the ADX calculation; PlotSignalType: How will the indicator calculate entry (swing) signals: 1- ShowSwingsOnTrendLevel : Show Signals for Trend Confirmation Swings; 2- ShowSwingsOnTrendLevelDirection
Ichimoku Aiko MTF
Michael Jonah Randriamampionontsoa
Ichimoku Aiko MTF is a collection of technical indicators that show support and resistance levels, as well as momentum and trend direction. It is a multi-timeframe indicator so you don't need to change the chart timeframe when you want to see the ichimoku clouds on a higher timeframe.  eg. The chart timeframe is M15 and you want to see on the M15 timeframe chart the H1 ichimoku indicators (the ichimoku in Metatrader can't do that) that's why you need to use Ichimoku Aiko MTF.
Owl Smart Levels MT5
Sergey Ermolov
4.03 (32)
Versione MT4  |  FAQ L' indicatore Owl Smart Levels è un sistema di trading completo all'interno dell'unico indicatore che include strumenti di analisi di mercato popolari come i frattali avanzati di Bill Williams , Valable ZigZag che costruisce la corretta struttura a onde del mercato, e i livelli di Fibonacci che segnano i livelli esatti di entrata nel mercato e luoghi per prendere profitti. Descrizione dettagliata della strategia Istruzioni per lavorare con l'indicatore Consulente-assistente
Gli utenti di questo prodotto hanno anche acquistato
Se acquisti questo indicatore, riceverai il mio Trade Manager Professionale + EA  GRATUITAMENTE. Innanzitutto è importante sottolineare che questo sistema di trading è un indicatore Non-Repainting, Non-Redrawing e Non-Lagging, il che lo rende ideale sia per il trading manuale che per quello automatico. Corso online, manuale e download di preset. Il "Sistema di Trading Smart Trend MT5" è una soluzione completa pensata sia per i trader principianti che per quelli esperti. Combina oltre 10 indicat
Divergence Bomber
Ihor Otkydach
4.9 (81)
Ogni acquirente dell’indicatore riceverà inoltre gratuitamente: L’utilità esclusiva “Bomber Utility”, che gestisce automaticamente ogni operazione, imposta i livelli di Stop Loss e Take Profit e chiude le posizioni secondo le regole della strategia I file di configurazione (set file) per adattare l’indicatore a diversi asset I set file per configurare il Bomber Utility in tre modalità: “Rischio Minimo”, “Rischio Bilanciato” e “Strategia di Attesa” Una guida video passo-passo per installare, conf
Power Candles MT5
Daniel Stein
5 (5)
Power Candles – Segnali di ingresso basati sulla forza per tutti i mercati Power Candles porta l’analisi di forza collaudata di Stein Investments direttamente sul grafico dei prezzi. Invece di reagire solo al prezzo, ogni candela viene colorata in base alla reale forza di mercato, consentendo di identificare immediatamente accumuli di momentum, accelerazioni della forza e transizioni di trend pulite. Un’unica logica per tutti i mercati Power Candles funziona automaticamente su tutti i simboli di
SuperScalp Pro
Van Minh Nguyen
5 (1)
SuperScalp Pro – Sistema avanzato di indicatore per scalping con filtri multipli SuperScalp Pro è un sistema avanzato di indicatore per scalping che combina il classico Supertrend con molteplici filtri di conferma intelligenti. L’indicatore funziona in modo efficiente su tutti i timeframe da M1 a H4 ed è particolarmente adatto per XAUUSD, BTCUSD e le principali coppie Forex. Può essere utilizzato come sistema stand-alone o integrato in modo flessibile nelle strategie di trading esistenti. L’indi
Entry In The Zone and SMC Multi Timeframe è uno strumento di analisi di mercato in tempo reale sviluppato sulla base degli Smart Money Concepts (SMC). È progettato per aiutare i trader ad analizzare la struttura del mercato in modo sistematico e ottenere una visione più chiara della direzione generale del mercato. Il sistema analizza automaticamente i Punti di Inversione, le Zone Chiave e la Market Structure su più timeframe, mostrando Point of Interest (POI), segnali No Repaint e Auto Fibonacci
Azimuth Pro
Ottaviano De Cicco
5 (1)
LAUNCH PROMO Azimuth Pro price is initially set at 299$ for the first 100 buyers. Final price will be 499$ . THE DIFFERENCE BETWEEN RETAIL AND INSTITUTIONAL ENTRIES ISN'T THE INDICATOR — IT'S THE LOCATION. Most traders enter at arbitrary price levels, chasing momentum or reacting to lagging signals. Institutions wait for price to reach structured levels where supply and demand actually shift. Azimuth Pro maps these levels automatically: swing-anchored VWAP, multi-timeframe structure lines, an
Game Changer è un indicatore di tendenza rivoluzionario, progettato per essere utilizzato su qualsiasi strumento finanziario, per trasformare il tuo Metatrader in un potente analizzatore di trend. L'indicatore non ridisegna e non subisce ritardi. Funziona su qualsiasi intervallo temporale e aiuta a identificare i trend, segnala potenziali inversioni, funge da meccanismo di trailing stop e fornisce avvisi in tempo reale per risposte tempestive del mercato. Che tu sia un trader esperto, un profess
Atomic Analyst MT5
Issam Kassas
4.07 (28)
Innanzitutto, vale la pena sottolineare che questo indicatore di trading non è repaint, non è ridisegno e non presenta ritardi, il che lo rende ideale sia per il trading manuale che per quello automatico. Manuale utente: impostazioni, input e strategia. L'Analista Atomico è un indicatore di azione del prezzo PA che utilizza la forza e il momentum del prezzo per trovare un miglior vantaggio sul mercato. Dotato di filtri avanzati che aiutano a rimuovere rumori e segnali falsi, e aumentare il pote
FX Power MT5 NG
Daniel Stein
5 (30)
FX Power: Analizza la Forza delle Valute per Decisioni di Trading Più Intelligenti Panoramica FX Power è lo strumento essenziale per comprendere la reale forza delle principali valute e dell'oro in qualsiasi condizione di mercato. Identificando le valute forti da comprare e quelle deboli da vendere, FX Power semplifica le decisioni di trading e rivela opportunità ad alta probabilità. Che tu segua le tendenze o anticipi inversioni utilizzando valori estremi di Delta, questo strumento si adatta
Smart Stop Indicator – Precisione intelligente dello stop-loss direttamente sul grafico Panoramica Smart Stop Indicator è la soluzione ideale per i trader che desiderano posizionare il loro stop-loss in modo chiaro e metodico, senza dover indovinare o affidarsi all’intuizione. Questo strumento combina la logica classica del price action (massimi e minimi strutturali) con un moderno riconoscimento dei breakout per identificare il prossimo livello di stop realmente logico. In trend, in range o i
Innanzitutto, vale la pena sottolineare che questo Strumento di Trading è un Indicatore Non-Ridipingente, Non-Ridisegnante e Non-Laggante, il che lo rende ideale per il trading professionale. Corso online, manuale utente e demo. L'Indicatore Smart Price Action Concepts è uno strumento molto potente sia per i nuovi che per i trader esperti. Racchiude più di 20 utili indicatori in uno solo, combinando idee di trading avanzate come l'Analisi del Trader del Circolo Interno e le Strategie di Tradin
Super Signal – Skyblade Edition Sistema professionale di segnali di tendenza senza repaint / senza ritardo con tasso di vincita eccezionale | Per MT4 / MT5 Funziona meglio su timeframe più bassi, come 1 minuto, 5 minuti e 15 minuti. Caratteristiche principali: Super Signal – Skyblade Edition è un sistema intelligente di segnali progettato specificamente per il trading di tendenza. Utilizza una logica di filtraggio multilivello per identificare esclusivamente i movimenti direzionali forti, supp
Berma Bands
Muhammad Elbermawi
5 (7)
L'indicatore Berma Bands (BBs) è uno strumento prezioso per i trader che cercano di identificare e capitalizzare i trend di mercato. Analizzando la relazione tra il prezzo e le BBs, i trader possono discernere se un mercato è in una fase di trend o di range. Visita il [ Berma Home Blog ] per saperne di più. Le Berma Bands sono composte da tre linee distinte: la Upper Berma Band, la Middle Berma Band e la Lower Berma Band. Queste linee sono tracciate attorno al prezzo, creando una rappresentazion
Gold Sniper Scalper Pro
Ich Khiem Nguyen
3.5 (8)
Gold Sniper Scalper Pro è un indicatore professionale per MetaTrader 5, progettato per supportare i trader nell'identificare punti di ingresso e gestire il rischio in modo efficace. L'indicatore fornisce un set completo di strumenti analitici che include un sistema di rilevamento dei segnali, gestione automatica di Entry/SL/TP, analisi del volume e statistiche delle performance in tempo reale. Guida utente per comprendere il sistema   |   Guida utente per altre lingue CARATTERISTICHE PRINCIPALI
Trend Screener Pro MT5
STE S.S.COMPANY
4.84 (100)
Indicatore di tendenza, soluzione unica rivoluzionaria per il trading di tendenze e il filtraggio con tutte le importanti funzionalità di tendenza integrate in un unico strumento! È un indicatore multi-timeframe e multi-valuta al 100% non ridipingibile che può essere utilizzato su tutti i simboli/strumenti: forex, materie prime, criptovalute, indici e azioni. Trend Screener è un indicatore di tendenza che segue un indicatore efficiente che fornisce segnali di tendenza a freccia con punti nel gra
AriX
Temirlan Kdyrkhan
1 (4)
AriX Indicator for MT5 A powerful trend-following and signal-evaluation tool AriX is a custom MT5 indicator that combines Moving Averages and ATR-based risk/reward logic to generate clear buy/sell signals. It visualizes dynamic SL/TP levels, evaluates past trade outcomes, and displays win/loss statistics in a clean on-chart panel. Key features include: Buy/Sell signals based on MA crossovers ATR-based SL/TP1/TP2/TP3 levels with visual lines and labels Signal outcome tracking with real-time stat
PZ Swing Trading MT5
PZ TRADING SLU
5 (5)
Protect against whipsaws: revolutionize your swing trading approach Swing Trading is the first indicator designed to detect swings in the direction of the trend and possible reversal swings. It uses the baseline swing trading approach, widely described in trading literature. The indicator studies several price and time vectors to track the aggregate trend direction and detects situations in which the market is oversold or overbought and ready to correct. [ Installation Guide | Update Guide | Tro
TPSproTREND PrO MT5
Roman Podpora
4.74 (19)
TPSproTrend PRO identifica il momento in cui il mercato cambia effettivamente direzione e forma un punto di ingresso all'inizio del movimento. Si entra nel mercato quando il prezzo sta appena iniziando a muoversi, e non dopo che il movimento si è già verificato.   Indicatore       Non ridisegna i segnali e visualizza automaticamente i punti di ingresso, lo Stop Loss e il Take Profit, rendendo il trading chiaro, visivo e strutturato. ISTRUZIONI RUS   -   VERSIONE MT4 Vantaggi principali Segnali
Trend Forecaster
Alexey Minkov
5 (7)
The Trend Forecaster indicator utilizes a unique proprietary algorithm to determine entry points for a breakout trading strategy. The indicator identifies price clusters, analyzes price movement near levels, and provides a signal when the price breaks through a level. The Trend Forecaster indicator is suitable for all financial assets, including currencies (Forex), metals, stocks, indices, and cryptocurrencies. You can also adjust the indicator to work on any time frames, although it is recommen
M1 Scalper Pro MT5
Elif Kaya
4.64 (11)
- Real price is 80$ - 45% Discount (It is 45$ now) Contact me for extra bonus   indicator, instruction or any questions! - Lifetime update free - Non-repaint - Related product: Gann Gold EA - I just sell my products in Elif Kaya Profile, any other websites are stolen old versions, So no any new updates or support. Advantages of  M1 Scalper Pro  Profitability: M1 Scalper Pro is highly profitable with a strict exit strategy. Frequent Opportunities: M1 Scalper Pro  takes advantage of numerous smal
Ottieni l’indicatore AUX GRATUITO e il supporto EA Download diretto — Clicca qui [ D.I.C.E ] The DICE Indicator  Divergence in Chaos Environment è uno strumento MT5 specializzato per trader che applicano la Teoria delle Onde di Elliott nel contesto delle tecniche di Trading Chaos. Identifica divergenze nascoste e regolari nell’azione dei prezzi, sincronizzate con l’ambiente di mercato caotico descritto da Bill Williams. Caratteristiche principali Divergenza allineata alle Onde di Elliott: rilev
Advanced Supply Demand MT5
Bernhard Schweigert
4.5 (14)
La migliore soluzione per qualsiasi principiante o trader esperto! Questo indicatore è uno strumento di trading unico, di alta qualità e conveniente perché abbiamo incorporato una serie di funzionalità proprietarie e una nuova formula. Con questo aggiornamento, sarai in grado di mostrare fusi orari doppi. Non solo potrai mostrare una TF più alta, ma anche entrambe, la TF del grafico, PIÙ la TF più alta: SHOWING NESTED ZONES. Tutti i trader di domanda di offerta lo adoreranno. :) Informazioni imp
Grabber System MT5
Ihor Otkydach
4.82 (22)
Ti presento un eccellente indicatore tecnico: Grabber, che funziona come una strategia di trading "tutto incluso", pronta all’uso. In un solo codice sono integrati strumenti potenti per l’analisi tecnica del mercato, segnali di trading (frecce), funzioni di allerta e notifiche push. Ogni acquirente di questo indicatore riceve anche gratuitamente: L’utility Grabber: per la gestione automatica degli ordini aperti Video tutorial passo dopo passo: per imparare a installare, configurare e utilizzare
Support And Resistance Screener è in un indicatore di livello per MetaTrader che fornisce più strumenti all'interno di un indicatore. Gli strumenti disponibili sono: 1. Screener della struttura del mercato. 2. Zona di ritiro rialzista. 3. Zona di ritiro ribassista. 4. Punti pivot giornalieri 5. Punti pivot settimanali 6. Punti pivot mensili 7. Forte supporto e resistenza basati sul modello e sul volume armonici. 8. Zone a livello di banca. OFFERTA A TEMPO LIMITATO: il supporto HV e l'indicatore
Trend indicator AI mt5
Ramil Minniakhmetov
5 (13)
Trend Ai indicator è un ottimo strumento che migliorerà l'analisi di mercato di un trader combinando l'identificazione della tendenza con punti di ingresso utilizzabili e avvisi di inversione. Questo indicatore consente agli utenti di navigare nelle complessità del mercato forex con fiducia e precisione Oltre ai segnali primari, l'indicatore Ai di tendenza identifica i punti di ingresso secondari che si presentano durante i pullback o i ritracciamenti, consentendo ai trader di capitalizzare le
Market Structure Patterns
Samuel Manoel De Souza
4.47 (19)
Disponibile per   MT4   e   MT5 . Unisciti al canale Market Structure Patterns per scaricare materiale di studio e/o informazioni aggiuntive. Pubblicazioni correlate: Market Structure Patterns - Introduzione Acquistalo ora con 50% di sconto | Prezzo precedente $90 | Offerta valida fino al 31 dicembre | Un importante aggiornamento è in arrivo e il prezzo originale verrà adeguato. Market Structure Patterns   è un indicatore basato sui   Smart Money Concepts   che mostra gli   elementi SMC/ICT  
FX Volume MT5
Daniel Stein
4.79 (24)
FX Volume: Scopri il Vero Sentimento di Mercato dalla Prospettiva di un Broker Panoramica Rapida Vuoi portare la tua strategia di trading a un livello superiore? FX Volume ti offre informazioni in tempo reale su come i trader retail e i broker sono posizionati—molto prima che compaiano report in ritardo come il COT. Che tu miri a guadagni costanti o desideri semplicemente un vantaggio più solido sui mercati, FX Volume ti aiuta a individuare grandi squilibri, confermare i breakout e perfezionar
Matrix Arrow Indicator MT5
Juvenille Emperor Limited
5 (18)
Matrix Arrow Indicator MT5   è un trend unico 10 in 1 che segue un indicatore multi-timeframe al   100% non ridipinto   che può essere utilizzato su tutti i simboli/strumenti:   forex ,   materie prime ,   criptovalute ,   indici ,   azioni .  Matrix Arrow Indicator MT5  determinerà la tendenza attuale nelle sue fasi iniziali, raccogliendo informazioni e dati da un massimo di 10 indicatori standard, che sono: Indice di movimento direzionale medio (ADX) Indice del canale delle materie prime (CCI
AW Trend Predictor MT5
AW Trading Software Limited
4.76 (54)
La combinazione di trend e livelli di rottura in un unico sistema. Un algoritmo di indicatore avanzato filtra il rumore del mercato, determina la tendenza, i punti di ingresso e i possibili livelli di uscita. I segnali indicatori sono registrati in un modulo statistico, che permette di selezionare gli strumenti più adatti, mostrando l'efficacia dello storico dei segnali. L'indicatore calcola i segni Take Profit e Stop Loss. Manuale e istruzioni ->   QUI   / versione MT4 ->   QUI Come fare tradi
The Super Arrow Indicator provides non-repainting buy and sell signals with exceptional accuracy. Key Features No repainting – confirmed signals remain fixed Clear visual arrows: green for buy, red for sell Real-time alerts via pop-up, sound, and optional email Clean chart view with no unnecessary clutter Works on all markets: Forex, gold, oil, indices, crypto Adjustable Parameters TimeFrame Default:   "current time frame" Function:   Sets the time frame for indicator calculation Options:   Can
Altri dall’autore
ICT Concepts
Minh Truong Pham
5 (2)
The ICT Concepts indicator regroups core concepts highlighted by trader and educator "The Inner Circle Trader" (ICT) into an all-in-one toolkit. Features include Market Structure (MSS & BOS), Order Blocks, Imbalances, Buyside/Sellside Liquidity, Displacements, ICT Killzones, and New Week/Day Opening Gaps. It’s one kind of Smart money concepts. USAGE: Please read this document  !    DETAILS Market Structure Market structure labels are constructed from price breaking a prior extreme point. T
This indicator provides the ability to recognize the SMC pattern, essentially a condensed version of the Wyckoff model. Once the pattern is confirmed by RTO, it represents a significant investment opportunity.    There are numerous indicators related to SMC beyond the market, but this is the first indicator to leverage patterns to identify specific actions of BigBoy to  navigate the market. Upgrade 2024-03-08: Add TP by RR feature. The SMC (Smart Money Concept)   pattern   is a market analysis m
This all-in-one indicator displays real-time market structure (internal & swing BOS / CHoCH), order blocks, premium & discount zones, equal highs & lows, and much more...allowing traders to automatically mark up their charts with widely used price action methodologies. Following the release of our Fair Value Gap script, we received numerous requests from our community to release more features in the same category. "Smart Money Concepts" (SMC) is a fairly new yet widely used term amongst price a
The Hull  Butterfly  Oscillator (HBO) is an oscillator constructed from the difference between a regular  Hull Moving Average  (  HMA  ) and another with coefficients flipped horizontally . Levels are obtained from cumulative means of the absolute value of the oscillator. These are used to return dots indicating potential reversal points . This indicator draw line in separate window, plus blue dot (for buy signal) when hull oscillator is peak and red when sell signal. It  also includes integrate
Detect divergence (classic, hidden) price and all oscillator indicator include: RSI, CCI, MACD, OSMA, Stochastic, Momentum, Awesome Oscillator (AO), Accelerator Oscillator (AC), Williams Percent Range (WPR), Relative Vigor Index (RVI), Rate of Change (ROC). Confirm reversal with dochian channel for to improve signal quality. Divergence is when the price of an asset is moving in the opposite direction of a technical   indicator , such as an oscillator, or is moving contrary to other data. Diverge
This is addition of  Effective SV squeeze momentum  that add bolliger band and Keltner channel to chart window.  Squeeze momentum introduced by “John Carter”, the squeeze indicator for MT5 represents a volatility-based tool. Regardless, we can also consider the squeeze indicator as a momentum indicator, as many traders use it to identify the direction and strength of price moves. In fact, the Tradingview  squeeze indicator shows when a financial instrument is willing to change from a trending ma
FREE
The SuperTrend AI indicator is a novel take on bridging the gap between the K-means clustering machine learning method & technical indicators. In this case, we apply K-Means clustering to the famous SuperTrend indicator.   USAGE Users can interpret the SuperTrend AI trailing stop similarly to the regular SuperTrend indicator. Using higher minimum/maximum factors will return longer-term signals. (image 1) The displayed performance metrics displayed on each signal allow for a deeper interpretat
The concept of Harmonic Patterns was established by H.M. Gartley in 1932. Gartley wrote about a 5-point (XABCD) pattern (known as Gartley) in his book Profits in the Stock Market. This indicator scan and alert when 4th point (C) is complete and predict where D should be.  In traditional, Gartley pattern include BAT pattern, Gartley pattern, butterfly pattern, crab pattern, deep crab pattern, shark pattern. Each pattern has its own set of fibonacci. In this indicator, we add more extended patter
This is a Forex Scalping Trading Sytem based on the Bollinger Bands.  Pairs:Major Time frame: 1M or higher. Spread max:0,0001.  Indicators (just suggestion) Bollinger bands (20, 2); ADX (14 period); RSI   (7 period ). Y ou should only trade this system between 2am to 5am EST, 8am to 12am EST and 7.30pm to 10pm EST. Do not scalp 30 minutes before a orange or red news  report and not for a hour afterwards.   Setup: is for price to move above the lower or lower Bollinger Bands, RSI raise above the
FREE
Sessions by LUX in MT5
Minh Truong Pham
5 (1)
This indicator shows when user set sessions are active and returns various tools + metrics using the closing price within active sessions as an input. Users have the option to change up to 4 session times. The indicator will increasingly lack accuracy when the chart timeframe is higher than 1 hour. Settings Sessions Enable Session: Allows to enable or disable all associated elements with a specific user set session. Session Time: Opening and closing times of the user set session in the  
The indicator show Higher timeframe candles for ICT technical analisys Higher time frames reduce the 'noise' inherent in lower time frames, providing a clearer, more accurate picture of the market's movements. By examining higher time frames, you can better identify trends, reversals, and key areas of support and resistance. The Higher Time Frame Candles indicator overlays higher time frame data directly onto your current chart. You can easily specify the higher time frame candles you'd li
All about Smart Money Concepts Strategy: Market struture: internal or swing BOS, CHoCH; Orderblock; Liquity equal; Fair Value Gap with Consequent encroachment, Balanced price range; Level with Previous month, week, day level or in day level (PMH, PWH, PDH, HOD); BuySell Stops Liquidity (BSL, SSL); Liquidity Void Long Wicks; Premium and Discount; Candle pattern ... "Smart Money Concepts" ( SMC ) is a fairly new yet widely used term amongst price action traders looking to more accurately navigate
The indicator   returning pivot point based trendlines with highlighted breakouts . Trendline caculated by pivot point and other clue are ATR, Stdev.   The indicator also includes integrated alerts for  trendlines  breakouts   and foward message to Telegram channel or group if you want. Settings ·            Lookback bar: Default 200 is number of bar caculate when init indicator. ·            Length:  Pivot points  period ·            Slope Calculation Method: Determines how this lope is calcula
This all-in-one indicator displays real-time market structure (internal & swing BOS / CHoCH), order blocks, premium & discount zones, equal highs & lows, and much more...allowing traders to automatically mark up their charts with widely used price action methodologies. Following the release of our Fair Value Gap script, we received numerous requests from our community to release more features in the same category. //------------------------------------// Version 1.x has missing functions + PDAr
The Breaker Blocks with Signals indicator aims to highlight a complete methodology based on breaker blocks. Breakout signals between the price and breaker blocks are highlighted and premium/discount swing levels are included to provide potential take profit/stop loss levels. This script also includes alerts for each signal highlighted.   SETTINGS   Breaker Blocks Length: Sensitivity of the detected swings used to construct breaker blocks. Higher values will return longer term break
The ICT Concepts indicator regroups core concepts highlighted by trader and educator "The Inner Circle Trader" (ICT) into an all-in-one toolkit. Features include Market Structure (MSS & BOS), Order Blocks, Imbalances, Buyside/Sellside Liquidity, Displacements, ICT Killzones, and New Week/Day Opening Gaps. It’s one kind of Smart money concepts.   USAGE:   Please read this   document  !      DETAILS Market Structure Market structure labels are constructed from price breaking a prior extreme
The FollowLine indicator is a trend following indicator. The blue/red lines are activated when the price closes above the upper Bollinger band or below the lower one. Once the trigger of the trend direction is made, the FollowLine will be placed at High or Low (depending of the trend). An ATR filter can be selected to place the line at a more distance level than the normal mode settled at candles Highs/Lows. Some features: + Trend detech + Reversal signal + Alert teminar / mobile app
The ICT Silver Bullet indicator is inspired from the lectures of "The Inner Circle Trader" (ICT) and highlights the Silver Bullet (SB) window which is a specific 1-hour interval where a Fair Value Gap (FVG) pattern can be formed. A detail document about ICT Silver Bullet here . There are 3 different Silver Bullet windows (New York local time): The London Open Silver Bullet (3 AM — 4 AM ~ 03:00 — 04:00) The AM Session Silver Bullet (10 AM — 11 AM ~ 10:00 — 11:00) The PM Session Silver Bullet (2
Sessions by Lux
Minh Truong Pham
This indicator shows when user set sessions are active and returns various tools + metrics using the closing price within active sessions as an input. Users have the option to change up to 4 session times. The indicator will increasingly lack accuracy when the chart timeframe is higher than 1 hour. Settings Sessions Enable Session: Allows to enable or disable all associated elements with a specific user set session. Session Time: Opening and closing times of the user set session in the  
The liquidity swings indicator highlights swing areas with existent trading activity. The number of times price revisited a swing area is highlighted by a zone delimiting the swing areas. Additionally, the accumulated volume within swing areas is highlighted by labels on the chart. An option to filter out swing areas with volume/counts not reaching a user-set threshold is also included. This indicator by its very nature is not real-time and is meant for descriptive analysis alongside other com
OVERVIEW A Lorentzian Distance Classifier (LDC) is a Machine Learning classification algorithm capable of categorizing historical data from a multi-dimensional feature space. This indicator demonstrates how Lorentzian Classification can also be used to predict the direction of future price movements when used as the distance metric for a novel implementation of an Approximate Nearest Neighbors (ANN) algorithm. This indicator provide signal as buffer, so very easy for create EA from this indi
This script automatically calculates and updates ICT's daily IPDA look back time intervals and their respective discount / equilibrium / premium, so you don't have to :) IPDA stands for Interbank Price Delivery Algorithm. Said algorithm appears to be referencing the past 20, 40, and 60 days intervals as points of reference to define ranges and related PD arrays. Intraday traders can find most value in the 20 Day Look Back box, by observing imbalances and points of interest. Longer term traders c
An Implied Fair Value Gap (IFVG) is a three candles imbalance formation conceptualized by ICT that is based on detecting a larger candle body & then measuring the average between the two adjacent candle shadows. This indicator automatically detects this imbalance formation on your charts and can be extended by a user set number of bars. The IFVG average can also be extended until a new respective IFVG is detected, serving as a support/resistance line. Alerts for the detection of bullish/be
Consolidation is when price is moving inside a clear trading range. When prices are consolidated it shows the market maker placing orders on both sides of the market. This is mainly due to manipulate the un informed money. This indicator automatically identifies consolidation zones and plots them on the chart. The method of determining consolidation zones is based on pivot points and ATR, ensuring precise identification. The indicator also sends alert notifications to users when a new consolida
This indicator presents an alternative approach to identify Market Structure. The logic used is derived from learning material created by   DaveTeaches (on X) Upgrade v1.10: add option to put protected high/low value to buffer (figure 11, 12) When quantifying Market Structure, it is common to use fractal highs and lows to identify "significant" swing pivots. When price closes through these pivots, we may identify a Market Structure Shift (MSS) for reversals or a Break of Structure (BOS) for co
Created by imjesstwoone and mickey1984, this trade model attempts to capture the expansion from the 10:00-14:00 EST 4h candle using just 3 simple steps. All of the information presented in this description has been outlined by its creators, all I did was translate it to MQL4. All core settings of the trade model may be edited so that users can test several variations, however this description will cover its default, intended behavior using NQ 5m as an example. Step 1 is to identify our Price Ra
The Buyside & Sellside Liquidity indicator aims to detect & highlight the first and arguably most important concept within the ICT trading methodology,   Liquidity   levels. SETTINGS Liquidity Levels Detection Length: Lookback period Margin: Sets margin/sensitivity for a liquidity level detection Liquidity Zones Buyside Liquidity Zones: Enables display of the buyside liquidity zones. Margin: Sets margin/sensitivity for the liquidity zone boundaries. Color: Color option for buysid
The   Liquidation Estimates (Real-Time)   experimental indicator attempts to highlight real-time long and short liquidations on all timeframes. Here with liquidations, we refer to the process of forcibly closing a trader's position in the market. By analyzing liquidation data, traders can gauge market sentiment, identify potential support and resistance levels, identify potential trend reversals, and make informed decisions about entry and exit points. USAGE (Img 1)    Liquidation refers
The   ICT Unicorn Model   indicator highlights the presence of "unicorn" patterns on the user's chart which is derived from the lectures of   "The Inner Circle Trader" (ICT) . Detected patterns are followed by targets with a distance controlled by the user.   USAGE (image 2) At its core, the ICT Unicorn Model relies on two popular concepts, Fair Value Gaps and Breaker Blocks. This combination highlights a future area of support/resistance. A   Bullish Unicorn Pattern   consists out of:
The Inversion Fair Value Gaps (IFVG) indicator is based on the inversion FVG concept by ICT and provides support and resistance zones based on mitigated Fair Value Gaps (FVGs). Image 1   USAGE Once mitigation of an FVG occurs, we detect the zone as an "Inverted FVG". This would now be looked upon for potential support or resistance. Mitigation occurs when the price closes above or below the FVG area in the opposite direction of its bias. (Image 2) Inverted Bullish FVGs Turn into Potenti
Filtro:
Nessuna recensione
Rispondi alla recensione