 MetaTrader 5
 Experts
 Indicatori
 librerie
 Utilità
 Widget
 Regole
Guarda i video tutorial del Market su YouTube
Come acquistare un Robot di Trading o un indicatore
Esegui il tuo EA
hosting virtuale
hosting virtuale
Prova un indicatore/robot di trading prima di acquistarlo
Vuoi guadagnare nel Market?
Come presentare un prodotto per venderlo con successo
Indicatori tecnici gratuiti per MetaTrader 5 - 57
 I segnali degli indicatori tecnici giocano un ruolo cruciale nell'apertura e nella chiusura delle transazioni sui mercati azionari e Forex. L'essenza degli indicatori è una trasformazione matematica del prezzo di un simbolo finanziario, finalizzata alla previsione dei cambiamenti futuri dei prezzi. Prova gli indicatori tecnici, per prevedere al meglio il comportamento del mercato e ricavarne dei guadagni.

QDragon Lot Calculator & Risk Manager è un'utilità interattiva premium progettata per MetaTrader 5 per semplificare la gestione del rischio e i calcoli delle dimensioni del lotto. Non dovrai più calcolare manualmente o indovinare la dimensione del lotto prima di entrare a mercato. Trascina semplicemente le linee sul grafico e lascia che l'indicatore faccia i calcoli!
Caratteristiche principali: - Linee del grafico interattive: Trascina e rilascia le linee di Ingresso (Grigio), Stop Loss (Rosso
FREE
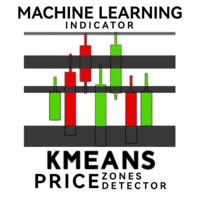
Benvenuto nel futuro del trading con KMeans Price Zones Detector, un innovativo indicatore per MetaTrader che sfrutta la potenza del machine learning per identificare le zone di prezzo chiave. Questo strumento utilizza l'algoritmo di clustering KMeans per rilevare dinamicamente i centroidi nei dati dei prezzi, evidenziando le aree in cui i prezzi hanno maggiori probabilità di incontrare supporto, resistenza o consolidamento. Algoritmo KMeans innovativo KMeans Price Zones Detector si distingue pe
FREE

This project did not reach the basic funding number, so I am abandoning it momentarily. The system is now free for other traders to continue the idea. You can follow my new project through my signals.
A tool for institutional investor, now avaliable for Home users. We equip you like banks equip their analysts!
How it works
Focused on the Forex market, it takes advantage of the need of nations to control the value of their currency and the world exchange variations to analyze, through the pro
FREE

The Horse Signal 1.26 – Price Action AI Indicator for Gold & Forex Overview: Start your 2026 trading year with "The Horse Signal," the latest precision tool from the WinWiFi Robot Series. Designed specifically for traders who demand high-accuracy entries, this indicator utilizes advanced Price Action analysis combined with an AI scanning algorithm to identify high-probability reversal and trend continuation points in real-time. Key Features: Dynamic Price Action Scan: Automatically analyzes can
FREE

Colors generated according to the Height and Depth parameter.
The analysis is carried out following the direction of the price and volume traded if the traded value exceeds the calculation base the system changes the color to green, informing you that the price direction is strong to buy, if the traded value is less than the calculation base the system changes to red, indicating that the price is strong for sale.
FREE
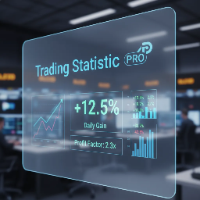
The statistical indicator for the metatrader 5 TradingStatisticPro collects statistical data on your trade, which makes it easier to assess the effectiveness of trading, the profit received and the risks. The indicator is compactly placed in the corner of the main chart of the terminal and displays the following information: 1. The profit earned. 2. Maximum drawdown. 3. The recovery factor. 4. Profit factor. 5. The ratio of profitable and unprofitable transactions (winrate). 6. Average profit a
FREE
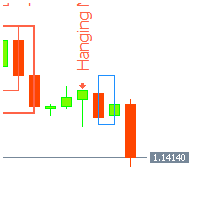
Japanese candlestick analysis has been in existence for hundreds of years and is a valid form of technical analysis. Candlestick charting has its roots in the militaristic culture that was prevalent in Japan in the 1700s. One sees many terms throughout the Japanese literature on this topic that reference military analogies, such as the Three White Soldiers pattern Unlike more conventional charting methods, candlestick charting gives a deeper look into the mind-set of investors, helping to establ
FREE

======================================================== BUY/SELL VOLUME MOMENTUM DASHBOARD - MQL5/MT5 MARKET DESCRIPTION (formatting: **bold** = Bold button; lines with • = bullet list; UPPERCASE = heading) ========================================================
OVERVIEW ------------------------------------------------------- **Buy/Sell Volume Momentum Dashboard** reads buying vs selling volume momentum and presents it as a clear on-chart dashboard, so you can see which side is driving the m
FREE

Questo è un prodotto gratuito; sentiti libero di utilizzarlo come preferisci!
Se l'indicatore ti piace, lascia una breve recensione positiva! Grazie mille!
Click here to see high quality Trading Robots and Indicators!
L'indicatore Forex "SWAP Display" per MT5 è un eccellente strumento di supporto al trading. Visualizza gli swap correnti per le posizioni long e short sulla coppia forex attiva. Puoi posizionare facilmente i valori SWAP in qualsiasi angolo del tuo grafico. È completamente perso
FREE
Hi Traders, EMA is very popular indicator to determine: trend // support // resistance. Here are the use of this simple yet very powerful Multi-Time Frame indicator: 1- Attach this indicator to your chart . - Choose the desired time frame ( ex: Current, M15, H1, H4, D1,...). - Set your desired EMA periods ( ex: 20, 50, 100, 150, 200,...). - Enable which EMA you want to show by setting the relevant EMA to: True / False (you can show 1, 2, 3, 4 or all of 5 EMAs at the same time). - Set col
FREE

DS Quarterly Price Levels Quarterly Theory Price Level Indicator for MetaTrader 5 DS Quarterly Price Levels is a MetaTrader 5 indicator designed to display structured price levels based on Quarterly Theory concepts. The indicator divides price ranges into defined segments and displays key reference levels including quarterly boundaries, midpoint areas, premium zones, and discount zones. It is designed to help traders analyse price location within a defined range and provide additional structure
FREE

Dynamics Edge: Statistical Precision in Mean Reversion Dynamics Edge is a volatility boundary indicator designed to identify price exhaustion with high precision. Using an advanced standard deviation calculation ( $2.2 \sigma$ ), it maps the extremities where price is statistically likely to return to equilibrium (median). Key Features: Dynamic Exhaustion Edges: Solid lines that expand and contract based on volatility, identifying overbought (Blue) and oversold (Red) zones. OCR-Ready Price Tags:
FREE

Know which market is open. Know when the next strong news hits. Never trade blind into a news spike again.
LTS Sessions & News is the market-timing indicator from LTS — Legacy Trading System . It draws the Asia, London and New York sessions on your chart, shows three clocks (broker server, GMT and your local time) and reads the next high-impact news straight from the MT5 economic calendar, with countdowns and alerts. No external website, no DLL, no setup.
EVERYTHING ON ONE CHART Asia session
FREE
SHADOW vous donne des signaux d'achat et de vente solides avec un risque minimal. Vous pouvez voir dans quelle direction le prix évolue et la force du mouvement. Shadow filtre le bruit du marché et améliore radicalement les performances des traders.
Points forts: Détection visuelle efficace des tendances. Bruit du marché des filtres Ne repeint ni ne recalcule jamais. Signaux strictement sur "fermeture du bar". Fonctionne dans tous les symboles. Pop-up intégré, e-mail, notification push et
FREE
This is a general purpose indicator that displays colored lines at fixed and customizable price intervals, entered as parameters. It offers universal, constant, and familiar price ranges that allow quick and precise price analysis of a currency pair. With default parameters, this indicator implements The Quarters Theory , as described originally by Ilian Yotov . [ Installation Guide | Update Guide | Troubleshooting | FAQ | All Products | Get Help ] Easy to use No optimization needed Customiz
FREE

Hidden Edge – High-Low PreUS High-Low PreUS is a clean and lightweight indicator that marks key reference levels before the US session begins.
It draws a session box from 00:01 to 09:00 CET, identifying the high and low of the Asian session, and includes additional reference elements to support structured intraday trading decisions. Features Draws a rectangular range from 00:01 to 09:00 CET Marks the high and low of the session clearly Plots a horizontal yellow line as a suggested stop level bas
FREE

This indicator automatically draws horizontal lines at 00s, 20s, 50s and 80s levels. If you trade ICT concepts and are an ICT Student, then you know that these levels are used as institutional support/resistance levels and/or fibonacci retracement anchor points. Features
Draws horizontal lines at 00, 20, 50 and 80 levels above and below current market price . Choose the amount of levels to show on chart Customizable line colors Recommended for forex currency pairs. Saves time looking for thes
FREE
O Indicador valida a força da tendência utilizando o volume negociado. Os candles são mostrados na cor verde indicando força compradora e cor vermelha na força vendedora. O movimento é encerrado pelo SAR parabólico. Vantagens: Filtra distorções de preço sem volume financeiro; Filtra consolidações e movimentos laterais; Filtra divergências de volume pelo indicador Money Flow. Desvantagens: Não filtra todos os falsos rompimentos, visto que rompimentos importantes geram altos volumes financeiros; N
FREE
Scalping Timer – Precisione in Tempo Reale per Scalper Esigenti Scalping Timer è un indicatore visivo compatto progettato specificamente per scalper e day trader che dipendono dal timing perfetto e dal costo minimo di transazione . Questo pannello in tempo reale mostra due metriche essenziali per lo scalping: Conto alla rovescia esatto del tempo rimanente per la chiusura della candela impostata nel grafico. Visualizzazione immediata dello spread attuale del simbolo. Con queste informazioni criti
FREE

AUC - S&R Clusters è un indicatore che identifica zone di supporto e resistenza basate sull’analisi del comportamento del prezzo. L’indicatore utilizza dati storici per rilevare aree in cui il prezzo ha interagito più volte. Sulla base di queste informazioni, raggruppa i livelli vicini in zone. A differenza dei livelli fissi, l’indicatore adatta le zone in base alle condizioni di mercato. Questo consente di osservare aree rilevanti nella struttura del prezzo. Funzionamento L’indicatore analizz
FREE

Trade live dollar movement currency futuristic currency moving in horizontal Stop loss Showing currency value in dollar show enter price line show SL horizontal line
Label Colors Entry Line Color SL Color Override (if not auto) TP Color Override (if not auto) Highlight Background Color Highlight Tod Color = Layout Label Offset (points) Label Font Size Label Font Name Label Style = Lines Show Entry Price Line Show SL Horizontal Line Show TP Horizontal Line Horizontal Line Width (1-5) Hor
FREE
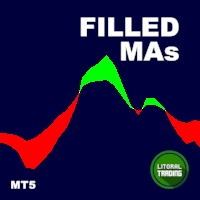
Are you a trend surfer like us? Do you use Moving Averages too? Ever wanted the are between them to be painted? Yeah, we solved this problem with the Filled MAs indicator! It is very simple, just puts two fully customizable Moving Averages on chart and fill the space between them, changing the color as they intersect. Thanks to gmbraz for the version 1.1 idea. Any questions os suggestions please contact me! Enjoy!
This is a free indicator, but it took hours to develop. If you want to pay me a
FREE

TestTrendIndicator — Professional Trend & Momentum Engine The TestTrendIndicator is a multi‑layered trend analysis and signal‑generation tool designed for traders who want clarity, precision and structure in their decision‑making. It combines ADX , RSI , ATR , MA logic , volatility assessment and dynamic market context into one unified visual system. This indicator is built for traders who value clean signals , multi‑timeframe confirmation , and adaptive logic that responds to real market cond
FREE
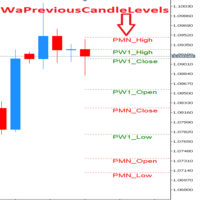
!!!This Free Version just works on EURUSD!!! Wa Previous Candle Levels MT5 shows the previous candle levels, it shows the previous candle Open High Low Close levels (OHLC Levels) in different time frame. It's designed to help the trader to analyse the market and pay attention to the previous candle levels in different time frame. We all know that the OHLC Levels in Monthly, Weekly and Daily are really strong and must of the time, the price strongly reacts at those levels. In the technical anal
FREE
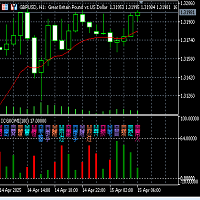
Fuxi Guaxiang Dual-color Oscillation Indicator Function and Usage Instructions (V2.1)
Fuxi Guaxiang Dual-color Oscillation Indicator Instructions: (1) This Guaxiang change indicator is based on the Yin-Yang transformation thought of the "Book of Changes" philosophy in ancient Chinese culture, integrating the results of the long-short game in each candlestick K-line period of the financial trading K-line chart, using China's oldest predictive coding method, in the form of the 64 Guaxiang of the
FREE

The TrendChannelTracker Indicator is an innovative Forex trading tool. This indicator, which is based on the standard Stochastic Oscillator, provides traders with a unique and simplified method for observing market trends. In contrast to the traditional Stochastic Oscillator, which is shown at the bottom of the chart, the TrendChannelTracker Indicator is built into the price action itself. This removes the need for traders to continually switch their attention between the oscillator and the pri
FREE

This indicator, the Phoenix Moving Average Panel, is a professional-grade visual dashboard designed to remove guesswork from trend-following strategies. It transforms a standard Moving Average into a functional trading workstation. Here is how it assists a trader in making precise decisions: 1. Identifying the Buy/Sell Zone (The Trend Matrix) Instead of looking at just one line, the panel provides a Three-Tier Trend Confirmation: Current Trend: Shows the immediate momentum on your active chart.
FREE

PHSB Market Vision Un nuovo modo di guardare il mercato. Il mercato parla continuamente. La questione è saper interpretare ciò che il prezzo sta mostrando. PHSB Market Vision è stato sviluppato per offrire una visione più ampia e organizzata del comportamento del mercato, riunendo in un unico strumento diversi riferimenti di prezzo, trend, volatilità e volume . Invece di monitorare diversi indicatori separatamente, Market Vision integra queste informazioni in un'unica struttura visiva, permetten
FREE

Most accounts are not lost on one bad trade. They are lost when nobody is watching the risk. LTS Risk Panel watches it for you, all day.
LTS Risk Panel is the account-protection dashboard from LTS — Legacy Trading System . In one panel it shows your drawdown limits with color progress bars, the right LTS lot size for your balance, your open exposure, basket break-even lines and your closed results. The default limits are the same used in LTS Expert Advisors: 15% daily loss and a 50% hard stop o
FREE

Transform your MetaTrader 5 chart into a professional trading cockpit. Apex Dashboard is a high-performance utility designed for serious traders who need complete situational awareness. It moves beyond simple monitoring by providing a comprehensive overview of your account's solvency, performance, and risk exposure in real-time. Unlike standard indicators, Apex Dashboard features a Persistent Data Engine . It records your historical Peak Drawdown to a local file, ensuring your risk metrics r
FREE
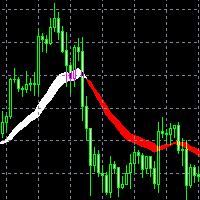
Индикатор Trade in trend предназначен для торговли по тренду. Сила тренда определяется шириной линии. Узкая линия - начало или конец тренда. Широкая линия свидетельствует о высокой силе тренда. Резкая смена ширины линии свидетельствует, с большой вероятностью, об окончании тенденции. Сигналы индикатора Не против покупки: переход с красной линии в белую цена отразилась от белой линии индикатора цена находится выше белой линии индикатора Не против продажи: переход с белой линии в красную цена отр
FREE

This indicator is based on the Fractals indicator. It helps the user identifying whether to buy or sell. It comes with an alert that will sound whenever a new signal appears. It also features an email facility. Your email address and SMTP Server settings should be specified in the settings window of the "Mailbox" tab in your MetaTrader 5. Blue arrow up = Buy. Red arrow down = Sell. Line = Trailing Stop. You can use one of my Trailing Stop products that automatically move the Stop Loss and includ
FREE

The Keltner Channel Pro is a modern and enhanced version of the classic Keltner Channel , designed for traders who want to identify trends, reversals, and overbought/oversold zones with greater accuracy. Built with EMA (Exponential Moving Average) and ATR (Average True Range) , this indicator automatically adapts to market volatility, providing dynamic channels that help filter noise and improve trade timing. Key Features: Main channel (upper, middle, and lower) based on EMA + ATR. Optional ad
FREE

MACandleApprox — Moving-Average Approximate Candle Indicator MACandleApprox is a custom indicator that, on the main price chart, applies a selected type of moving average to the open, high, low, and close price series respectively, and replots them as "approximate candles". It does not modify the original candlesticks; instead, it overlays a smoothed candle view based on moving averages, helping traders observe the smoothed price movement and directional changes more intuitively. The indicator s
FREE
This indicator is a trading strategy designed to find high-probability entry points by combining two very popular indicators: Bollinger Bands (BB) and the Relative Strength Index (RSI) . The core idea is "dual confirmation" : a trade signal is only considered valid when both indicators agree. This helps filter out many of the false signals that occur when using just a single indicator, thereby increasing the reliability of each entry. Bollinger Bands are used to identify relative price value zon
FREE

PipVenom - Advanced ATR Trailing Stop Signal Indicator for MT5 Professional Visual Trading System with Real-Time Dashboard OVERVIEW PipVenom is a sophisticated visual trading indicator designed for MT5 that combines ATR Trailing Stop methodology with EMA crossover signals to identify high-probability trade entries. Built with precision and clarity in mind, this indicator provides crystal-clear visual signals with automatic Stop Loss and Take Profit levels displayed directly on your chart. P
FREE

Magic Number Manager (OrderByMagic) Magic Number Manager (OrderByMagic) is a display-only MetaTrader 5 indicator that reads all open positions and groups them by magic number directly on the chart, refreshed every couple of seconds. It never opens, closes or modifies any trade. Features Live grouping by magic number: instantly see which positions belong to which EA. Per-group overview: total lots and profit/loss for each magic number. Collision detection: spot when two EAs share a magic number,
FREE
516/5000 Average volume indicator to calculate the average volume for a given period. Useful as a filter to measure the strength of a trend, or false breaks in support or resistance.
It does not give a signal to buy or sell, it only acts as a filter to avoid entering into transactions with a drop in volume, or below-average volume, which may indicate disinterest in trading at the price level.
It has only the parameters of period, method of calculating the average and type of volume.
It h
FREE
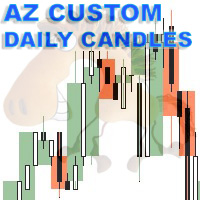
AZ_custom_daily_candle The indicator allows you to draw the contours of daily candles on small timeframes, plus you can customize the display of, for example, an H1 candle and see how it looks on the M5 chart (I think this is a useful setting for scalping). Further, it is possible to shift the beginning/end of drawing candles, change the background color, line thickness. Suggestions and wishes are welcome. v 1.05 (31/03/2025)
By demand, I have added the ability to turn on/off daily maximum/mini
FREE

Attention ! !! Buffer indicator, PERFECT FOR USE IN THE EXPERT ADVISOR! The DynamicFibo indicator automatically indicates horizontal Fibonacci levels on the chart online. The levels are recalculated automatically online. The levels can be calculated from the current chart as well as from any other time frame. It is convenient to use levels from an older time frame, and trade on a shorter time frame. Any levels are set manually in the indicator settings. IT is IMPORTANT to separate the levels i
FREE
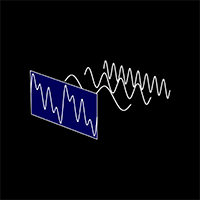
The "Cycle Extraction" indicator for MetaTrader 5 uses the Fast Fourier Transform (FFT) to discern cycles in financial time series. It facilitates the configuration of parameters such as the maximum number of bars, moving average settings, and specification of frequency thresholds, optimizing the analysis of repetitive market phenomena. Instructions Input Settings : Adjust variables such as Bar Count, Period, Method, and Applied to Price to customize the analysis to the user's needs. Data Visual
FREE
This indicator demonstrates the probable dynamic support and resistance levels of EMA, Ichimoku lines, and Key OHLC levels for different timeframes on one chart. This can drastically reduce the time and effort needed for switching between different timeframes.
EMA and Ichimoku Levels are drawn for the M1, M5, M15, M30, H1, H4, and D1 timeframes, and the Key OHLC levels of the last periods are drawn for the H4, D1, W1, and MN1 timeframes.
FREE

Proton Market Range MT5
OVERVIEW Proton Market Range MT5 is an indicator for MetaTrader 5 that displays real-time spread information and daily price range data. The indicator shows current bid-ask spread and tracks how much price has moved from daily open to current price. This tool is designed for traders who need to monitor spread conditions and market volatility.
PRIMARY FUNCTION The indicator displays current market spread and daily range metrics in a dashboard format on the chart. It upd
FREE
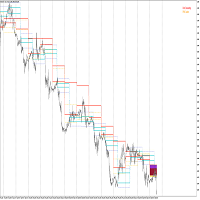
This indicator is based on Mr. Mark Fisher's ACD strategy, based on the book "The Logical Trader."
- OR lines - A lines - C lines - Daily pivot range - N days pivot range - Customizable trading session - Drawing OR with the desired time Drawing levels A and C based on daily ATR or constant number - Possibility to display daily and last day pivots in color zone - Displaying the status of daily PMAs (layer 4) in the corner of the chart - Show the order of daily pivot placement with multi-day piv
FREE

Super Strike — The Ultimate Trend Precision System
Super Strike is an advanced trend-following system that combines the proven accuracy of the SuperTrend algorithm with the filtering power of a dynamic Moving Average . Built for traders who demand precision and confidence, this indicator transforms raw price action into a clean, intuitive, and highly informative visual system — a complete framework for making smarter trading decisions.
At the heart of Super Strike lies a dynamic calculation o
FREE

STRUCTUREMAP NAVIGATOR MT5 Multi-Timeframe Market Structure Dashboard
TAGLINE
Read the market like a structure trader.
PRODUCT OVERVIEW
StructureMap Navigator MT5 is a multi-timeframe market-structure indicator for MetaTrader 5. It is designed to help traders understand how price is behaving through swing points and structure events rather than relying only on traditional buy/sell arrows.
The indicator analyzes recent swing highs and swing lows, classifies them as HH, HL, LH, or LL, and th
FREE

Candle Disrespect is an MT5 chart indicator that highlights candles breaking or wicking through prior candle structure. It scans a configurable lookback range and color-codes three disrespect levels: body close past the prior wick, body close past the prior body, and wick-only rejection. Toggle flip-only mode, category visibility, and colors to suit your trading style.
FREE

TraderStart Risk & Position Size — Quick Start
1. Attach the indicator to a chart. 2. Click BUY or SELL to match the trade direction you want to plan. 3. Choose the sizing mode: - RISK % to calculate the lot size from your chosen risk percentage. - LOT SIZE to test a fixed lot size. 4. Click SET BALANCE or USE ACCOUNT. 5. Set your Risk % or Lot Size using the built-in keypad dialogs. 6. Drag the Entry, Stop Loss and Take Profit lines to the desired chart levels. 7. Read the planning outp
FREE
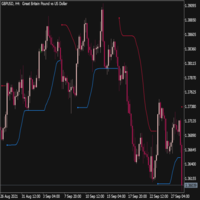
Trend Envelopes indicator is calculated based on a % of price change. That % is then used to determine if there is a new trend or trend remains the same.
This version is using Standard Deviation for the price change calculation instead and is adding prices smoothing prior to be used in calculations. The smoothing can be done using one of the 4 average types:
* Simple Moving Average
* Exponential Moving Average
* Smoothed Moving Average
* Linear Weighted Moving Average
Also, this
FREE

Currency Strength & Pair Selection Dashboard is a MetaTrader 5 indicator for manual FX analysis. It ranks eight major currencies — USD, EUR, GBP, JPY, CHF, CAD, AUD, and NZD — using closed-bar relative returns from available broker currency pairs. Multi-timeframe analysis (configurable 1–4 timeframes) shows trend, momentum, and MTF agreement for each currency. The pair-selection table ranks candidate pairs by currency-strength difference and labels alignment as Strong, Moderate, Neutral, or Mixe
FREE
This indicator draws the highest and the lowest prices of the previous periods on the chart. And If you want, Indicator can alert you when the current price arrives these levels. For example: If you are watching the H1 timeframe, Indicator shows you the lowest and the highest prices of H4, D1, W1 and M1 periods. So you don't need to open the other periods of chart windows. Alert Options: Send Mobil Message, Send E-mail, Show Message, Sound Alert Time Periods: M1, M5, M15, M30, H1, H2, H3, H
FREE

Este poderoso indicador analisa o gráfico e mostra zonas de Rejeição de Preços! Isto é, locais onde o preço foi, mas não foi aceito pelo mercado! A visualização desta zona de Rejeição, facilita o entendimento do trader na tomada de decisões de onde operar e como operar!
O indicador é composto por 4 linhas, sendo classificadas em 2 grupos: Linhas Vermelha e Amarela: Denotam os extremos onde o preço conseguiu chegar, mas não foi aceito! Linhas Laranja e Azul: A partir delas, denotam o Início da z
FREE

Server Timer
Version: 1.2 The Server Time Clock Indicator is a lightweight and visually appealing tool for displaying the server's current date and time directly on the chart. This indicator updates dynamically every second and provides the following features: Customizable Appearance : Adjust font color, background color, and font size to match your chart's theme. Day and Time Display : Shows the current day, date, and time in an easy-to-read format ( Day{MM/DD} HH:MM:SS ). No Performance Over
FREE

AR Enterprises – Market Structure Sniper v1.03 Professional Smart Money Concept (SMC) Indicator
Market Structure Sniper v1.5 is a precision trading indicator designed to identify clean structure shifts, trend direction, and high-probability entry zones using Smart Money Concepts.
Built for traders who want clarity, not noise.
️ HOW IT WORKS
This indicator analyzes price using market structure logic:
1. Structure Detection Identifies HH (Higher High) HL (Higher Low) LH (Lower High
FREE

RaysFX Elastic Order Flow Matrix (EOFM) L'indicatore definitivo per gli Scalper e i Day Trader che operano su timeframe rapidi (M1). Il RaysFX Elastic Order Flow Matrix non è un semplice oscillatore. È un motore analitico avanzato progettato per decodificare la vera pressione compratrice o venditrice del mercato, filtrando il "rumore" tipico dei grafici a 1 minuto. Se sei stanco di farti fermare dai falsi segnali generati dalle candele di basso volume o dalla congestione, questo strumento ti
FREE
Volatility Distance Indicator The Volatility Distance Indicator measures in real time the distance between current price and the moving averages you choose, expressed in points . Its purpose is to provide a clear, objective, and quantitative view of the market’s expansion relative to its equilibrium zones , allowing you to instantly assess whether price is in a phase of overextension, compression, or neutrality . Key Features: Point-based measurement: displays the exact distance between current
FREE

The "Matrix Series" indicator is a technical analysis tool designed to identify potential support and resistance zones by visualizing overbought/oversold conditions and trend direction using a combination of price data and customizable parameters, incorporating Commodity Channel Index (CCI) to highlight potential reversal points within the market.
Key features of the Matrix Series indicator: Dynamic Zones: Calculates support and resistance levels based on CCI values, allowing users to adjust th
FREE

Multi-timeframe trend indicator, based on the ADX / ADXWilder indicator The indicator shows trend areas using ADX or ADXWilder indicator data from multiple timeframes. The impulse mode of the indicator allows you to catch the beginning of a trend, and several "Screens" with different timeframes allow you to filter out market noise.
How the indicator works: if PDI is greater than NDI, then it`s bullish movement; if PDI is less than NDI, then it`s bearish movement; to determine any trend, it is
FREE

Candle Detector By Mahefa R. General Description Candle Detector is an advanced technical indicator for MetaTrader 5 , designed to automatically detect and highlight the most important Japanese candlestick patterns directly on the price chart .
It allows traders to quickly identify market reversal and continuation setups without visual clutter. The indicator recolors only the candles that match the selected pattern , ensuring a clear, accurate, and professional chart analysis . ️ How It Work
FREE

NOVA GOLD FUSION RSI + EMA 20 / EMA 100 Gold Signal Indicator for XAUUSD
Nova Gold Fusion is a professional Gold trading indicator designed for XAUUSD traders who want cleaner signals supported by both trend direction and momentum confirmation.
The indicator combines a Gold-focused price calculation engine with EMA 20 / EMA 100 trend filtering, RSI confirmation, ATR-based Entry / Stop Loss / Take Profit zones, candle confirmation, sess
FREE

Ecco la traduzione in italiano:
Presentiamo il Volatility Doctor RSI, un innovativo strumento basato sull'affidabile indicatore RSI, progettato per elevare la tua esperienza di trading come mai prima d'ora.
Il nostro indicatore non solo fornisce letture in tempo reale dell'RSI, ma offre anche una previsione precisa di dove si troverà la lettura dell'RSI tra 10 passaggi nel futuro, su qualsiasi intervallo di tempo scelto e su qualsiasi simbolo di trading preferito.
Intelligenza Adattativa: Que
FREE

Trading Companion MT5 è un compagno visivo gratuito per MetaTrader 5.
Aggiunge direttamente al grafico un personaggio originale chiamato Lumo. Lumo reagisce con piccole animazioni visive a diversi eventi osservabili del mercato e del trading in MT5, senza intervenire nelle operazioni.
Reazioni disponibili:
• mercato tranquillo; • movimento rialzista; • movimento ribassista; • alta volatilità; • apertura di una posizione; • chiusura di una posizione in profitto; • chiusura di una posizione in
FREE

Price Action Auxiliary Indicator Suite 4-4 ATR/ATR% Numerical Indicators
This is a set of price action auxiliary indicators that I use regularly in my trading, covering the basic needs of price action trading. It can be loaded and used on any instrument.
A boon for manual price action trading, providing multiple auxiliary functions. Non-price action traders should purchase with caution, as this set of indicators does not provide any buy or sell signals; it is purely auxiliary.
This indicator
FREE

Spread Cost Analyzer - Professional Trading Cost Intelligence
=== OVERVIEW === Spread Cost Analyzer is a powerful MetaTrader 5 indicator that provides real-time analysis of your trading costs relative to market volatility. Using ATR-based efficiency calculations, it helps you identify the optimal moments to enter and exit trades by quantifying exactly how much of your potential profit is being consumed by spread costs.
=== KEY FEATURES === - Real-time spread cost efficiency analysis - ATR-bas
FREE

An extended version of the indicator for visualizing the time ranges of key trading sessions: Asian, European and American. The main advantage of this indicator is the automatic construction of a price profile for a trading session. The indicator has the functionality to set the start and end time of each trading session, as well as automatically determine the time zone of the trading server. The indicators include the ability to work with minimal CPU usage and save RAM. In addition, the option
FREE
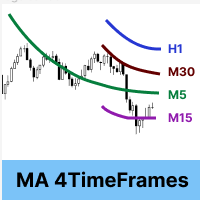
Moving Average 4 TimeFrames
Display 4 moving averages of 4 different timeframes on the same chart. In order not to pollute the chart, the indicator will plot the complete average only in the current timeframe of one of the 4 registered averages, for the other timeframes of registered averages the indicator only displays a part of the average so that you know where it is at that time graphic.
Example:
Display on the 5-minute chart where the 200-period arithmetic moving average of the 5 minute
FREE

The seven currencies mentioned are: GBP (British Pound): This is the currency of the United Kingdom. AUD (Australian Dollar): This is the currency of Australia. NZD (New Zealand Dollar): This is the currency of New Zealand. USD (United States Dollar): This is the currency of the United States. CAD (Canadian Dollar): This is the currency of Canada. CHF (Swiss Franc): This is the currency of Switzerland. JPY (Japanese Yen): This is the currency of Japan. Currency strength indexes provide a way to
FREE
Simple Strategy Indicator The Simple Strategy indicator is a reliable tool for identifying trend direction, leveraging three popular technical indicators: MACD, RSI, and Stochastic. It provides clear trading signals for quick market analysis. Trend Detection Logic Buy signal: MACD above signal line, RSI > 50, Stochastic > 50 Sell signal: MACD below signal line, RSI < 50, Stochastic < 50 Advantages Suitable for various assets: forex, stocks, cryptocurrencies, indices Optimal on daily (D1) timefr
FREE
Eight indicator for 3 day/session/week setups. Check out our other products for fxer.net:
https://www.mql5.com/en/market/product/114888
https://www.mql5.com/en/market/product/114890
Indicator daily features: Daily close/high/low Weekly open/high/low/close Tokyo/London/New York sessions Alerts Signals and alerts for First Green days First Red days Inside days Outside days 3x days of breakout up 3x days of breakouts down Do not be stupid and take every signal. Learn 3day setups first.
FREE

The DailyWeeklyMarkers indicator helps traders visualize trading weeks by clearly marking the start of each day and week on the chart. It draws vertical separator lines for each day (including weekends if enabled) and highlights the beginning of new trading weeks with double lines for better clarity. This makes it easier to analyze price action within daily and weekly contexts. Who Is This Indicator For? Swing Traders – Helps identify weekly opening gaps and key levels. Day Traders – Vis
FREE
Il MetaTrader Market è un negozio online unico di robot di trading e indicatori tecnici.
Leggi il promemoria utente di MQL5.community per saperne di più sui servizi unici che offriamo ai trader: copia dei segnali di trading, applicazioni personalizzate sviluppate da freelance, pagamenti automatici tramite il Sistema di Pagamento e il MQL5 Cloud Network.

Ti stai perdendo delle opportunità di trading:
- App di trading gratuite
- Oltre 8.000 segnali per il copy trading
- Notizie economiche per esplorare i mercati finanziari
Registrazione
Accedi
Accetti la politica del sito e le condizioni d’uso
Se non hai un account, registrati