 MetaTrader 5
 Sistemi Esperti
 Indicatori
 Script
 Librerie
 Archiviazione
Guarda come scaricare robot di trading gratuitamente
Ci trovi su Telegram!
Unisciti alla nostra fan page
Unisciti alla nostra fan page
Ti è piaciuto lo script? Provalo nel Terminale MetaTrader 5

Gold Donchian Breakout Channel (non-repainting, with HTF trend filter) - indicatore per MetaTrader 5
Shipra Gupta

Sono Shipra Gupta, trader e sviluppatrice di strategie quantitative con una solida formazione in matematica, economia e sistemi di trading algoritmico. Nel corso degli anni ho lavorato ampiamente nei mercati forex, oro, indici, materie prime e criptovalute, concentrandomi sulla costruzione di
- Visualizzazioni:
- 99
- Valutazioni:
- Pubblicato:
- Aggiornato:
-
 Ti stai perdendo delle opportunità di trading:
- App di trading gratuite
- Oltre 8.000 segnali per il copy trading
- Notizie economiche per esplorare i mercati finanziari
Registrazione AccediAccetti la politica del sito e le condizioni d’uso
Se non hai un account, registrati -
 Hai bisogno di un robot o indicatore basato su questo codice? Ordinalo su Freelance
Vai a Freelance
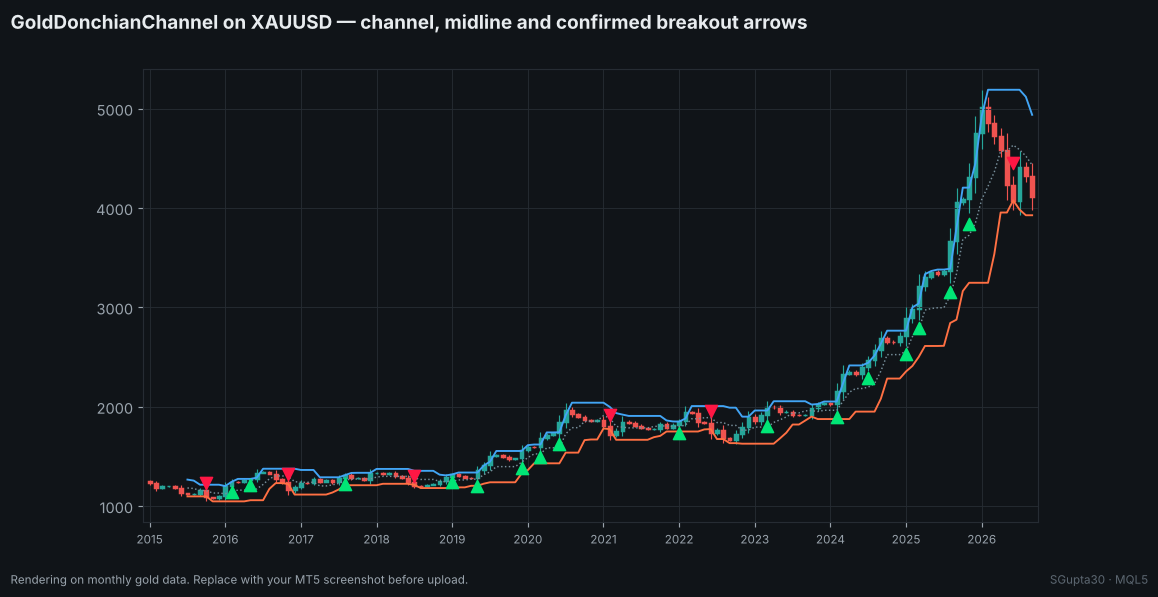
What it does
The indicator draws the highest high and lowest low of the N bars before each bar, plus the midline. When a bar closes beyond the channel for the first time, an arrow is placed on that bar.
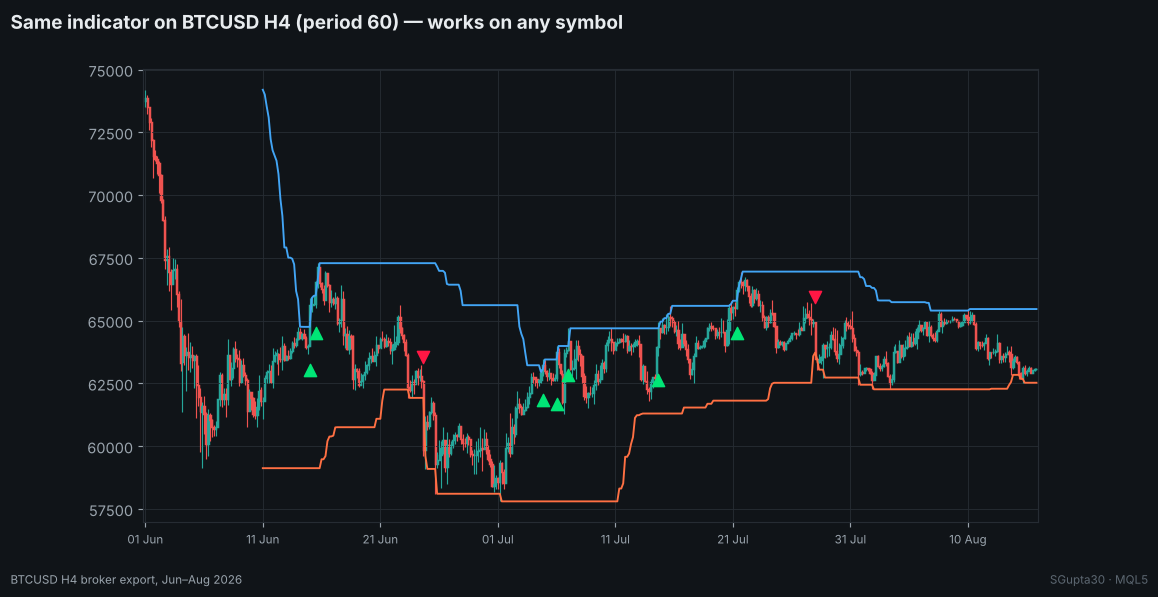
- Blue line: upper channel. Orange line: lower channel. Dotted: midline.
- Green ▲: first close above the upper channel. Red ▼: first close below the lower channel.
With the trend filter on, an up-arrow is shown only while the D1 EMA is rising over the last k completed daily bars, and a down-arrow only while it is falling.
Why it never repaints
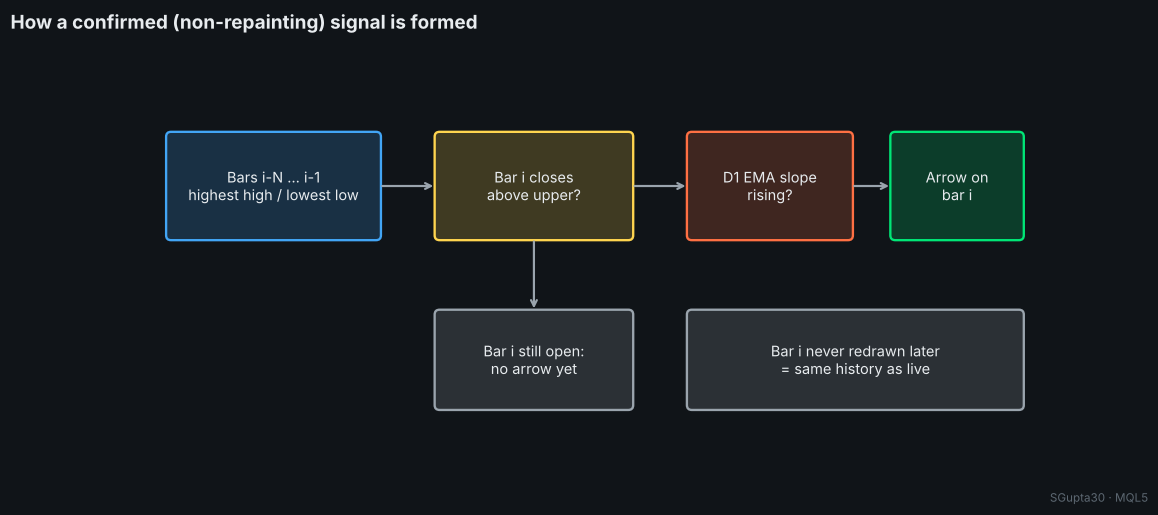
- The channel of bar i uses bars i−N … i−1 only, so the current bar can break it.
- Arrows are written only for closed bars — the forming bar never shows one.
- The higher-timeframe filter reads the last completed daily bar, so there is no look-ahead in the Strategy Tester either.
What you see in history is exactly what you would have seen live.
Works on any market
| Market | Timeframe | Period | Trend filter |
|---|---|---|---|
| XAUUSD swing | H1 | 120 (≈ one week) | D1 EMA 100 |
| XAUUSD position | H4 | 40–80 | D1 EMA 50 |
| BTCUSD | H1 / H4 | 60–160 | D1 EMA 50–100 |
| Indices | H1 | 80–120 | D1 EMA 100 |
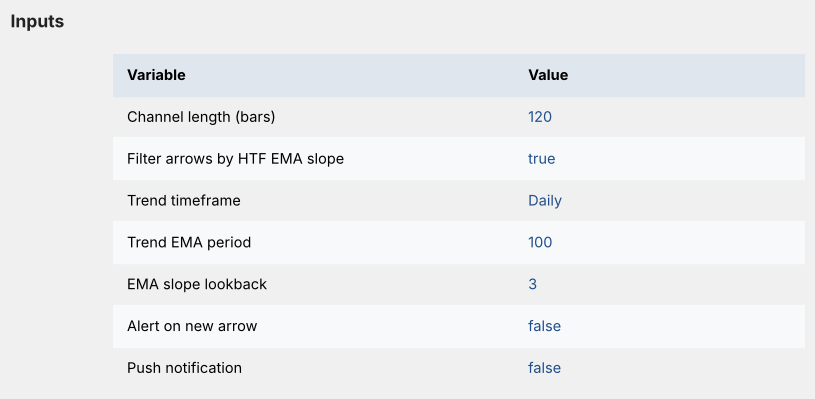
Inputs
| Input | Default | Description |
|---|---|---|
| Channel length | 120 | Bars in the channel |
| Filter by HTF EMA slope | true | Show only trend-direction breakouts |
| Trend timeframe | D1 | Timeframe of the filter |
| Trend EMA period | 100 | EMA length |
| EMA slope look-back | 3 | Completed HTF bars for the slope |
| Alert / Push | false | Notify on a new confirmed arrow |
Using it from an EA
| Buffer | Content |
|---|---|
| 0 / 1 / 2 | Upper / lower / mid channel |
| 3 | Breakout up (price or EMPTY_VALUE) |
| 4 | Breakout down (price or EMPTY_VALUE) |
int h=iCustom(_Symbol,PERIOD_H1,"GoldDonchianChannel",120,true,PERIOD_D1,100,3,false,false);
double up[];
if(CopyBuffer(h,3,1,1,up)==1 && up[0]!=EMPTY_VALUE)
   Print("confirmed breakout on the last closed bar");
Background
The author's research on XAUUSD M1 data from 2010 to 2026 found that H1/H4 Donchian breakouts in the direction of the D1 EMA trend, with wide ATR stops, were profitable across a broad parameter grid in- and out-of-sample. This indicator shows that signal on your chart; the full trading logic is explained in the author's MQL5 article on building a gold trend-breakout EA.
Author: Shipra Gupta (SGupta30) · complete gold and Bitcoin breakout EAs are in the author's Market profile.
 Broker Tick and Rollover Spread Forensic Auditor
Read-only forensic script that audits historical broker Bid/Ask ticks in 15-day RAM-safe chunks: computes session spread percentiles (P50/P95), 23:00-00:15 rollover widening ratios, weekday feed blackout gaps, and exports clean millisecond CSV files.
Relative Volume (RVOL) Indicator in a Subwindow
Relative Volume (RVOL) in a subwindow: the volume of every bar divided by its normal volume, drawn as a color-coded histogram with reference levels and a live text label.
Volatility Squeeze Scanner — Bollinger inside Keltner, with momentum histogram
Shows when volatility is compressed (Bollinger Bands inside the Keltner Channel) and which way it releases. Red dots = squeeze on, green = released, four-colour momentum histogram. Wilder ATR, closed bars, no repaint.
Risk Lot Panel — drag the stop line, read the lot size for your risk percentage
On-chart position-size calculator. Drag the stop line (and optional target line) and the panel shows lots for your risk %, money at risk and reward:risk. Uses OrderCalcProfit, so it is correct for gold, indices, crypto, FX and any account currency.