 MetaTrader 5
 Sistemi Esperti
 Indicatori
 Script
 Librerie
 Archiviazione
Guarda come scaricare robot di trading gratuitamente
Ci trovi su Facebook!
Unisciti alla nostra fan page
Unisciti alla nostra fan page
Ti è piaciuto lo script? Provalo nel Terminale MetaTrader 5

Broker Tick and Rollover Spread Forensic Auditor - script per MetaTrader 5
Denis Remy Khansa

Founder of Azimuth Studio — Compiled CPU Walk-Forward & Multi-EA Portfolio Studio for MetaTrader 5
- Visualizzazioni:
- 128
- Valutazioni:
- Pubblicato:
-
 Ti stai perdendo delle opportunità di trading:
- App di trading gratuite
- Oltre 8.000 segnali per il copy trading
- Notizie economiche per esplorare i mercati finanziari
Registrazione AccediAccetti la politica del sito e le condizioni d’uso
Se non hai un account, registrati -
 Hai bisogno di un robot o indicatore basato su questo codice? Ordinalo su Freelance
Vai a Freelance
Why do many MetaTrader 5 strategies produce a smooth equity curve on OHLC M1 bars, yet hit unexpected Stop-Losses or breach daily floating drawdown limits on live accounts?
In practice, the discrepancy usually comes from three hidden factors inside historical broker tick feeds:
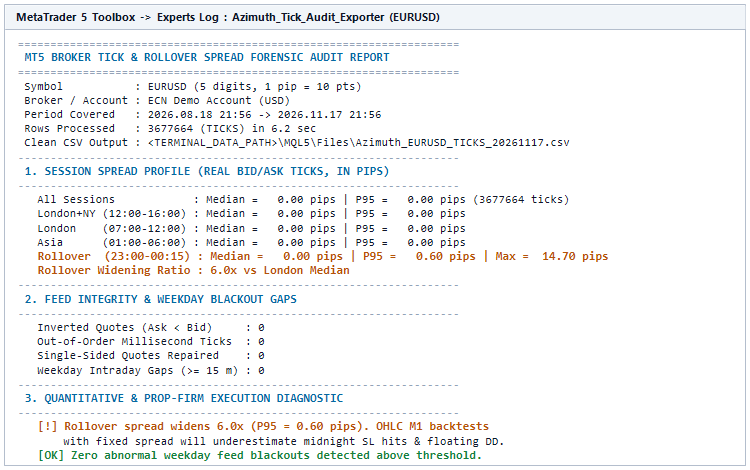
1. Rollover spread widening between 23:00 and 00:15 server time (often 3x to 8x wider than London liquidity).
2. Unnoticed weekday intraday feed blackouts (> 15 minutes) where stops jump across price gaps.
3. Inverted (Ask < Bid) or single-sided ticks in cached history containers.
How It Works (100% Read-Only, Zero DLLs, Memory-Safe):
Attach Azimuth_Tick_Audit_Exporter.mq5 to any chart in MetaTrader 5. It streams up to 120 months of real broker Bid/Ask ticks via CopyTicksRange in 15-day memory-safe chunks and produces:
1. Session-by-Session Real Spread Percentiles (Median P50 and P95 in Pips):
- London + NY Overlap (12:00 - 16:00)
- London Session (07:00 - 12:00)
- Asian Session (01:00 - 06:00)
- Rollover Window (23:00 - 00:15): Median, P95, Max spread, and exact Rollover Widening Ratio vs London.
2. Feed Integrity and Weekday Blackout Audit:
- Counts inverted quotes (Ask < Bid), out-of-order millisecond timestamps, and single-sided quotes.
- Detects weekday intraday feed blackouts above your threshold (ignoring weekend closures and Dec 25 / Jan 1 bank holidays) and prints the Top 3 longest blackouts with timestamps.
3. Clean Chunked CSV Export (Optional, Enabled by Default):
- Writes a standalone human-readable forensic report (MQL5\Files\TickAudit_SYMBOL_DATE.txt).
- Writes a clean UTF-8 millisecond tick CSV (MQL5\Files\Azimuth_SYMBOL_TICKS_DATE.csv) with self-describing symbol, digits, and contract metadata (#AZIMUTH_META) for quantitative Walk-Forward and slippage stress analysis.
Input Parameters:
- InpMode: Audit Real Ticks + Export Clean CSV | Audit Only (No CSV) | Export M1 OHLC + Spread CSV
- InpMonthsBack: History depth to analyze (1 to 120 months, default 12)
- InpCustomSymbol: Target symbol (empty = current chart; auto-resolves broker suffixes)
- InpGapThresholdMinutes: Minimum weekday blackout duration to flag (default 15 minutes)
- InpShowSummaryDialog: Display summary popup when completed 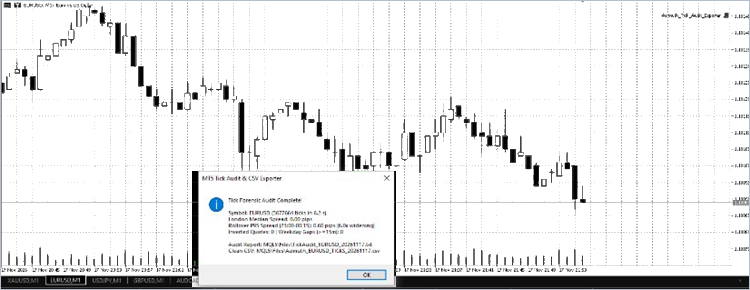
 Relative Volume (RVOL) Indicator in a Subwindow
Relative Volume (RVOL) in a subwindow: the volume of every bar divided by its normal volume, drawn as a color-coded histogram with reference levels and a live text label.
Point of Control (POC) and Value Area Lines for the Day
Builds a volume profile for every day and draws its Point of Control (POC) and the Value Area boundaries (VAH and VAL) as horizontal lines on the chart. The levels of the current day are updated as the day develops.
Gold Donchian Breakout Channel (non-repainting, with HTF trend filter)
Donchian channel of the N bars before each bar, midline and confirmed breakout arrows that never repaint. Optional D1 EMA-slope filter shows only breakouts in the higher-timeframe trend. Alerts and push. Any symbol.
Volatility Squeeze Scanner — Bollinger inside Keltner, with momentum histogram
Shows when volatility is compressed (Bollinger Bands inside the Keltner Channel) and which way it releases. Red dots = squeeze on, green = released, four-colour momentum histogram. Wilder ATR, closed bars, no repaint.