 MetaTrader 5
 Sistemi Esperti
 Indicatori
 Script
 Librerie
 Archiviazione
Guarda come scaricare robot di trading gratuitamente
Ci trovi su Facebook!
Unisciti alla nostra fan page
Unisciti alla nostra fan page
Ti è piaciuto lo script? Provalo nel Terminale MetaTrader 5

MTF Order Block Zones Indicator - indicatore per MetaTrader 5
Bruno Nunes Myrrha Ribeiro

🆓 FREE SOURCE CODE
-
🤖 EXPERT ADVISORS
► Awesome Oscillator Pullback EA for EURUSD:
https://www.mql5.com/en/code/78891
► Stochastic Daily Breakout for Gold:
-
🤖 EXPERT ADVISORS
► Awesome Oscillator Pullback EA for EURUSD:
https://www.mql5.com/en/code/78891
► Stochastic Daily Breakout for Gold:
- Visualizzazioni:
- 94
- Valutazioni:
- Pubblicato:
- Aggiornato:
-
 Ti stai perdendo delle opportunità di trading:
- App di trading gratuite
- Oltre 8.000 segnali per il copy trading
- Notizie economiche per esplorare i mercati finanziari
Registrazione AccediAccetti la politica del sito e le condizioni d’uso
Se non hai un account, registrati -
 Hai bisogno di un robot o indicatore basato su questo codice? Ordinalo su Freelance
Vai a Freelance
An order block is worth watching only while it holds. Price may have come back to it three times already, or closed straight through it last week, and a plain box tells you neither. This indicator draws order blocks from the chart timeframe or a higher one and follows every zone bar by bar, so the chart shows which zones are untouched, which ones price has visited and how often, and where the latest ones gave way.
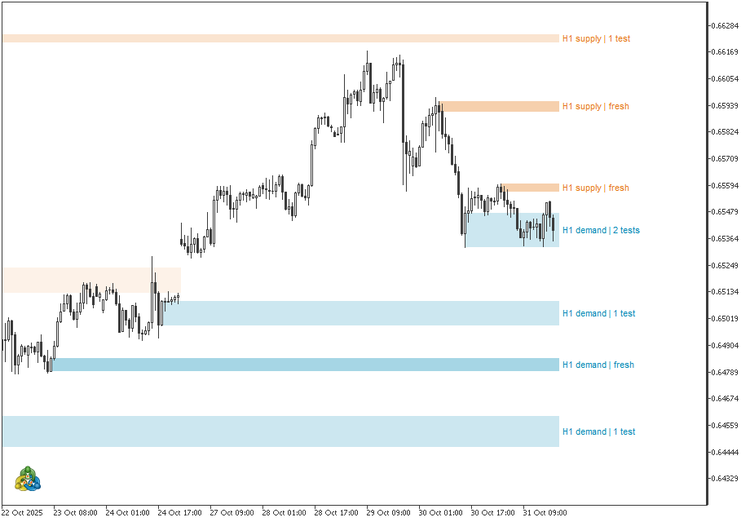
AUDUSD H1, default settings: seven live zones, price sitting in a demand zone it has entered twice, and the last broken supply left faint.
Fresh, tested, broken
Every zone starts fresh, in the stronger tone of its color. The first time a candle reaches back into it, the zone turns tested and its fill gets lighter, and each new visit adds to the count. A visit is one entry, not one bar: ten candles inside a zone count as one test. A demand zone breaks when a candle closes below its bottom, a supply zone when a candle closes above its top; a wick through the far edge is not enough. A short tag to the right of the last bar names each zone, for example H1 demand | fresh or H1 supply | 2 tests. Broken zones leave the chart, except the most recent one on each side, which stays as a faint box ending at the bar that broke it.
What counts as a block
A demand block is a down candle followed by a run of up candles, five by default; a supply block is the mirror image. The run has to carry price far enough from the block candle, the block candle needs a real body, and a near-doji inside the run does not cancel it. The zone price comes from the first candle of the run, from the wick to the body, or optionally from the full high-to-low range or the deepest wick near the block candle.
Every size is measured in average ranges of the block timeframe, so one setting fits any symbol. Across gold, EURUSD, US500, US30 and USTEC on H1, H4 and D1, the defaults found 21.7 to 32.6 blocks per 1,000 bars on all 15 charts, while the same rule written in fixed percentages found 26.7 on gold H1 and only 2.0 on EURUSD H1.
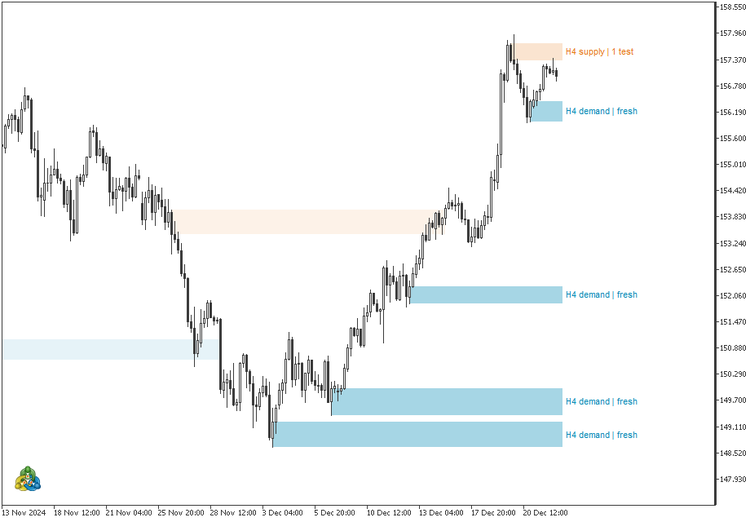
USDJPY H4, default settings: a V-shaped recovery that left four fresh demand zones in steps, never revisited.
Zones never stack
Order blocks often form on top of each other, and stacked boxes turn a chart into a wall of color. Here a new zone takes over the price it covers: live zones of the same side that overlap it merge into it, keeping the widest edges, and overlapping zones of the other side are retired. At any moment no two live zones share a price. The limit of four zones per side, adjustable up to 20, counts live zones only, so a broken zone frees its place at once.
MTF: higher-timeframe blocks, chart-timeframe timing
Set the block timeframe to H4 on an H1 chart and the blocks come from closed H4 candles while their life is followed on H1: a test counts when an H1 candle reaches into the zone, and a break when an H1 candle closes through it, without waiting for the H4 candle to finish. The tags carry the block timeframe, and each copy's objects carry a code built from its settings, so an H1 copy and an H4 copy can share one chart.
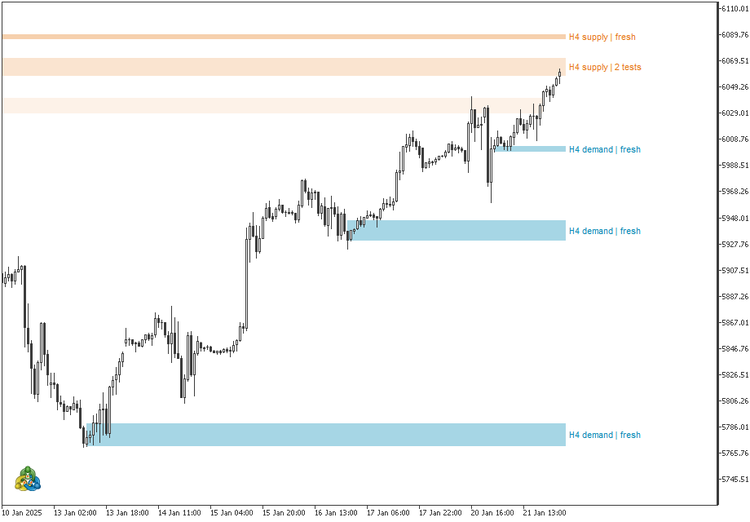
US500 H1 with H4 blocks: three fresh demand zones under the climb and price back in an H4 supply for the second time.
Alerts and Expert Advisors
Closed bars write the history; the bar in progress is applied to a copy, so the tags react on every tick without rewriting the past. The optional alert fires on closed bars when a new block appears and when price returns to a fresh zone for the first time, and stays quiet when the indicator is attached. Four buffers, readable with iCustom and CopyBuffer, hold the top and bottom of the nearest live demand zone (buffers 0 and 1) and of the nearest live supply zone (buffers 2 and 3), or EMPTY_VALUE when a side has none.
Inputs
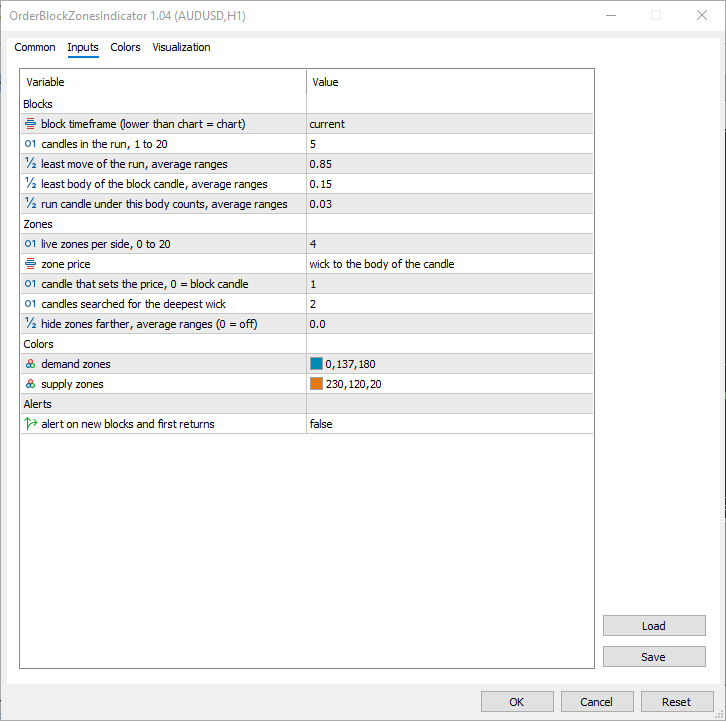
- Blocks: block timeframe (chart); candles in the run, 1 to 20 (5); least move of the run (0.85 average ranges); least body of the block candle (0.15); run candle body that counts either way (0.03).
- Zones: live zones per side (4); zone price (wick to body); candle that sets the price (1); candles searched for the deepest wick (2); hide distant zones, in average ranges (0, off).
- Colors: demand (blue) and supply (amber), blended with the chart background and drawn behind the candles.
- Alerts: new blocks and first returns (off).
Works on any symbol and timeframe, and removing the indicator deletes everything it drew.
Educational content, not financial advice. Trading involves risk of loss.
Info Panel – candle countdown, spread, ATR and daily range
Panel showing a candle countdown, spread, daily ATR and the proportion of the daily range already used.
Session Clock
An animated 24-hour dial of the Sydney, Tokyo, London and New York sessions with automatic daylight saving time, a countdown to the close of the current candle, and live spread and day range. The panel collapses into a bar and can be dragged on the chart.
 History Export from the Strategy Tester (Bars and Ticks)
Exports bars of any timeframe and, optionally, every tick from the Strategy Tester to CSV, without the chart's 100,000-bar limit. Reports gaps inside trading sessions. Places no orders.
NY Open Candle: The Basics
A basic expert advisor that trades in the direction of the 9.30 am New York 5-minute candle on index CFDs (US100 / NAS100). One trade per day, fixed stop-loss and take-profit levels, forced closure; no martingale or grid strategy.