 MetaTrader 5
 Sistemi Esperti
 Indicatori
 Script
 Librerie
 Archiviazione
Unisciti alla nostra fan page

Info Panel - candle countdown, spread, ATR and daily range - indicatore per MetaTrader 5

- Visualizzazioni:
- 18
- Pubblicato:
-
 Ti stai perdendo delle opportunità di trading:
- App di trading gratuite
- Oltre 8.000 segnali per il copy trading
- Notizie economiche per esplorare i mercati finanziari
Registrazione AccediAccetti la politica del sito e le condizioni d’uso
Se non hai un account, registrati -
 Hai bisogno di un robot o indicatore basato su questo codice? Ordinalo su Freelance
Vai a Freelance
Hai bisogno di un robot o indicatore basato su questo codice? Ordinalo su Freelance
Vai a Freelance

InfoPanel is a compact panel drawn on the chart that shows the information you check all the time: the time left before the current candle closes, the current spread, the daily ATR and how much of the average daily range has already been used today.
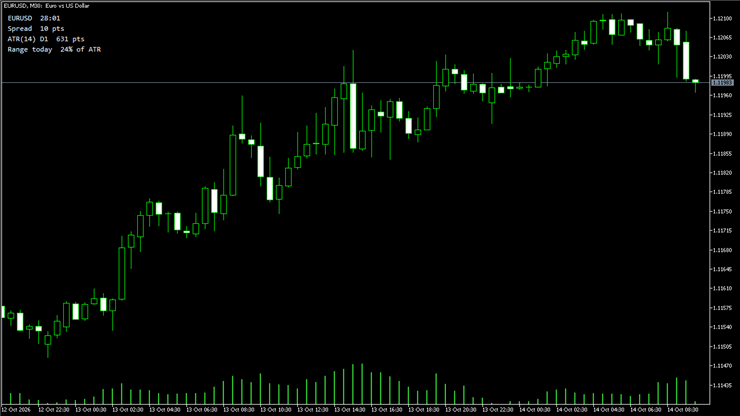
What it shows:
- Symbol and countdown to the close of the current candle
- Spread in points (turns red when it is wide)
- ATR of the daily timeframe, in points
- Range of today as a percentage of the daily ATR (turns gold above 100%)
Inputs:
- ATR period
- Corner of the chart, X and Y offset, font size and text colour
Notes:
- Works on any symbol and any timeframe
- Light on resources: one timer per second and four text labels
- No signals: purely informative
How to use:
1. Copy InfoPanel.mq5 into the MQL5\Indicators folder of your terminal (File - Open Data Folder) and compile it in MetaEditor.
2. Drag InfoPanel from the Navigator window onto any chart.
3. Change corner, offsets and colour in the inputs tab if you want to move the panel.
Tips:
- When the range used is already above 100% the day has moved more than usual: be careful with new entries.
- A wide spread (red) is a good moment to avoid market orders.
Key Levels - previous day, week and month High, Low, Close
Draws previous day, week and month High/Low/Close and the daily open as labeled horizontal lines.
Session Ranges - Asia, London and New York boxes
Draws high/low range boxes for the Asian, London and New York sessions with range size in points.
 370 Percent from 2022 to 2026 at 10 Percent MaxDD. The GER40 EA That Waits for the Market to Coil
GER40 Evening Coil is a free, fully open EA for the German 40 index on H1. It buys in the evening session after a recent narrow-range bar, when volatility is calm and volume is normal, and closes everything by 23:00 server time. Four conditions, long only, one trade at a time, a stop loss on every trade.
GDS Renko ADX Demo EA
Un piccolo Expert Advisor didattico che mostra come l'ADX di Wilder e il Directional Movement possano essere calcolati direttamente dai mattoncini Renko classici completati. L'Expert Advisor costruisce internamente blocchi Renko di dimensioni fisse a partire dai tick BID. Non sono necessari grafici offline, simboli personalizzati, DLL o indicatori esterni. +DI, -DI e ADX vengono aggiornati solo dopo il completamento di un blocco Renko.