 MetaTrader 5
 Sistemi Esperti
 Indicatori
 Script
 Librerie
 Archiviazione
Unisciti alla nostra fan page

Session Ranges - Asia, London and New York boxes - indicatore per MetaTrader 5

- Visualizzazioni:
- 13
- Pubblicato:
- Aggiornato:
-
 Ti stai perdendo delle opportunità di trading:
- App di trading gratuite
- Oltre 8.000 segnali per il copy trading
- Notizie economiche per esplorare i mercati finanziari
Registrazione AccediAccetti la politica del sito e le condizioni d’uso
Se non hai un account, registrati -
 Hai bisogno di un robot o indicatore basato su questo codice? Ordinalo su Freelance
Vai a Freelance
Hai bisogno di un robot o indicatore basato su questo codice? Ordinalo su Freelance
Vai a Freelance

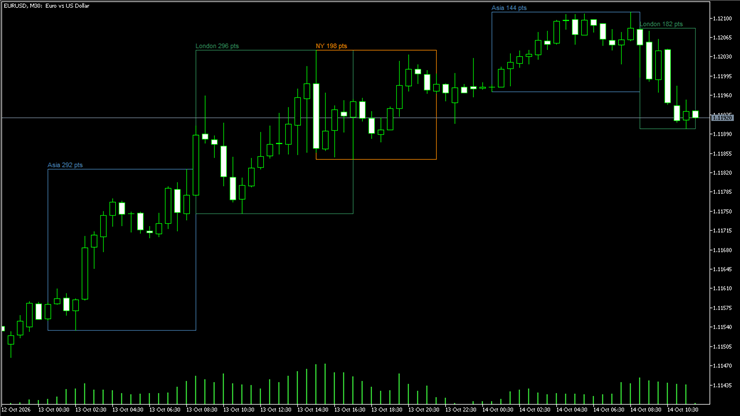
- No signals: purely visual, no repainting (a box only grows while its session is running)
How to use:
1. Copy SessionRanges.mq5 into the MQL5\Indicators folder of your terminal (File - Open Data Folder) and compile it in MetaEditor.
2. Drag SessionRanges from the Navigator window onto any chart.
3. Set the session hours to your broker server time. The defaults suit a server on Central European time: Asia 01:00-09:00, London 09:00-17:30, New York 15:30-22:00.
How it works:
For each session and for each of the last N days the indicator reads the M15 bars inside the session window and draws a rectangle from the lowest low to the highest high. The label above each box shows the range in points. The box of a running session grows until the session ends; closed sessions never change, so nothing repaints.
Tips:
- Watch how the Asian range is broken at the London open.
- Compare the size of the current session range with the previous days.
- Weekends are skipped automatically.
Momentum Vwap Barrier Breakout / BhanuCodeLab
Momentum VWAP Barrier Breakout is an MT5 indicator that identifies tested support and resistance zones and displays confirmed breakout arrows after the candle closes. It includes optional VWAP, SMA, SMMA, and no-filter modes, with VWAP selected by default. Designed primarily for XAUUSD M5, it can also be tested on M15 and M30 for fewer but potentially cleaner signals. Traders may consider entering at the next candle’s open, placing the stop beyond the breakout candle or broken zone, and targeting approximately 1.5R to 2R. Use the indicator together with market structure, higher-timeframe direction, news awareness, and proper risk management. Test it thoroughly on historical data and a demo account before using it with real money.
Point and Figure
Point & Figure draws a classic P&F chart (X columns for rising prices, O columns for falling prices) in a separate indicator window, on any symbol and timeframe. It also adds a trading panel and support/resistance lines on the main chart.
Key Levels - previous day, week and month High, Low, Close
Draws previous day, week and month High/Low/Close and the daily open as labeled horizontal lines.
Info Panel - candle countdown, spread, ATR and daily range
Panel with candle countdown, spread, daily ATR and the share of the daily range already used.