 MetaTrader 5
 Sistemi Esperti
 Indicatori
 Script
 Librerie
 Archiviazione
Unisciti alla nostra fan page

Trade Excursion Report: MFE and MAE of every closed trade, to CSV - script per MetaTrader 5

- Visualizzazioni:
- 106
- Valutazioni:
- Pubblicato:
-
 Ti stai perdendo delle opportunità di trading:
- App di trading gratuite
- Oltre 8.000 segnali per il copy trading
- Notizie economiche per esplorare i mercati finanziari
Registrazione AccediAccetti la politica del sito e le condizioni d’uso
Se non hai un account, registrati -
 Hai bisogno di un robot o indicatore basato su questo codice? Ordinalo su Freelance
Vai a Freelance
Hai bisogno di un robot o indicatore basato su questo codice? Ordinalo su Freelance
Vai a Freelance
Cosa c'è scritto
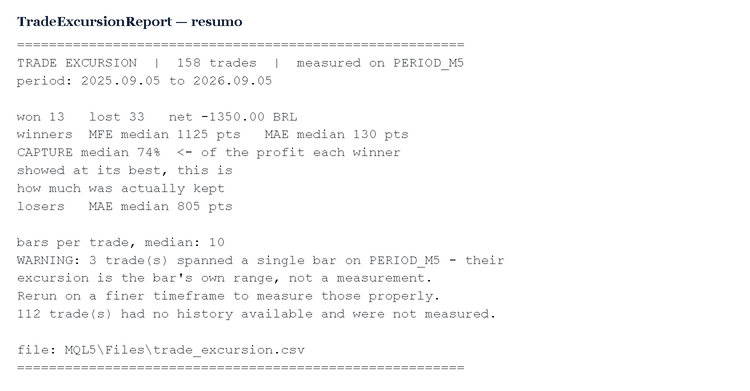
Una riga per ogni posizione chiusa, raggruppate per DEAL_POSITION_ID (funziona su conti di copertura e di compensazione; testato su un conto demo di copertura). Colonne: ticket, simbolo, direzione, ora di entrata, ora di uscita, prezzo di entrata, prezzo di uscita, punti di profitto, punti MFE, punti MAE, rapporto di cattura, barre coperte, tempo di detenzione.
Dati di input
- InpDias — numero di giorni di dati storici da leggere (365)
- InpSoEsteAtivo — solo il simbolo del grafico, oppure tutti i simboli nella cronologia (false)
- InpTF — timeframe utilizzato per misurare le escursioni (grafico corrente)
- InpArquivo — nome del file CSV in MQL5\Files
Riepilogo stampato nel log degli Expert
Numero di operazioni, vincenti/perdenti, risultato netto, MFE e MAE mediani delle operazioni vincenti, MAE mediano delle operazioni in perdita, rapporto CAPTURE mediano, numero mediano di barre per operazione, numero di operazioni su una singola barra e numero di operazioni che non è stato possibile misurare perché il terminale non dispone più di barre per quel simbolo (ad esempio, futures scaduti): questi dati vengono riportati, anziché essere silenziosamente registrati come zero.
Limite di misurazione
Le escursioni vengono calcolate tra il massimo e il minimo delle barre che compongono ciascuna operazione su InpTF. L’andamento all’interno di una barra è sconosciuto. Se la colonna delle barre mostra un 1 per molte operazioni, eseguire l’analisi su un timeframe più piccolo.
Condividi il file TradeExcursion.mqh con l’indicatore Trade Excursion; il file include va inserito in MQL5\Include.
Tradotto dall’inglese da MetaQuotes Ltd.
Codice originale https://www.mql5.com/en/code/77050
 SessionReopenEA
L'oro presenta una pausa di mantenimento giornaliera sul CME. La prima ora dopo tale pausa registra un rialzo superiore a quanto spiegabile dal caso, in ogni anno solare di un campione di 11 anni, mentre tutte le altre ore della giornata mostrano un andamento piatto. Un'operazione per sessione, uno stop lato server proporzionale alla volatilità, nessun averaging né grid. Poi il mio modello di costo si è rivelato errato. Un backtest su tick reali ha mostrato che il costo effettivo di andata e ritorno alla riapertura è di circa 60 punti, non i 19 che la mia ricerca aveva calcolato: il campo dello spread delle barre M1 è un riepilogo per singola barra e lo sottostima di circa tre volte. Rieseguendo l’analisi su 11 anni con il costo corretto: +3,34 bps, t 7,40, 59,3% di operazioni vincenti -> +1,60 bps, t 3,42, 50,8% di operazioni vincenti Il vantaggio rimane, ma con meno della metà della sua forza originaria. Il secondo dato è quello reale. Cosa non è: circa il +3,3% all’anno con un drawdown del 4,6%, con un anno negativo ogni nove circa. A 0,01 lotti si tratta di circa 130 all’anno – una cifra che misura la dimensione della posizione, non la strategia.
 Prop Daily Loss Meter
Shows how much of the daily loss limit of a prop firm account is already used, and how much is left. Read-only indicator.
 CGoldSymbol - find the broker's gold and size the position correctly on it
Rileva il simbolo “gold”, indipendentemente dal nome con cui lo chiama il broker, legge le specifiche del contratto dal terminale invece di ipotizzarle e converte il rischio nella valuta del conto in una dimensione del lotto corretta per quel broker.
OHLC Reality Check - at what stop distance does your backtest start lying?
Apre un’operazione virtuale tra parentesi su ogni barra M1, la fa scorrere in avanti sulla cronologia reale dei tick e rileva, per una serie di distanze di stop, con quale frequenza la modellizzazione OHLC a 1 minuto attribuirebbe all’operazione un risultato opposto a quello previsto.