 MetaTrader 5
 Sistemi Esperti
 Indicatori
 Script
 Librerie
 Archiviazione
Unisciti alla nostra fan page

Previous Week High Low Indicator - indicatore per MetaTrader 5

Building, learning, and sharing one project at a time.
- Visualizzazioni:
- 1064
- Valutazioni:
- Pubblicato:
- Aggiornato:
-
 Ti stai perdendo delle opportunità di trading:
- App di trading gratuite
- Oltre 8.000 segnali per il copy trading
- Notizie economiche per esplorare i mercati finanziari
Registrazione AccediAccetti la politica del sito e le condizioni d’uso
Se non hai un account, registrati -
 Hai bisogno di un robot o indicatore basato su questo codice? Ordinalo su Freelance
Vai a Freelance
Hai bisogno di un robot o indicatore basato su questo codice? Ordinalo su Freelance
Vai a Freelance

Previous Week High & Low
The idea behind it
The weekly range is one of the cleanest higher-timeframe reference points available on an intraday chart: it filters out the day-to-day noise and leaves just two numbers — where price was rejected and where it was accepted over the full prior week. Swing traders and intraday traders alike use these levels as a map for the week ahead, whether that means fading a return to last week's high, watching for a breakout continuation once it is cleared, or treating last week's low as a standing support reference. This indicator reads those two values straight from the completed Weekly (W1) bar and draws them as horizontal levels across the current week, so you never have to switch to a weekly chart to find them.
It works on any symbol and any intraday-to-daily timeframe, since the levels themselves always come from W1 data regardless of the chart you have open. Optionally, more than one previous week can be shown at once, with each week's High/Low drawn only across the specific week it was active for — useful for spotting levels that have lined up or been repeatedly respected across several weeks.
How to interpret it
- PWH (Previous Week High) — the highest price reached during the prior completed trading week. Often acts as swing resistance or a breakout trigger once cleared.
- PWL (Previous Week Low) — the lowest price reached during the prior completed trading week. Often acts as swing support or a breakdown trigger once broken.
- Multi-week stacking — when InpWeeksToShow is greater than 1, each older week's level is drawn only across the week it actually applied to, with a "-N" suffix on its label (e.g. PWH-1 , PWH-2 ) so historical and current levels never overlap or get confused with one another.
- Live refresh — levels are rebuilt automatically the moment a new Weekly bar opens, so the indicator always reflects the most recently completed week without needing to be removed and re-attached.
External variables (inputs)
| Input | Default | Purpose |
|---|---|---|
| InpWeeksToShow | 1 | Number of previous trading weeks to display (1-8). Each week's levels are drawn only across the week they applied to. |
| InpShowHigh | true | Toggles the Previous Week High line on or off. |
| InpShowLow | true | Toggles the Previous Week Low line on or off. |
| InpHighColor / InpLowColor | Lime / Red | Independent colors for the two levels. |
| InpLineStyle / InpLineWidth | Dash / 1 | Line style and width applied to both levels. |
| InpShowLabels | true | Shows a text label (e.g. "PWH") at the right-hand edge of each level. |
| InpShowPriceInLabel | true | Appends the exact price value to each label. |
| InpLabelFontSize | 8 | Font size used for the level labels. |
Recommended use
Works on any symbol and any timeframe up to and including Daily (M1–D1 are typical), since the High/Low values are always sourced from the Weekly timeframe regardless of the chart period. The exact week boundary (which day the weekly bar opens on) is set by your broker's server — most open weeks on Sunday or Monday server time — so check this against the week definition you actually trade by before relying on the exact level, particularly around holidays with shortened trading weeks.
All chart objects are created under a single internal name prefix and are fully removed via ObjectsDeleteAll() in OnDeinit() when the indicator is detached, so it leaves nothing behind on the chart.
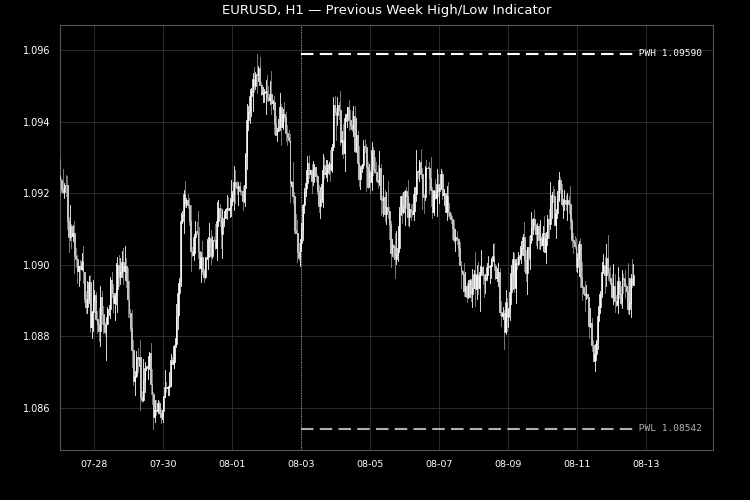
Fig. 1. Previous week's High and Low plotted as horizontal levels across the current week on EURUSD H1. Rendered in black and white per the Code Base image guidelines (750×500 px).
 Daily Zone Recovery EA mt5 for GOLD
Daily Zone Recovery is a multi-strategy trading expert advisor for MetaTrader 5 that operates based on the previous trading day’s high and low levels. The expert advisor monitors price behavior near daily extremes, uses three independent entry strategies, and can manage positions using a fixed-volume grid.
 Magic Number Inventory, Trade Logging and Classifying by Magic Number
A read-only audit script for accounts running several EAs (or manual trades alongside them). It groups the closed-trade history by magic number and prints one line per magic: closed round turns, net P/L including swap and commission from BOTH sides of the trade, win rate, profit factor, average win/loss, currently open positions and pendings, activity dates and symbols - sorted by net result, with a CSV export for spreadsheets.
Scalping Dashboard
This indicator is a professional Scalping Dashboard utility designed specifically for MetaTrader 5 (MT5). It displays real-time vital market status information and scalping strategy conditions (based on Exponential Moving Arrows/EMAs), automatically computing spreads, momentum, and moving averages to output instant BUY/SELL SETUP visual signals.
Swing Trading Dashboard
Swing Trading Dashboard is a visual indicator for MetaTrader 5 (it does not generate automatic trade signals — it only displays information on the chart). Essentially it's a "dashboard" panel that calculates the recent swing trading range and shows where the current price sits relative to it — mid-range, near a boundary, or already broken out.