Long Term Stats

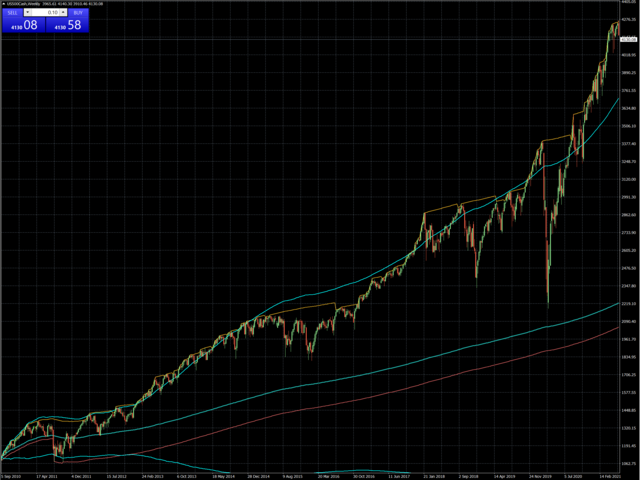
Long term stats is a trend indicator. 

As the name suggests, it computes long term running average, standard deviation and min/max values

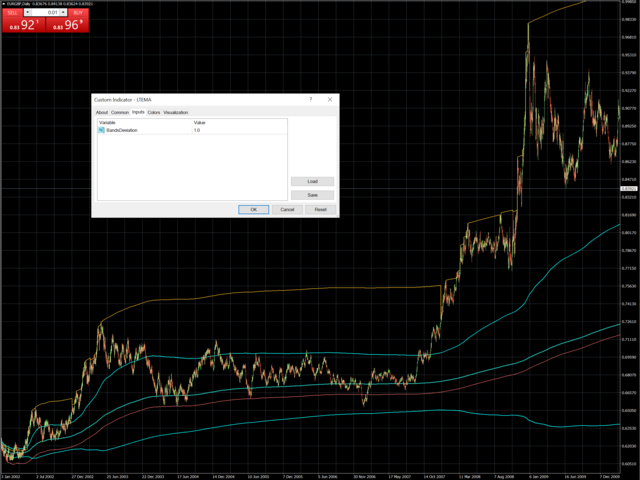
Average and standard deviation are plotted on the graph and deviation value is taken as input parameter (similarly to bollinger bands).

Historical minimum and maximum are plotted on the graph and updated for each bar, considering historical time series slope. (this is to somehow account for inflation/deflation)

Can be used as filter for signals, as trigger to get into the market or as parameter for position sizing.

Produits recommandés
The Sentiment Ratio indicator gauges current Market Sentiment between -100% and 100%, where lower than -40% is considered Bearish and higher than 40% is Bullish. The channel between the two is considered Neutral. The indicator has been a very useful filter tool for signals within a trading system. Example call function:  int SentimentIndicator(double triggerLevel)//Return sentiment if trigger level is activated {   double sentimentRatio=iCustom(NULL,0,"Sentiment Ratio",0,0,0);   if(sentimentRat
FREE
I recommend you to read the   product's blog  (manual) from start to end so that it is clear from the beginning what the indicactor offers. This multi time frame and multi symbol supply and demand zone dashboard indicator sends alerts when the price has reached a supply/demand zone. It is also possible to use it to be alerted about regular double tops/bottoms instead of zones. It can be used with all time frames from M1 to MN. It is possible to use RSI, divergence (MACD, OsMA, RSI or Awesome) a
Bermaui Channel
Muhammad Elbermawi
5 (19)
This is a price channel that shows five important price levels on the chart. Those levels are: 1. The Highest High (HH) of the previous x bars. 2. The Highest Low (HL) of the previous x bars. 3. The Center Line. 4. The Lowest High (LH) of the previous x bars. 5. The Lowest Low (LL) of the previous x bars. How does Bermaui Channels Captures Overbought  area Think of the distance between HH and HL levels as an overbought area. When the price candles or bars crosses the HL to the upside this indica
Trend Analysis in act
Ihab Mohamed Kamal Fouda
The Trend Analysis Indicator is an innovative tool designed for traders and investors who seek to navigate the complexities of the financial markets with greater precision and insight. This powerful indicator is engineered to adeptly identify whether a market is trending or not, offering users a vital edge in their trading strategy. Key Features: Accurate Trend Detection : The core functionality of the Trend Analysis Indicator lies in its ability to accurately detect market trends. It analyzes p
RSI Jurik
Augustine Kamatu
Introducing RSI Jurik—an innovative indicator designed to revolutionize your forex trading strategy by combining custom moving averages based on the Relative Strength Index (RSI) with the MetaTrader 4 indicator, RSI. Jurik moving averages are renowned for their accuracy and reliability in analyzing price movements in the forex market. They provide traders with smoother representations of price action, reducing noise and offering clearer signals for identifying trends and potential reversals.
FREE
PowerXXX
Marco Fornero Monia
PowerXXX measures the power of the current candlestick and displays it in numerical format and colors. The indicator can cover multiple timeframes and can be placed on the main chart or on the charts of the underlying indicators. The number of timeframes is selectable, as well as the color levels according to the power expressed. In the latest version, the power can be expressed as a function of the opening of the candle itself or as a function of the opening of the total candles before. There
High Low Predict
Thomas Bradley Butler
This indicator is designed to help you forecast the potential high and low prices for the current trading day, based on the high and low of the previous day. It does this by applying a customizable percentage increase or decrease to those levels. How It Works: The idea is simple: It looks at the previous day's high and low prices and then adjusts them by a percentage you choose. Here's what that means: Predicted High: This is calculated by taking the high price of the previous day and adding a p
Moving pivot Average Fibonacci The  indicator compares the selected period with its counterpart from the previous period. The indicator determines the moving Fibonacci levels for the day or any time interval to assess the price movement range from the time average. The indicator helps predict the expected high or low for the day based on historical time data. The pivot line can be considered an average trend line and use it in a variety of trading strategies. If you have any question about the
Signal Eskiya
Vitalii Zakharuk
Signal Eskiya, in addition to channel lines, reflects entry signals in the form of arrows. Trading strategies using the channel indicator belong to the classic methods of technical analysis, are easy to execute, and therefore available even to beginners. Price ranges work equally well on any trading assets and timeframes, they can be used both independently and with additional confirmation from oscillators and market volumes. American traders say: “Trend is your friend”, which means “Trend is
The Trend Professor is a moving average based indicator designed for the purpose of helping the community of traders to analyse the price trend. The indicator will be displayed in the main chart as it is indicated on the screenshot section. How it works The indicator has lines of moving averages and colored histograms to depict the direction of the trend. There will be a fast signal line colored blue/yellow/red at some points. The red/yellow colored lines stands for bearish trend/signal while th
Tiger Trend
Leandro Bernardez Camero
Tiger Trend – Indicateur de retournement de tendance basé sur une plage dynamique Rejoignez le canal pour rester informé : https://www.mql5.com/en/channels/forexnewadvisor Tiger Trend est un indicateur de tendance dynamique conçu pour détecter les retournements de tendance potentiels à partir de niveaux de support et de résistance adaptatifs calculés sur la base des plages de prix récentes. Il aide les traders à identifier les changements de momentum en analysant les clôtures des prix par rappo
Moving Pivot Average    The pivot indicator compares the selected period with its counterpart from the previous period. The indicator uses very flexible algorithm for pivot value calculating. It allows you to allocate in days a certain time intervals (custom bars) and calculate the average pivot value based on High, Low and Close prices of these bars. How many custom bars will be taken into account is determined by the "Days" setting. The pivot line can be considered an average trend line and us
No Repaint Bext
Andrey Kozak
1 (1)
No Repaint Bext est un système de trading complet. Il indique quand ouvrir et fermer une position ainsi que la direction de la transaction. Chaque fois qu'une flèche verte apparaît, vous devez ouvrir une position d'achat . Toutes les positions d'achat sont fermées lorsqu'une flèche rouge apparaît. De même, chaque fois qu'une flèche rouge apparaît, une position de vente est ouverte et sera fermée lorsque la flèche verte apparaît. Le trading se fait sur l' unité de temps M5 et peut être utilisé s
Premium Smart Money Concepts (SMC) Indicator – BOS | CHoCH | FVG | OB | Liquidity Zones - Break of Structure (BOS) and Change of Character (CHoCH)   - Fair Value Gaps (FVG) with auto zones   - Order Blocks (OB) detection   - Liquidity zones and inducement markers   - Alerts for key SMC signals   - Clean chart visuals – customizable and beginner-friendly   - Works on any pair, any timeframe - Trusted SMC logic built for MetaTrader 4   - Real-time signals, no lag or repainting   - Improves decis
Volume Fractals
Mikhail Nazarenko
4.83 (6)
Fractal is one of the main indicators in a number of strategies. Volume Fractals has expanded the functionality of the standard indicator version. The product features fractals sorting and displaying fractals representing both price and volume extreme points. Application Stop losses Reversal signals Placing pending orders for a fractal breakout Options Bars of history - number of chart bars the indicator is displayed for Left side minimum bars - minimum number of bars to the left of the fracta
FREE
L'indicateur de Carré Gann est un puissant outil d'analyse du marché basé sur l'article "Formule Mathématique pour les Prédictions de Marché" écrit par W.D. Gann. Cet outil utilise des concepts mathématiques et des théories de Gann pour réaliser une analyse précise du marché. Il utilise les carrés de 144, 90, 52 et aussi le carré de 9. De plus, il intègre la méthode du  pour le carré de 9 et sa relation avec les canaux et le modèle en étoile de ce carré. Manuel d'Utilisateur et Application : Ava
Overview Comprehensive technical analysis indicator combining 20+ essential trading tools in a single chart display. Moving Averages EMA (Exponential Moving Average): 9, 21, 50, 200 periods SMA (Simple Moving Average): configurable period Customizable colors and line widths Price position indicators (above/below) Oscillators & Momentum RSI (Relative Strength Index): adjustable overbought/oversold levels MACD (Moving Average Convergence Divergence): customizable fast/slow/signal periods Stochasti
About
Tatiana Savkevych
About - Forex indicator. This trend indicator is used to determine the current trend in price movement, making it clear in which direction it is better to open a position: buy or sell. The About trend indicator is displayed on the chart and moves in parallel with the price. The Forex About trend indicator allows you to determine in time a change in the direction of price movement, thereby minimizing the likelihood of capital loss. In trading practice, various combinations of About and other ind
Indicateur Crypto_Forex « Histogramme d'entrée de tendance » pour MT4, sans refonte. - L'indicateur Histogramme d'entrée de tendance permet de rechercher des signaux d'entrée dans la direction de la tendance une fois la barre d'entrée affichée. - Cet indicateur possède une fonctionnalité unique : il prend en compte le prix et le volume pour ses calculs. - L'histogramme d'entrée de tendance peut être de deux couleurs : rouge pour une tendance baissière et bleu pour une tendance haussière. - Dès
Blogs : https://www.mql5.com/en/blogs/post/768816 Version MT4 : https://www.mql5.com/en/market/product/139061 Version MT5 : https://www.mql5.com/en/market/product/139062 Problème Surveiller simultanément plusieurs symboles et unités de temps est lent, répétitif et mentalement épuisant. La plupart des traders perdent du temps à changer de graphique un par un, pour finalement se rendre compte que le mouvement a déjà eu lieu. Lorsqu'un changement de tendance clair est visible, l'opportunité e
Ratio market
Aleksandr Krokhalev
4.33 (15)
Volatility under control. The indicator shows the optimal depth for setting goals within the day and on the average trend. It also builds pivot zones for the estimated correction depth. As an accompaniment, the key levels of the structure are displayed for several timeframes. Classical volatility indicators ATR & ADX on fixed timeframes are used for calculation. The calculation takes into account the spread, and if the market is slightly volatile, you will see a warning about the risk. You can c
FREE
NO REPAINT ADVANCED CHART PATTERN INDICATOR By definition, a price ( chart)  pattern is a recognizable configuration of price movement that is identified using a series of  trendlines  and/or curves. When a price pattern signals a change in trend direction, it is known as a reversal pattern; a continuation pattern occurs when the trend continues in its existing direction following a brief pause. Advanced Chart Pattern Tracker is designed to find the MOST ACCURATE patterns. A special script is a
TrendDecoder Scanner MT4
Christophe Pa Trouillas
Obtenez les signaux de TrendDECODER pour plusieurs actifs et plusieurs unités de temps | Déterminez la meilleure unité de temps pour entrer | Maximisez vos profits et vos trades gagnants Indicateur et screener non repeignant, non retardé - idéal pour le trading manuel et automatisé - pour tous les actifs et toutes les unités de temps 49 $  pour les 50 premières copies - puis 99 $ Après votre achat, veuillez laisser un commentaire ou un avis et nous vous enverrons un indicateur SUPPLÉMENTAIRE d'u
American Hunters
Mehmet Ozhan Hastaoglu
This indicator guides you like a hunter. Tacheprofit and StopLoss levels. See the difference in the experiment. Works in all periods. Works at all rates. You can win with this system. The crossing of the mean and the re-test were done according to the rule. You can see the transactions by moving backwards on the strategy test screen. The whole system is automatically calculated.
Holy Trend PRO
Bianca Seara
5 (1)
About Holy Trend was developed to identify trend and strength. VIDEO (information and tips) [HERE] Features Identifies trend Identifies strength of trend Identifies lines of support and resistance Easy to analyze Fast signals All timeframes Not repaint (when candle close) No settings required Can be used in Renko charts Can be used with indicator Holy Renko PRO Alerts, email and push notifications Advantages Sensitive identifier of trend able to identify the long, short movements and correc
Projection Trend - a Forex arrow indicator without redrawing does not change its signals when the market situation changes, does not adjust to the chart. The signals given by him are unambiguous. Traders build a trading system that provides good signals 80-90% of the time. The indicator showing the points of entry and exit from the market with arrows is able to bring results not only in the Forex market, but also when working with binary options. You can buy it and install it in MetaTrader you
Cherokee
Andrey Kolmogorov
5 (1)
Cherokee  - is a professional adviser based on a trend tracking system with an adaptive algorithm. New sets are in the "Comments" section comments #2-3. Signal: 6 currency pairs Main Advantages 6 currency pairs; The EA does not use Martingale; The minimum starting deposit is $300; No need to close the robot during news releases; It works with 4 and 5-digit quotes; A multi-level model of a quantum set. Working parameters Currency pairs : EUR/USD, GBP/USD, EUR/CHF, USD/CHF, USD/CAD, USD/JPY ,  
The Smart Martin advisor automates a trading strategy based on support/resistance levels for EURUSD (H1 timeframe). Key Features: Precise entry based on breakout/bounce from levels. Strict risk management: fixed Stop Loss and Take Profit. False signal filtering through volatility analysis. Strategy Details Entry Rules Levels are built based on technical price analysis. Exit Rules Stop Loss: 200 points from the entry level (fixed). Take Profit: 200 points (risk-reward ratio 1:1). Settings Para
Summary This indicator is based on RSI and Momentum indicators. It also considers moving averages of these two indicators. The three indicators have adjustable settings. The arrows do not repaint since the indicator only uses confirmed values and waits for the candle to close before painting an arrow. The indicator is also able to alert when arrows appear. There are 3 types of alerts - Popup, Email and Mobile Push Notifications. The arrows can be used in the EA and the inputs can also be optimiz
FREE
Multi-timeframe Parabolic SAR dashboard allows you to add and monitor PSAR trends. The multi-timeframe Parabolic SAR dashboard will save you a lot of time and gives you a single view of the markets using PSAR. In short, you can just view one window and get a snapshot of up to 21 instruments on your MT4 platform. The indicator opens in a sub-window. Below are the features of the PSAR Dashboard Indicator Modify PSAR Settings: The PSAR Dashboard comes with default PSAR settings of 0.02 (Step) and 0
Les acheteurs de ce produit ont également acheté
Gann Made Easy
Oleg Rodin
4.83 (162)
Gann Made Easy est un système de trading Forex professionnel et facile à utiliser qui est basé sur les meilleurs principes de trading en utilisant la théorie de mr. WD Gann. L'indicateur fournit des signaux d'ACHAT et de VENTE précis, y compris les niveaux Stop Loss et Take Profit. Vous pouvez échanger même en déplacement en utilisant les notifications PUSH. VEUILLEZ ME CONTACTER APRÈS L'ACHAT POUR RECEVOIR GRATUITEMENT DES INSTRUCTIONS DE TRADING ET D'EXCELLENTS INDICATEURS SUPPLÉMENTAIRES! Vou
M1 Sniper
Oleg Rodin
5 (22)
M1 SNIPER est un système d'indicateurs de trading facile à utiliser. Il s'agit d'un indicateur à flèche conçu pour l'unité de temps M1. Cet indicateur peut être utilisé seul pour le scalping sur l'unité de temps M1 ou intégré à votre système de trading existant. Bien que conçu spécifiquement pour le trading sur l'unité de temps M1, ce système peut également être utilisé avec d'autres unités de temps. Initialement, j'avais conçu cette méthode pour le trading du XAUUSD et du BTCUSD. Cependant, je
Scalper Inside PRO
Alexey Minkov
4.74 (69)
Scalper Inside PRO – Since 2020. An exclusive indicator that utilizes an innovative algorithm to swiftly and accurately determine the market trend. The indicator automatically calculates opening, closing, and profit levels, providing detailed trading statistics. With these features, you can choose the most appropriate trading instrument for the current market conditions. Additionally, you can easily integrate your own arrow indicators into Scalper Inside Pro to quickly evaluate their statistics
Le système PRO Renko est un système de trading très précis spécialement conçu pour le trading de graphiques RENKO. Il s'agit d'un système universel qui peut être appliqué à divers instruments de négociation. Le système neutralise efficacement ce qu'on appelle le bruit du marché en vous donnant accès à des signaux d'inversion précis. L'indicateur est très facile à utiliser et n'a qu'un seul paramètre responsable de la génération du signal. Vous pouvez facilement adapter l'outil à n'importe que
Auto Optimized Parabolic RSI : Moteur de Momentum 3D Avancé La plupart des indicateurs pour les particuliers échouent car ils s'appuient sur des paramètres statiques qui se brisent dès que la volatilité du marché change. L'Auto Optimized Parabolic RSI résout le problème de l'« obsolescence des indicateurs » en recalculant continuellement son propre avantage mathématique, apportant une adaptation quantitative de niveau institutionnel directement sur votre terminal MT5. L'Avantage Principal : Opti
Quantum Breakout Indicator PRO
Bogdan Ion Puscasu
4.96 (26)
Présentation       Quantum Breakout PRO   , l'indicateur révolutionnaire MQL5 qui transforme la façon dont vous négociez les zones d'évasion ! Développé par une équipe de traders expérimentés avec une expérience de trading de plus de 13 ans,   Quantum Breakout PRO   est conçu pour propulser votre parcours de trading vers de nouveaux sommets grâce à sa stratégie de zone de discussion innovante et dynamique. Quantum Breakout Indicator vous donnera des flèches de signalisation sur les zones d'év
Market Makers
Mohamed Hassan
5 (4)
After purchase, contact me privately to receive 1 month of free testing with EA Forex Proton! This advanced MT4 trading robot automatically executes signals from any MT4 indicator, including Market Makers. The latest version also includes AI integration, allowing each trade signal to be analyzed using Artificial Intelligence. Live Signal with EA Forex Proton: Click here Market Makers is a powerful price action trading system designed to identify high-probability Buy and Sell opportunities based
Apex Edge No Repaint Indicateur de trading professionnel sans repeint pour MT4 Apex Edge No Repaint est un outil de trading haut de gamme, clair et fiable, conçu pour les traders forex et cryptomonnaies exigeants qui recherchent des signaux précis sans la frustration des flèches qui se repeignent constamment. Caractéristiques principales : Aucun repeint – Les signaux restent fixes une fois affichés sur le graphique Système de double signal : Signaux bruts pour les opportunités précoces et
Cet indicateur fonctionne en conjonction avec la théorie des vagues d'Elliott de deux manières : Mode automatique : Dans ce mode, l'indicateur détectera automatiquement les cinq vagues motrices sur le graphique conformément à la théorie des vagues d'Elliott. Il fournira des prédictions et identifiera les zones potentielles de retournement. De plus, il a la capacité de générer des alertes et des messages push pour informer les traders des développements importants. Cette fonctionnalité automatiqu
Please send me Direct message on MQL5 CHAT after purchasing the Indicator for Training and Installation Support There are some additional files that is important to use with the Indicator . So be sure to contact me after purchasing the Indicator So that I can add you for training and support . If you find any difficulty with installation then send me Direct message here So that I can connect with you via Anydesk or Teamview for the product installation. " Smart Order Block Indicator " to find m
Signal GoldRush Trend Arrow L'indicateur GoldRush Trend Arrow Signal fournit une analyse précise et en temps réel des tendances, spécialement conçue pour les scalpers à haute vitesse et à court terme sur la paire XAU/USD. Conçu spécialement pour les intervalles de temps d'une minute, cet outil affiche des flèches directionnelles indiquant clairement les points d'entrée, ce qui permet aux scalpers de naviguer en toute confiance dans des conditions de marché volatiles. L'indicateur se compose
L'indicateur « Dynamic Scalper System » est conçu pour la méthode de scalping, permettant de trader au sein des vagues de tendance. Testé sur les principales paires de devises et l'or, il est compatible avec d'autres instruments de trading. Fournit des signaux pour l'ouverture de positions à court terme le long de la tendance, avec un support supplémentaire pour les fluctuations de prix. Principe de l'indicateur : De grandes flèches déterminent la direction de la tendance. Un algorithme de gén
PZ Trend Trading
PZ TRADING SLU
4.8 (5)
Capture every opportunity: your go-to indicator for profitable trend trading Trend Trading is an indicator designed to profit as much as possible from trends taking place in the market, by timing pullbacks and breakouts. It finds trading opportunities by analyzing what the price is doing during established trends. [ Installation Guide | Update Guide | Troubleshooting | FAQ | All Products ] Trade financial markets with confidence and efficiency Profit from established trends without getting whips
GOLD Impulse with Alert
Bernhard Schweigert
4.67 (12)
Cet indicateur est une super combinaison de nos 2 produits Advanced Currency IMPULSE with ALERT  +   Currency Strength Exotics . Il fonctionne pour tous les cadres temporels et montre graphiquement l'impulsion de force ou de faiblesse pour les 8 principales devises plus un symbole ! Cet indicateur est spécialisé pour montrer l'accélération de la force des devises pour tout symbole comme l'or, les paires exotiques, les matières premières, les indices ou les contrats à terme. C'est le premier
Day Trader Master est un système de trading complet pour les day traders. Le système se compose de deux indicateurs. Un indicateur est un signal fléché pour acheter et vendre. C'est l'indicateur de flèche que vous obtenez. Je vous fournirai le deuxième indicateur gratuitement. Le deuxième indicateur est un indicateur de tendance spécialement conçu pour être utilisé conjointement avec ces flèches. LES INDICATEURS NE RÉPÉTENT PAS ET NE TARDENT PAS! L'utilisation de ce système est très simple. Il v
Advanced Supply Demand
Bernhard Schweigert
4.91 (300)
Offre spéciale : 40 % de réduction La solution idéale pour les traders débutants comme experts ! Cet indicateur est un outil de trading unique, performant et abordable grâce à l’intégration de nombreuses fonctionnalités exclusives et d’une nouvelle formule. Cette mise à jour vous permet d’afficher des zones sur deux unités de temps. Vous pourrez ainsi visualiser non seulement une unité de temps supérieure, mais aussi l’unité de temps du graphique, ainsi que l’unité de temps supérieure : des z
Gold Scalper Super
Aleksandr Makarov
5 (2)
Gold Scalper Super is an easy-to-use trading system. The indicator can be used as a standalone scalping system on the M1 time frame, as well as part of your existing trading system. Bonus: when purchasing an indicator, Trend Arrow Super is provided free of charge, write to us after purchase. The indicator 100% does not repaint!!! If a signal appears, it does not disappear! Unlike indicators with redrawing, which lead to the loss of a deposit, because they can show a signal and then remove it.
CRT Candle Range Theory HTF MT4.   Ultimate CRT Indicator: Advanced ICT Concepts and Malaysian SnR Trading System Discounted   Price   $50  !!     Secure your lifetime access   now   before it switches to   subscription-only ! Master the Market Maker's Footprints with the Most Advanced Candle Range Theory Indicator Unlock the true power of   Smart Money Concepts (SMC)   and trade precisely like the institutions with the   Ultimate CRT Indicator . Built exclusively for serious traders, this indic
Identify key turning points with reliable fractal analysis This indicator examines the price structure of fractals of different periods to determine possible reversal points in the market, providing timing to positional traders that already have a fundamental or technical valuation model. Unlike its younger brother, Reversal Fractals , this indicator won't miss reversals because of the period selected, and will find reversal fractals on a zig-zag fashion, ignoring those reversals which do not
PZ Support Resistance
PZ TRADING SLU
3.33 (3)
Unlock key market insights with automated support and resistance lines Tired of plotting support and resistance lines? This is a multi-timeframe indicator that detects and plots supports and resistance lines in the chart with the same precision as a human eye would. As price levels are tested over time and its importance increases, the lines become thicker and darker, making price leves easy to glance and evaluate. [ Installation Guide | Update Guide | Troubleshooting | FAQ | All Products ] Boos
Super Signal – Skyblade Edition Système de signaux de tendance professionnel sans repaint / sans latence, avec un taux de réussite exceptionnel | Pour MT4 / MT5 Il fonctionne mieux sur des unités de temps inférieures, comme 1 minute, 5 minutes et 15 minutes. Caractéristiques principales : Super Signal – Skyblade Edition est un système de signaux intelligent conçu spécifiquement pour le trading de tendance. Il utilise une logique de filtrage multicouche pour détecter uniquement les mouvements d
They say history repeats itself. What if you could prove it in real-time? The Propfolio Ghost Pattern is an advanced algorithmic pattern-matching engine. It empowers you to select any current price action structure on your chart and instantly scan thousands of historical candles to find the exact moment in the past where the market did the exact same thing. Once it finds the highest probability match, it projects the historical outcome into the future as "Ghost Candles"—giving you a highly calcu
ACTUELLEMENT 26% DE RÉDUCTION ! !! Cet indicateur est une super combinaison de nos deux indicateurs principaux ( Advanced Currency Strength 28   &  Advanced Currency IMPULSE with ALERT ). Il montre les valeurs de force de la devise pour les TICK-UNITS et les signaux d'alerte pour 28 paires Forex. 11 unités de tic-tac différentes peuvent être utilisées. Ce sont 1, 2, 3, 4, 5, 6, 10, 12, 15, 20 et 30 secondes. La barre de Tick-Unit dans la sous-fenêtre sera affichée et déplacée vers la gauche lo
Atomic Analyst
Issam Kassas
5 (5)
Tout d'abord, il convient de souligner que cet indicateur de trading n'est ni repainting, ni redrawing et ne présente aucun délai, ce qui le rend idéal à la fois pour le trading manuel et automatisé. Manuel de l'utilisateur : réglages, entrées et stratégie. L'Analyste Atomique est un indicateur d'action sur les prix PA qui utilise la force et le momentum du prix pour trouver un meilleur avantage sur le marché. Équipé de filtres avancés qui aident à éliminer les bruits et les faux signaux, et à
Trend Screener
STE S.S.COMPANY
4.79 (95)
Indicateur de tendance, solution unique révolutionnaire pour le trading et le filtrage des tendances avec toutes les fonctionnalités de tendance importantes intégrées dans un seul outil ! Il s'agit d'un indicateur multi-période et multi-devises 100 % non repeint qui peut être utilisé sur tous les symboles/instruments : forex, matières premières, crypto-monnaies, indices et actions. OFFRE À DURÉE LIMITÉE : L'indicateur Support and Resistance Screener est disponible pour seulement 65 $ et à vie. (
Contactez-moi après l'achat pour obtenir un EA en bonus basé sur cet indicateur. La Self Optimizing Double MA Strategy est un outil de trading de niveau professionnel conçu pour éliminer les approximations de paramètres. Propulsé par un moteur d'auto-optimisation intégré, il s'adapte continuellement aux conditions changeantes du marché en simulant des milliers de combinaisons de paramètres en arrière-plan afin de maintenir un avantage statistique. Au lieu de s'appuyer sur des paramètres statiqu
Bull versus Bear
Mohamed Hassan
4.5 (18)
Send us a message after your purchase to receive more information on how to get your  BONUS  for FREE  that works in great combination with Bull vs Bear ! Bull versus Bear is an easy-to-use Forex indicator that gives traders clear and accurate signals based on clear trend retests . Forget about lagging indicators or staring at charts for hours because  Bull vs Bear provides real-time entries with no lag and no repaint, so you can trade with confidence. Bull vs Bear  helps you enter trades during
ACTUELLEMENT 40% DE RÉDUCTION La meilleure solution pour tout débutant ou trader expert ! Cet indicateur est un outil de trading unique, de haute qualité et abordable car nous avons incorporé un certain nombre de caractéristiques exclusives et une nouvelle formule. Avec seulement UN graphique, vous pouvez lire la force de la devise pour 28 paires Forex ! Imaginez comment votre trading va s'améliorer parce que vous êtes capable de repérer le point de déclenchement exact d'une nouvelle tendance
Un indicateur technique qui structure les graphiques et identifie les mouvements de prix cycliques. Peut fonctionner sur n'importe quel graphique. Plusieurs types de notifications. Il y a des flèches supplémentaires sur le graphique lui-même. Sans revenir sur l'histoire, fonctionne sur la fermeture de la bougie. TF recommandé à partir de M5 et plus. Facile à utiliser et à configurer les paramètres. Lorsque vous utilisez 2 indicateurs avec des paramètres différents, vous pouvez les utiliser sans
Special offer : ALL TOOLS , just $35 each! New tools   will be   $30   for the   first week   or the   first 3 purchases !  Trading Tools Channel on MQL5 : Join my MQL5 channel to update the latest news from me Le Fibonacci Confluence Toolkit Multi-Timeframe est un outil avancé d'analyse technique conçu pour les traders professionnels, aidant à identifier les zones potentielles de renversement des prix en combinant des signaux et des modèles clés du marché. Avec des capacités d'affichage multi-
Plus de l'auteur
Double Correlation indicator (free) plots two windowed correlations in a separate window.  the size of window is taken as input before the two symbols to correlate to. Two symbols are taken as an input parameters as well as period length. and the two correlations are computed with the currently shown symbol ex: input GBPJPY and AUDNZD.  current symbol EURUSD then the following will be computed corr(EURUSD,GBPJPY) and corr(EURUSD,AUDNZD) The indicator can be useful to run a multi-symbol pair trad
FREE
Filtrer:
Aucun avis
Répondre à l'avis