Orion Vwap Bands

Fundamentação teórica


A VWAP é uma média móvel ajustada pelo volume, ou seja, o peso de cada preço corresponde ao volume de ações negociadas no período, dando mais importância ao período em que se tenha mais negociações.

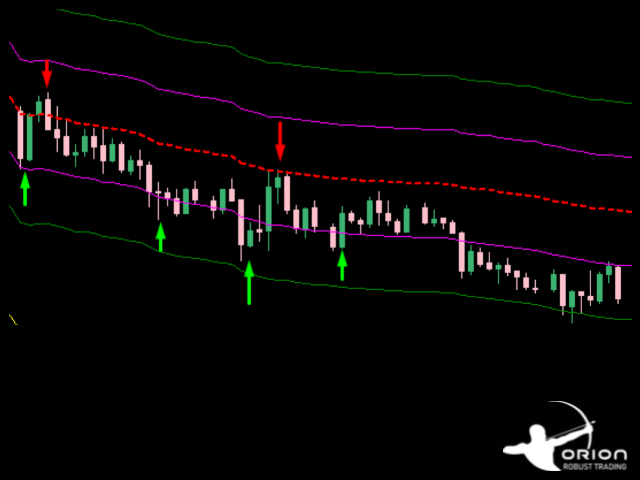
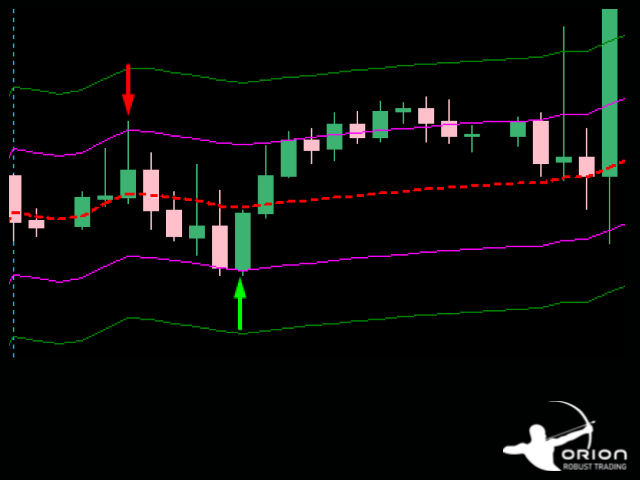
A Orion Vwap Bands permite que o usuário use plote 8 bandas que podem ser utilizadas como suportes e resistências para o preço. Cada banda é calculada a partir da Vwap Tradicional:
Ex.: Se escolhermos o valor 0.25 para a plotagem da Banda 1, pega-se o preço da Vwap e acrescenta-se 25%.
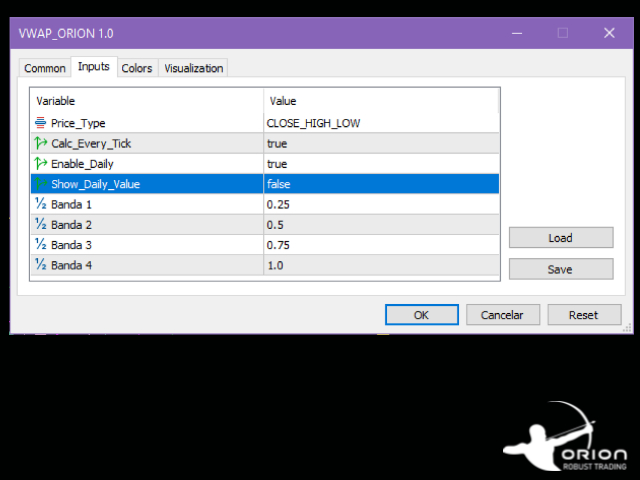
Opções


É possível configurar as cores e largura das bandas assim como a forma de calcular a Vwap.


Produits recommandés
Simple VWAP
Abraao Moreira
4 (1)
Fundamentação teórica A VWAP é uma média móvel ajustada pelo volume, ou seja o peso de cada preço corresponde ao volume de ações negociadas no período, dando mais importância ao período em que se tenha mais negociações. [1] VWAP = sum(price[i]*volume[i]) / sum(volume[i]) Metodologia É possível configurar o período que será utilizado para o calculo da VWAP, a cor, a espessura e o estilo da linha. A linha é desenhada desde a o começo da série disponível apenas uma vez para economizar recursos com
FREE
The Accumulation / Distribution is an indicator which was essentially designed to measure underlying supply and demand. It accomplishes this by trying to determine whether traders are actually accumulating (buying) or distributing (selling). This indicator should be more accurate than other default MT5 AD indicator for measuring buy/sell pressure by volume, identifying trend change through divergence and calculating Accumulation/Distribution (A/D) level. Application: - Buy/sell pressure: above
Gm Vwap Point
Antonio Augusto Barreto De Melo
VWAP is an intraday calculation used primarily by algorithms and institutional traders to assess where a stock is trading in relation to its weighted average volume for the day. Day traders also use VWAP to assess market direction and filter out trading signals. This indicator is used to analyze and calculate the Vwap from a certain point on the graph, which is widely used to analyze the beginning of a movement of the price relationship with the volume. - Multi Vwaps on the same chart, placed
Weis Wave Scouter
Jean Carlos Martins Roso
Découvrez la puissance de l'analyse avancée du volume avec le Weis Wave Scouter, un indicateur révolutionnaire pour MetaTrader 5 combinant les principes éprouvés de la méthode Wyckoff et de l'analyse VSA (Volume Spread Analysis). Conçu pour les traders recherchant précision et profondeur, cet indicateur fournit une lecture tactique du marché via l'analyse des vagues de volume cumulatif, aidant à identifier les points clés de retournement et de continuation de tendance. Le Weis Wave Scouter propo
Weis Wave Double Side
Eduardo Da Costa Custodio Santos
L'indicateur latéral Weis Wave Bouble pour MT5 fait partie de la boîte à outils (Wyckoff Academy Wave Market) L'indicateur latéral Weis Wave Bouble pour MT5 a été créé sur la base de la Weis Wave déjà établie créée par David Weis. L'indicateur Weis Wave Double Side lit le marché par vagues comme cela a été fait par R. Wyckoff en 1900. Il aide à identifier l'effort x le résultat, la cause et l'effet, et l'offre et la demande Son différentiel est qu'il peut être utilisé en dessous de l'axe zéro, a
WAPV Weis Wave Chart Forex
Eduardo Da Costa Custodio Santos
Le Weis Wave Chart Forex pour MT5 est un indicateur de prix et de volume. La lecture du prix et du volume a été largement diffusée par Richard Demille Wyckoff sur la base des trois lois qu'il a créées : l'offre et la demande, la cause et l'effet et l'effort contre le résultat. En 1900 R.Wyckoff utilisait déjà le wave chart dans ses analyses. De nombreuses années plus tard, vers 1990, David Weis a automatisé le diagramme d'onde de R. Wyckoff et aujourd'hui nous vous apportons l'évolution du diagr
The Market Structure Analyzer is a powerful tool designed for traders who follow market structure and smart money concepts. This comprehensive indicator provides a suite of features to assist in identifying key market levels, potential entry points, and areas of liquidity. Here's what it offers: 1. Swing High/Low Detection : Accurately identifies and marks swing highs and lows, providing a clear view of market structure. 2. Dynamic Supply and Demand Zones: Draws precise supply and demand zone
Marcon s Deviation
Luiz Antonio De Sousa Marcon
DESVIO DE MARCON  (Desvio Dinâmico de VWAP) O Desvio de Marcon é um indicador desenvolvido com o intuito de fornecer ao TRADER uma ferramenta capaz de antecipar pontos relevantes de suporte e resistência através de canais de desvios de VWAP traçados no gráfico.  Mas qual a diferença entre o Desvio de Marcon e os canais de desvio padrão da VWAP já existentes? O Desvio de Marcon utiliza um algoritmo estatístico desenvolvido por Luiz Antonio de Sousa Marcon, que lhe dá a capacidade de se auto calib
Weis Wave Double Side Alert
Eduardo Da Costa Custodio Santos
L'indicateur latéral Weis Wave Bouble pour MT5 fait partie de la boîte à outils (Wyckoff Academy Wave Market) L'indicateur latéral Weis Wave Bouble pour MT5 a été créé sur la base de la Weis Wave déjà établie créée par David Weis. L'indicateur Weis Wave Double Side lit le marché par vagues comme R. Wyckoff l'a fait en 1900. Il aide à identifier l'effort x le résultat, la cause et l'effet, et l'offre et la demande Son différentiel est qu'il peut être utilisé en dessous de l'axe zéro et dispose d'
Percent Levels
Cinthia Regina De Moraes
Indicador tipo 2mv frequência mostra os níveis percentuais no mercado financeiro que tendem a ser zonas realmente importantes para os traders. Observem que o preço segue um fluxo e uma frequência que se enquadram em canais percentuais de movimento,  tradicionalmente traçados por níveis Fibonacci. O indicador LevelsPercent traça linhas em pontos específicos de percentual configurados pelo usuário e "pode" anteceder possíveis níveis de SUPORTE e RESISTÊNCIA. A leitura do mercado e a identificação
Vwap Standard Deviation
Ricardo Almeida Branco
O indicador Vwap Deviation Bands segue na mesma linha dos outros indicadores da White Trader, que buscam leveza, personalização e qualidade, para entregar o que há de melhor para o trader. Isto, além de combinar preço e volume (informações importantes para o trader) com uma medida estatística do desvio padrão. Este indicador já foi utilizado e testado por outros traders que deram sugestões, inclusive, para chegarmos nesta versão final (embora ainda esteja aceitando sugestões, sempre :)   ). O de
WAPV Weis Wave Chart MT5
Eduardo Da Costa Custodio Santos
Le Weis Wave Chart pour MT5 est un indicateur de prix et de volume. La lecture du prix et du volume a été largement diffusée par Richard Demille Wyckoff sur la base des trois lois qu'il a créées : l'offre et la demande, la cause et l'effet et l'effort contre le résultat. En 1900 R.Wyckoff utilisait déjà le wave chart dans ses analyses. De nombreuses années plus tard, vers 1990, David Weis a automatisé le diagramme d'onde de R. Wyckoff et aujourd'hui nous vous apportons l'évolution du diagramme d
A Média Móvel é um indicador que faz parte da Análise Técnica. Com ela, é possível identificar o equilíbrio dos preços no mercado, observando tendências de alta, neutra ou baixa. Este indicador customizado traz opções extras pera definir o método de cálculo podendo-se esclolher entre SMA,EMA,SSMA,LWMA,JJMA,JurX,ParMA,T3,Vidya,AMA,HULL MA. Também conta com varias opções para escolher o método de cálculo para o preço base a ser usado no cáculo da média.
True Weis Wave
Atila Goncalves Firmino
A version based on David Waves' description in his book 'Trade About to Happen' of his adaptation of the Wyckoff wave chart. The indicator directionally accumulates volume, adding to each brick or candle close, with color indication for up and down. it can be used it with tick or real volume, it also changes color when the accumulated value of the previous wave is exceeded, being the trade signal. Yellow color is used for doji candlestick, it will continue with accumulation without zero the sum
Buy Sell Smart
Syamsurizal Dimjati
BUY and SELL smart The BUY and SELL Smart Indicator is a next-generation trading tool engineered for precision scalpers, intraday strategists, and professional analysts who demand both speed and clarity in market visualization. It seamlessly integrates smart candle-based analytics, adaptive ATR logic, and real-time economic event awareness — giving you a fully synchronized view of market volatility and momentum. Through an elegant and optimized interface, FlashScalp delivers   instant signal fee
MTF VWAP Indicator - Quick Overview   This indicator shows you where institutional money is flowing across multiple timeframes using Volume Weighted Average Price (VWAP) to identify high-probability trading zones.     What It Actually Does:     1. Tracks Smart Money Levels: - Shows Daily, Weekly, and Monthly VWAP lines where big players (banks, funds) are trading - Tells you if price is above or below these key institutional levels - Shows distance from VWAP as a percentage (tells you how extend
Weis Waves Result
Fillipe Dos Santos
The result as the name explain, displays the result of a swing. Sometimes weis waves show a big effort, but a little result... The weis waves result is a better revelation about the volume, if united with weis waves. it is a volume indicator, but it is different from a conventional volume indicator, this indicator came from the wyckoff method, if you use the result you will have a different view of the market, regardless of which asset is operating.
Volume Waves
Paulo Henrique Faquineli Garcia
One of the best tools for analyzing volume, Weis Wave was devised by David Weis to facilitate reading the directional flow. For the disciples of the Wyckoff method, this means an evolution, facilitating a predictive reading of the market, always looking for Accumulation and Distribution zones for traded assets. For better understanding, in this indicator we try to cover every reading of EFFORT (traded volume) versus RESULT (price change). Thus, you can apply the indicator on the chart twice to
The VWAP indicator is our version of the popular Volume-Weighted Average Price indicator. The VWAP is the ratio between the value traded (price multiplied by the number of volume traded) and the total volume traded over a specific time period. As a result, it measures the average price of the instrument much better than the simple moving average. Although there are many ways to use the VWAP, most investors use it to calculate the daily average.  The indicator works in five modes: Moving  - In
Fractals
Mikhail Nazarenko
The Fractals indicator displays on the chart only fractals with the specified parameters in the indicator settings. This allows you to more accurately record a trend reversal, excluding false reversals. According to the classical definition of a fractal, it is a candlestick - an extremum on the chart, which was not crossed by the price of 2 candles before and 2 candles after the appearance of a fractal candle. This indicator provides the ability to adjust the number of candles before and after t
Indicator developed by the Brazilian and analyst Odir Aguiar (Didi), consists of "Moving Averages", famously known as "Didi needles", where it allows the viewing of reversal points. The concept is very simple, when you enter 3 Moving Averages on display, a period equal to 3, one equal to 8 and the other equal to 20, then the formation of the indicator that works in axis or line center equal to 0 (zero) appears. ). Moving averages must intersect when approaching line 0. The scanner monitors 10
Vwap MT5
Sant Clear Ali Costa
reference: "High Frequency Trading, A Pratical Guide to Algorithmic Strategies and Trading Systems (Aldridge, Irene)" Characteristics The calculation of VWAP is in accordance with the literature. 4 types of VWAPs, daily, monthly, yearly, moving. Note: Daily is the most popular form, the calculation is performed from the beginning to the end of each trading session (Market benchmark). In the moving, the calculation is carried out from n periods past to the current period, as with the famous m
Wapv Price and volume
Eduardo Da Costa Custodio Santos
L'indicateur de prix et de volume WAPV pour MT5 fait partie de l'ensemble d'outils (Wyckoff Academy Wave Market) et (Wyckoff Academy Price and Volume). L'indicateur de prix et de volume WAPV pour MT5 a été créé pour faciliter la visualisation intuitive du mouvement du volume sur le graphique. Avec lui, vous pouvez observer les moments de pic de volume et les moments où le marché n'a aucun intérêt professionnel Identifiez les moments où le marché évolue par inertie et non par mouvement de "smart
Intraday Vwap Orion
Joao Paulo Botelho Silva
Theory VWAP is a volume-weighted moving average, bringing greater relevance to prices. The VWAP base calculation follows the classic formula described in Investopedia ( https://www.investopedia.com/terms/v/vwap.asp ). VWAP = sum(typical price[i]*volume[i]) / sum(volume[i]) Functionalities Orion Intraday VWAP innovates by allowing the user to choose between the conventional Daily, Weekly and Monthly periods, also having the option of calculating the Intraday indicator, as used in other platform
PNA Vwap
Le Trung Kien Hoang
Pna Vwap: Professional Multi-Timeframe VWAP Gain a professional edge and trade with institutional clarity. Pna Vwap is a powerful, all-in-one VWAP system Stop guessing the true market trend. Pna Vwap provides a clean, multi-dimensional view of the market by showing the real, volume-weighted average price across three critical timeframes. Understand where the value is, identify who is in control, and make trading decisions with greater confidence. Core Features & Key Advantages This is not a ba
FREE
Mini Chart Indicators
Flavio Javier Jarabeck
The Metatrader 5 has a hidden jewel called Chart Object, mostly unknown to the common users and hidden in a sub-menu within the platform. Called Mini Chart, this object is a miniature instance of a big/normal chart that could be added/attached to any normal chart, this way the Mini Chart will be bound to the main Chart in a very minimalist way saving a precious amount of real state on your screen. If you don't know the Mini Chart, give it a try - see the video and screenshots below. This is a gr
Midas is the acronym for Market Interpretation / Data Analysis System is a trade approach started in 1995 by technical analyst Paul Levine and later developed by Andrew Coles, PhD and David Hawkins. Learn more in the book MIDAS Technical Analysis: A VWAP Approach to Trading and Investing in Today's Markets , (I saw that it is possible buy via Amazon). The positive points in relation to the Midas-based indicators are the prediction of movement reversal points, the negative point is the subjectivi
VWAP Daily
Anton Polkovnikov
Weighted average price indicator or VWAP. The well-known standard VWAP with the beginning of the day is added with the function of selecting the periodization. It can be calculated both every day and on other periods. Also the indicator allows to exclude the volume from the calculation, which will allow using it on the cryptocurrencies and forex. There is an alert for a VWAP price crossing. There are 1 and 2 standard deviation. Settings: Volume: turning volume on and off in the calculation mecha
Engulfing with EMAs Indicator Unlock the power of advanced candlestick pattern detection with the Engulfing with EMAs Indicator , a cutting-edge tool designed for MetaTrader 5. This futuristic indicator combines the precision of engulfing pattern analysis with the trend-following strength of Exponential Moving Averages (EMA 21 and EMA 50), empowering traders to identify high-probability setups across all currency pairs and timeframes. Key Features: Comprehensive Engulfing Detection : Detects b
up down v6 for mt5 is no repaint all timeframe and all pairs indicator. red histogram cros trigger that is up point,and put a red point on histogram. and blue histogram cros trigger that is deep point.and put blue point on histogram. this indicator need to sometimes zoom out .for thise pres + button. if newly comes signal is too high makes before invisible.red and blue points are there.to see the signals. indicator is no repaint and can use all time frame and all pairs. only need minimum 500 bar
Les acheteurs de ce produit ont également acheté
SuperScalp Pro
Van Minh Nguyen
4.57 (21)
SuperScalp Pro – Système d’indicateur de scalping avancé multi-filtres SuperScalp Pro est un système d’indicateur de scalping avancé qui combine le Supertrend classique avec plusieurs filtres de confirmation intelligents. L’indicateur fonctionne efficacement sur toutes les unités de temps de M1 à H4 et est particulièrement adapté à XAUUSD, BTCUSD et aux principales paires Forex. Il peut être utilisé comme système autonome ou intégré de manière flexible dans des stratégies de trading existantes.
Entry In The Zone and SMC Multi Timeframe is a real-time 2-in-1 market analysis tool that combines market structure analysis and a No Repaint BUY / SELL signal system into a single indicator, built on Smart Money Concepts (SMC) — a widely adopted framework used by professional traders to understand market structure. This indicator helps you see the market more clearly, make decisions based on structure rather than guesswork, and focus on high-probability zones where price is more likely to react
Divergence Bomber
Ihor Otkydach
4.9 (86)
Chaque acheteur de cet indicateur reçoit également gratuitement : L’outil exclusif « Bomber Utility », qui accompagne automatiquement chaque opération de trading, fixe les niveaux de Stop Loss et de Take Profit, et clôture les positions selon les règles de la stratégie Des fichiers de configuration (set files) pour adapter l’indicateur à différents actifs Des set files pour configurer le Bomber Utility selon différents modes : « Risque Minimum », « Risque Équilibré » et « Stratégie d’Attente » U
Azimuth Pro
Ottaviano De Cicco
5 (6)
Azimuth Pro V2: Synthetic Fractal Structure and Confirmed Entries for MT5 Overview Azimuth Pro is a multi-level swing structure indicator by Merkava Labs . Four nested swing layers, swing-anchored VWAP, ABC pattern detection, three-timeframe structural filtering, and closed-bar confirmed entries — one chart, one workflow from micro-swings to macro-cycles. This is not a blind signal product. It is a structure-first workflow for traders who care about location, context, and timing. V2 Launch Offe
Quantum TrendPulse
Bogdan Ion Puscasu
5 (23)
Présentation de   Quantum TrendPulse   , l'outil de trading ultime qui combine la puissance de   SuperTrend   ,   RSI   et   Stochastic   dans un seul indicateur complet pour maximiser votre potentiel de trading. Conçu pour les traders qui recherchent précision et efficacité, cet indicateur vous aide à identifier les tendances du marché, les changements de dynamique et les points d'entrée et de sortie optimaux en toute confiance. Caractéristiques principales : Intégration SuperTrend :   suivez f
Gann Made Easy   est un système de trading Forex professionnel et facile à utiliser qui est basé sur les meilleurs principes de trading en utilisant la théorie de mr. WD Gann. L'indicateur fournit des signaux d'ACHAT et de VENTE précis, y compris les niveaux Stop Loss et Take Profit. Vous pouvez échanger même en déplacement en utilisant les notifications PUSH. VEUILLEZ ME CONTACTER APRÈS L'ACHAT POUR RECEVOIR GRATUITEMENT DES INSTRUCTIONS DE TRADING ET D'EXCELLENTS INDICATEURS SUPPLÉMENTAIRES! V
Si vous achetez cet indicateur, vous recevrez mon Gestionnaire de Trading Professionnel + EA  GRATUITEMENT. Tout d'abord, il convient de souligner que ce système de trading est un indicateur non repeint, non redessiné et non retardé, ce qui le rend idéal pour le trading manuel et automatisé. Cours en ligne, manuel et téléchargement de préréglages. Le "Système de Trading Smart Trend MT5" est une solution de trading complète conçue pour les traders débutants et expérimentés. Il combine plus de 10
FX Trend MT5 NG
Daniel Stein
5 (4)
FX Trend NG : La Nouvelle Génération d’Intelligence de Tendance Multi-Marchés Vue d’ensemble FX Trend NG est un outil professionnel d’analyse de tendance multi-timeframe et de surveillance des marchés. Il vous permet de comprendre la structure complète du marché en quelques secondes. Au lieu de naviguer entre de nombreux graphiques, vous identifiez immédiatement quels instruments sont en tendance, où le momentum s’affaiblit et où plusieurs unités de temps sont alignées. Offre de Lancement – Ob
OmniSync Projection
Antonio-alin Teculescu
5 (1)
Chronos Fractal Engine is an innovative price projection indicator for MetaTrader 5, designed to transform your technical analysis by intelligently identifying and projecting historical price patterns. Built upon an advanced correlation algorithm and the fractal principles of the market, this powerful tool visualizes potential future price movements, giving you a unique edge in your trading decisions. What is Chronos Fractal Engine? At its core, the Chronos Fractal Engine employs a sophisticat
Présentation       Quantum Breakout PRO   , l'indicateur révolutionnaire MQL5 qui transforme la façon dont vous négociez les zones d'évasion ! Développé par une équipe de traders expérimentés avec une expérience commerciale de plus de 13 ans,       Évasion quantique PRO       est conçu pour propulser votre parcours commercial vers de nouveaux sommets grâce à sa stratégie de zone de discussion innovante et dynamique. Quantum Breakout Indicator vous donnera des flèches de signalisation sur les z
Power Candles MT5
Daniel Stein
4.75 (8)
Power Candles – Signaux d’entrée basés sur la force pour tous les marchés Power Candles intègre l’analyse de force éprouvée de Stein Investments directement dans le graphique des prix. Au lieu de réagir uniquement au prix, chaque bougie est colorée en fonction de la force réelle du marché, ce qui permet d’identifier instantanément les phases de momentum, l’accélération de la force et les transitions de tendance propres. Une logique unique pour tous les marchés Power Candles fonctionne automatiqu
CGE Trading Suite
Carl Gustav Johan Ekstrom
5 (2)
Institutional-Grade Analytics for MT5 C GE Trading Suite delivers the analytical edge typically reserved for professional trading desks. The platform integrates a full suite of analytical tools into one seamless workflow: dynamic grid mapping, liquidity behavior analysis, ECM, trend lines, MIDAS, trade cycles, and directional channel projections. Together, these provide a unified view of market structure and momentum. Directional clarity is further enhanced by the capital flow index, which meas
Voyez quelle strategie fonctionne reellement sur votre symbole - avant de risquer de l'argent reel. Power Bar detecte les barres de prix extremes sur n'importe quel symbole et n'importe quel timeframe, puis backteste instantanement 3 strategies de trading differentes pour que vous puissiez comparer les taux de reussite, les facteurs de profit et les P&L cote a cote. Le tout dans un seul panneau interactif. Pas de suppositions. Pas de suroptimisation. Juste des donnees. Qu'est-ce qui rend Power
Meridian Pro
Ottaviano De Cicco
5 (1)
Meridian Pro: Professional Multi-Timeframe Trend Matrix for MT5 Overview Meridian Pro is a multi-timeframe trend matrix by Merkava Labs that compresses directional state, strength, momentum condition and matrix agreement into one compact panel. One adaptive engine, applied consistently from M1 to W1. No per-symbol tuning. No indicator stacking. One structured readout across every asset and every timeframe. Launch Offer — Get Meridian Pro for USD 99 (introductory). Regular price: USD 149. 1. Why
Grabber System MT5
Ihor Otkydach
4.83 (23)
Je vous présente un excellent indicateur technique : Grabber, qui fonctionne comme une stratégie de trading "tout-en-un", prête à l'emploi. En un seul code sont intégrés des outils puissants d'analyse technique du marché, des signaux de trading (flèches), des fonctions d'alerte et des notifications push. Chaque acheteur de cet indicateur reçoit également gratuitement : L'utilitaire Grabber : pour la gestion automatique des ordres ouverts Un guide vidéo étape par étape : pour apprendre à installe
Trend Screener Pro MT5
STE S.S.COMPANY
4.85 (104)
Indicateur de tendance, solution unique révolutionnaire pour le trading et le filtrage des tendances avec toutes les fonctionnalités de tendance importantes intégrées dans un seul outil ! Il s'agit d'un indicateur multi-période et multi-devises 100 % non repeint qui peut être utilisé sur tous les symboles/instruments : forex, matières premières, crypto-monnaies, indices et actions. Trend Screener est un indicateur de suivi de tendance efficace qui fournit des signaux de tendance fléchés avec des
Commençons par être honnêtes. Aucun indicateur ne vous rendra rentable à lui seul. Si quelqu’un vous dit le contraire, il vous vend un rêve. Tout indicateur qui affiche des flèches parfaites d’achat/vente peut être rendu impeccable — il suffit de zoomer sur la bonne partie de l’historique et de capturer uniquement les trades gagnants. Nous ne faisons pas cela.  SMC Intraday Formula est un outil. Il lit la structure du marché pour vous, identifie les zones de prix à la probabilité la plus élevée
Btmm state engine pro
Garry James Goodchild
5 (4)
BTMM State Engine Pro is a MetaTrader 5 indicator for traders who use the Beat The Market Maker approach: Asian session context, kill zone timing, level progression, peak formation detection, and a multi-pair scanner from a single chart. It combines cycle state logic with a built-in scanner dashboard so you do not need the same tool on many charts at once. What it does Draws the Asian session range; session times can follow broker server offset or be set in inputs. Tracks level progression (L
Atomic Analyst MT5
Issam Kassas
3.94 (31)
Tout d'abord, il convient de souligner que cet indicateur de trading n'est ni repainting, ni redrawing et ne présente aucun délai, ce qui le rend idéal à la fois pour le trading manuel et automatisé. Manuel de l'utilisateur : réglages, entrées et stratégie. L'Analyste Atomique est un indicateur d'action sur les prix PA qui utilise la force et le momentum du prix pour trouver un meilleur avantage sur le marché. Équipé de filtres avancés qui aident à éliminer les bruits et les faux signaux, et à
Crystal Heikin Ashi Signals
Muhammad Jawad Shabir
5 (2)
Crystal Heikin Ashi Signals - Professional Trend & Signal Detection Indicator Advanced Heikin Ashi Visualization with Intelligent Signal System for Manual & Automated Trading Final Price: $149 ---------> Price goes up $10 after every 10 sales . Limited slots available — act fast . Overview Crystal Heikin Ashi Signals is a professional-grade MetaTrader 5 indicator that combines pure Heikin Ashi candle visualization with an advanced momentum-shift detection system. Designed for both manual traders
Smart Stop Indicator – Précision intelligente du stop-loss directement sur votre graphique Présentation Smart Stop Indicator est la solution idéale pour les traders qui souhaitent placer leur stop-loss de manière claire et méthodique, sans deviner ni suivre leur intuition. Cet outil combine la logique classique de price action (succession de plus hauts et de plus bas) avec une reconnaissance moderne des cassures pour identifier le prochain niveau de stop réellement logique. Que le marché soit
FX Power MT5 NG
Daniel Stein
5 (31)
FX Power : Analysez la force des devises pour des décisions de trading plus intelligentes Aperçu FX Power est l'outil essentiel pour comprendre la force réelle des principales devises et de l'or, quelles que soient les conditions du marché. En identifiant les devises fortes à acheter et les faibles à vendre, FX Power simplifie vos décisions de trading et révèle des opportunités à forte probabilité. Que vous suiviez les tendances ou anticipiez les retournements à l'aide de valeurs extrêmes de D
Dark Absolute Trend MT5
Marco Solito
4.57 (14)
Dark Absolute Trend   is an Indicator for intraday trading. This Indicator is based on   Trend Following  strategy but use also candlestick patterns and Volatility. We can enter in good price with this Indicator, in order to follow the main trend on the current instrument. It is advised to use low spread ECN brokers. This Indicator does   Not repaint   and   N ot lag . Recommended timeframes are M5, M15 and H1. Recommended working pairs: All. I nstallation and  Update Guide   -  Troubleshooting
RelicusRoad Pro : Système d'Exploitation Quantitatif du Marché 70% DE RÉDUCTION ACCÈS À VIE (DURÉE LIMITÉE) - REJOIGNEZ 2 000+ TRADERS Pourquoi la plupart des traders échouent-ils même avec des indicateurs "parfaits" ? Parce qu'ils tradent des concepts isolés dans le vide. Un signal sans contexte est un pari. Pour gagner, il faut de la CONFLUENCE . RelicusRoad Pro est un Écosystème Quantitatif complet . Il cartographie la "Fair Value Road", distinguant le bruit des cassures structurelles. Arrête
Market Structure Order Block Dashboard MT5 est un indicateur MT5 conçu pour les traders qui veulent lire la structure de marché et les principales zones de réaction du prix directement sur le graphique. Il combine BOS, ChoCH, Order Blocks, Fair Value Gaps (FVG), Liquidité, Kill Zones, Volume Profile, et un dashboard compact pour une analyse rapide. Cet indicateur s’adresse aux traders qui utilisent la structure de marché, les concepts ICT et Smart Money comme cadre de décision. Il peut aider à r
ARICoins
Temirlan Kdyrkhan
ARICoin is a powerful trading companion designed to generate high-probability entry signals with dynamic TP/SL/DP levels based on volatility. Built-in performance tracking shows win/loss stats, PP1/PP2 hits, and success rates all updated live. Key Features: Buy/Sell signals with adaptive volatility bands Real-time TP/SL/DP levels based on ATR Built-in MA Filter with optional ATR/StdDev volatility Performance stats panel (Success, Profit/Loss, PP1/PP2) Alerts via popup, sound, push, or email Cust
ARIPoint
Temirlan Kdyrkhan
ARIPoint is a powerful trading companion designed to generate high-probability entry signals with dynamic TP/SL/DP levels based on volatility. Built-in performance tracking shows win/loss stats, PP1/PP2 hits, and success rates all updated live. Key Features: Buy/Sell signals with adaptive volatility bands Real-time TP/SL/DP levels based on ATR Built-in MA Filter with optional ATR/StdDev volatility Performance stats panel (Success, Profit/Loss, PP1/PP2) Alerts via popup, sound, push, or email Cu
Meravith Scanner
Ivan Stefanov
5 (1)
MERAVITH SCANNER est un indicateur professionnel pour les marchés financiers sur MetaTrader 5, qui regroupe plusieurs outils d’analyse en un seul système intégré. Il effectue tous les calculs automatiquement en utilisant une méthodologie propriétaire de prix moyen pondéré par le volume (VWAP), éliminant ainsi toute interprétation subjective. Cet indicateur fonctionne sur toutes les classes d’actifs (Forex, actions, indices, matières premières, cryptomonnaies) et sur toutes les périodes, de M1 au
Market Structure Patterns
Samuel Manoel De Souza
4.47 (19)
Disponible pour   MT4   et   MT5 . Rejoignez le canal Market Structure Patterns pour télécharger des documents d'étude et/ou des informations supplémentaires. Articles connexes : Market Structure Patterns - Introdução Beyond Fancy Order Blocks: Using True Volumetric Analysis with Market Structure Patterns & Timeless Charts Market Structure Patterns – Complete SMC Indicator Guide (Concepts + Settings) Market Structure Patterns   est un indicateur basé sur les   Smart Money Concepts   qui affich
Blahtech Supply Demand MT5
Blahtech Limited
4.54 (13)
Was: $299  Now: $99  Supply Demand uses previous price action to identify potential imbalances between buyers and sellers. The key is to identify the better odds zones, not just the untouched ones. Blahtech Supply Demand indicator delivers functionality previously unavailable on any trading platform. This 4-in-1 indicator not only highlights the higher probability zones using a multi-criteria strength engine, but also combines it with multi-timeframe trend analysis, previously confirmed swings a
Plus de l'auteur
Intraday Vwap Orion
Joao Paulo Botelho Silva
Theory VWAP is a volume-weighted moving average, bringing greater relevance to prices. The VWAP base calculation follows the classic formula described in Investopedia ( https://www.investopedia.com/terms/v/vwap.asp ). VWAP = sum(typical price[i]*volume[i]) / sum(volume[i]) Functionalities Orion Intraday VWAP innovates by allowing the user to choose between the conventional Daily, Weekly and Monthly periods, also having the option of calculating the Intraday indicator, as used in other platform
Orion Dynamic Keltner
Joao Paulo Botelho Silva
Theoretical Foundation   The Keltner Channels are channels ploted using volatility deviations above and bellow a moving average. The indicator is an excellent tool to help the trader build trend and mean-reversion strategies.   Parameters   The Orion Dynamic Keltner allows the user to select the Volatility Calculation Type, being ATR or Average Range (not considering price gaps). Also, the user can select the Calculation Period, Number of Deviations, Moving Average Mode and the Moving Average Ca
Orion Average Range
Joao Paulo Botelho Silva
Theoretical Foundation   Similar to the well-known Average True Range (ATR), the Average Range indicator is a volatility measure that is calculated using only the range of the bars (high – low), not considering the Gaps, as with the ATR. The Average Range can be very useful for day traders as it allows one to get the measure of the volatility of the last N bars. Parameters   You can select the calculation period of the indicator.
Orion Dynamic Range Breakout
Joao Paulo Botelho Silva
Orion Dynamic Range Breakout  allows the trader to use one of the most robust trading strategies of all times, the Opening Range Breakout, which can be adapted to work in many different Symbols. Also, it allows the user to use many variations of breakout ranges and risk/profit parameters. Theoretical Basis Range Breakouts are widely used by a lot of big names in the trading industry. They were popularized by the hedge fund manager  Toby Crabel , which made a lot of success using the strategy in
Orion Flexible Mean Reversion
Joao Paulo Botelho Silva
The Orion Flexible Mean Reversion EA allows traders to develop numerous mean reversion strategies. The EA incorporates various indicators for developing robust entry and exit strategies that can be adapted to function in various time frames and markets.   Theoretical Basis Mean reversion strategies aim to enter in the opposite direction of exhaustion movements, seeking a price reversal. They are excellent ways for traders to diversify their portfolios building high winning rates strategies.   Ho
Orion Telegram Notifier Bot  allows the trader to receive trade notifications in his Telegram whenever a position is opened or closed. The EA sends notifications showing the Symbol, Magic Number, Direction, Lot (Volume), Entry Price, Exit Price, Take Profit, Stop-Loss and Profit of the position. How to setup Orion Telegram Notifier? Open Telegram and Search for “BotFather” Click or Type “/newbot” Create a nickname and username (Example: nickname: MT5trades   - username: MT5TelegramBot) *The use
Filtrer:
Aucun avis
Répondre à l'avis